http://wrap.warwick.ac.uk
Original citation:
Wang, Ying, Penfold, Christopher A., Hodgson, David A., Gifford, Miriam L. and
Burroughs, Nigel John. (2014) Correcting for link loss in causal network inference
caused by regulator interference. Bioinformatics . ISSN 1367-4803
Permanent WRAP url:
http://wrap.warwick.ac.uk/61961
Copyright and reuse:
The Warwick Research Archive Portal (WRAP) makes this work of researchers of the
University of Warwick available open access under the following conditions.
This article is made available under the Creative Commons Attribution 3.0 (CC BY 3.0)
license and may be reused according to the conditions of the license. For more details
see:
http://creativecommons.org/licenses/by/3.0/
A note on versions:
The version presented in WRAP is the published version, or, version of record, and may
be cited as it appears here.
Correcting for link loss in causal network inference
caused by regulator interference
Ying Wang
1, Christopher A. Penfold
1, David A. Hodgson
2, Miriam L.
Gifford
2, and Nigel J. Burroughs
1∗1Warwick Systems Biology Centre and2School of Life Sciences, University of Warwick,
Coventry CV4 7AL, UK
ABSTRACT
Motivation: There are a number of algorithms to infer causal
regulatory networks from time-series (gene expression) data. Here we analyse the phenomena of regulator interference, where regulators with similar dynamics mutually suppress both the probability of regulating a target and the associated link strength; for instance interference between two identical strong regulators reduces link probabilities by about 50%.
Results: We construct a robust method to define an interference
corrected causal network based on an analysis of the conditional link probabilities that recovers links lost through interference. On a large real network (Streptomyces coelicolor, phosphate depletion) we demonstrate that significant interference can occur between regulators with a correlation as low as 0.865, losing an estimated 34% of links by interference. However, levels of interference cannot be predicted from the correlation between regulators alone and are data specific. Validating against known networks we show that high numbers of functional links are lost by regulator interference. Performance against other methods on DREAM4 data is excellent.
Availability: The method is implemented in R and is publically
available as the NIACS package at:
http://www2.warwick.ac.uk/fac/sci/systemsbiology/research/software.
Contact:[email protected]
Supplementary information:Supplementary materials are available
atBioinformaticsonline.
1 INTRODUCTION
The falling costs of global gene expression (transcriptome) measurement by microarrays, and more recently next generation sequencing has spurred the development of network inference techniques (Werhli et al., 2006; Bansal et al., 2007; Margolin and Califano et al., 2007; Markowetz and Spang, 2007; Hache et al., 2009; Olsen et al., 2009; De Smet and Marchal, 2010; Penfold and Wild, 2011; Emmert-Streib et al., 2012; Maetschke et al., 2013). Of particular interest, given their direct bearing on mechanisms of regulation and information flow through the cell, is the identification of causal regulatory signals, the associated directed (causal) networks and regulatory pathways. Time series
∗to whom correspondence should be addressed
experiments potentially capture these signals, but because of low temporal resolution of transcriptome data only simple models can be used for analysis. The most basic is a linear auto-regression model (Opgen-Rhein and Strimmer, 2007; Lebre, 2009; Morrissey et al., 2010),
Xit+1=µi+ G
X
j=1
BijXjt+εti, (1)
whereXit is the (log) expression level of genei(i = 1,· · ·, G) at timet(t = 1,· · ·, T),Bijis the connectivity strength,µithe additive constant andεtiGaussian noiseN(0, λ
−1
i ), (precisionλi). Despite the simplicity of these models, inference is computationally intensive given the high number of regressors; expression data on 1000 to 10,000s of genes is typical depending on the experimental conditions and organism, and potentially greater if gene models (RNA splicing/transcripts) are distinguished. A factor that considerably aids identification of regulatory links in these systems is the fact that biological networks are sparse, i.e. the connectivity matrixB = (Bij)is sparse with the average number of regulators per gene being much smaller than the number of genes. Part of this sparsity results from the fact that only a subset of genes (more specifically their associated proteins) can be regulators; the set of potential regulators can thus be restricteda priorito those identified from bioinformatic/literature considerations as potential regulators, thereby reducing computation considerably.
Sparse network models (Morrissey et al., 2010, 2011) use Gibbs variable selection methods to determine which elements of the matrix B are present in the regression; specifically the prior on Bij allows it to be zero with finite probability. The indicator γij ∈ {0,1}of a linkj →idetermines ifBijis non zero (when γij = 1), whileBij = 0ifγij = 0. The indicatorγis modelled as a Bernoulli distribution with a prior probabilityρof being non-zero, π(γij | ρ) ∼ Ber(γij | ρ), while ρ has a Beta prior π(ρ)∼Be(ρ|0.5,0.5)(Morrissey et al., 2010). LetDdenote the time series gene expression data{Xt
i}andθthe model parameters {(µi),(λi),(γij),(Bij)}. The likelihood is then given by,
L(θ;D) = G
Y
i=1
T−1 Y
t=1
NXit+1|µi+ G
X
j=1
γijBijXjt, λ
−1
i
. (2)
1
Associate Editor: Dr. Igor Jurisica
© The Author(s) 2014. Published by Oxford University Press.
This is an Open Access article distributed under the terms of the Creative Commons Attribution License
Bioinformatics Advance Access published June 19, 2014
at University of Warwick on July 7, 2014
http://bioinformatics.oxfordjournals.org/
The associated posterior can then be sampled using the bioconductor package GRENITS (http://www.bioconductor.org/packages/2.12/ bioc/html/GRENITS.html).
In network models interference has a direct bearing on the posterior probability of links being present. Specifically in these sparse network models π(γij = 1 | D) is reduced if there is another regulatorkwith similar dynamics toj. In the case of an exact identity between the dynamics ofj, kthere are 3 identical regression models: γij = 1, γik = 0; γij = 0, γik = 1and γij = 1, γik = 1, and thus the probability of any one, and therefore ofπ(γij = 1 | D)is reduced. The relative weighting of these 3 states is determined by the prior link probabilityρwhich is low in sparse networks, thereby downweighting the double link case; therefore only the two statesγij = 0, γik = 1andγij = 1, γik = 0 need to be considered, effectively halvingπ(γij = 1 | D)relative to the case whenkis excluded from the network (proof in section 2.1.1). A key problem is gauging when regulators might interfere, specifically how interference decreases with a diminishing correlation between these regulators and thus deciding how to select which regulators to use in the regression. Failing to deal with this appropriately means that key regulators might be missed because they are part of a correlated set of regulators and their link probabilities fall below threshold through mutual interference. We developed a framework for solving this problem based on the analysis of conditional posterior link probabilities that identifies the interfering sets of regulators. This allowed us to define an interference-corrected causal network and, further, the relative weights of the interfering regulators reflecting their likely contribution to the control of a given gene.
The paper is organised as follows. In section 2, we analyse the impact of identical regulators on network links, demonstrating that the link probabilities of identical strong regulators are essentially additive. We give a numerical demonstration of the theory on an augmented experimental data set, doubling up a key regulator. In section 3 we develop a framework to correct for interference in network construction, a post-processing step that clusters regulators and calculates regulator interference within clusters for each target. In section 4, we illustrate our method on three experimental datasets that give rise to networks with distinct architectures and demonstrate that interference is data specific, there being no simple relationship between interference and regulator correlation. Further, we provide evidence that the recovered links are functional. In the discussion, we discuss the impact of these issues and the generality to other inference/fitting methods.
2 THE REGULATOR INTERFERENCE PROBLEM Causal network determination relies on causal signals leaving a signature in the gene expression dynamics, essentially a correlation betweenXt+1andXt. However, if two (or more) regulators have similar dynamics, Xjt ≈ Xkt for allt, then the identity of the regulator is unclear, the true regulator being eitherj, k or both. This correlation in the data gives rise to an approximate symmetry for the likelihood,L(θ;Xt) ≈ L(θ; Φj,kXt), whereΦj,kis the exchange transformation j ↔ k. Lifting the symmetry to the space of model parameters gives rise to an approximate exchange symmetry on the parameters θ, L(θ;Xt) ≈ L(Φ†
j,kθ;X t)
. In particular, identical dataXj = Xk means that the likelihood has
an invariance symmetry andBijandBikare unidentifiable in the linear network model (1). The lifted symmetry in this case reads Φ†j,kB·j = B·k, Φ†j,kBj· = Bk· etc. In this section we develop
a framework to analyse and detect interference between regulators, and demonstrate the impact of an exact symmetry (two identical regulators) on real data.
2.1 Two identical regulators
2.1.1 Theoretical analysis of regulator interference Consider an exact data symmetry Φj,kXt = Xt, i.e. Xj, Xk are identical. The likelihood is then invariant under the lifted symmetryΦ†j,k. The prior is also likely to satisfy this symmetry,i.e.the prior onBijis likely identical to that ofBik. Thus, the posterior link probabilities satisfy this symmetry, π(γij | D) = π(γik | D)and similarly all joint conditionals. However, the aspect of the symmetry we are interested in is whether the following two models predict different networks.
M1 Only regulatorj is considered in the set of regulators, i.e.
regulatorkis removed from the network
M2 Both regulatorsj,kare present in the network
These are in fact nested networks since M1 is M2 under the constraint γik = 0, i.e. the conditional posterior probability π(γij = 1 | D, γik = 0) is the link probability on M1 while that of M2 is the posterior probabilityπ(γij = 1 | D), (no constraints), both of which can be computed from the joint distributionπ(γij, γik |D).
We proceed to determine an expression relating π(γij = 1 | D, γik = 0)andπ(γij = 1 | D). Throughout we considerρas fixed; in practice it has low posterior variance in the full network analysis and so fixingρequal to the posterior mean in the following is a good approximation. Firstly, we have,
π(γij= 1, γik= 1|D) = ρ2 π(D)
Z
dBijdBikπ(Bij)π(Bik)
Z
dθπ˜ (˜θ)L(˜θ, Bij, Bik, γij= 1, γik= 1;D)
using Bayes formula and assuming independent priors. Hereρis the (fixed) link prior probability andθ˜=θ\ {Bij, Bik, γij, γik}.
The data symmetryΦjk betweenj, kimplies thatL(˜θ, Bij = a, Bik = b, γij = 1, γik = 1;D) = L(˜θ, Bij = a+b, γij = 1, γik= 0;D). With a Gaussian prior onBij∼N(0, σ2)(variance σ2
), we note that for an arbitrary functionf,
Z
dudve−(u
2 +v2 )
2σ2 f(u+v) ≡
Z 1
2dwdze
−(w2 +z2 ) 4σ2 f(w)
= √πσ
Z
dwe−w
2 4σ2f(w)
and thus deduce that,
π(γij= 1, γik= 1|D, σ2) = ρ
1−ρπ(γij= 1, γik= 0|D,2σ
2 )
where we make explicit note of the prior varianceσ2onBij, Bik since the dimension reduction above has doubled the prior variance. This implies that the symmetryΦjkresults in a direct relationship
2
at University of Warwick on July 7, 2014
http://bioinformatics.oxfordjournals.org/
Regulator interference
between the regulator link probability j → iwhen one (model M1) or both links (M2) are present up to changing the Gaussian prior variance of Bij between models M1 and M2; the other strength coefficientsBis, s6=jretain the original prior. Assuming a sufficiently weak prior we thus obtain an approximate equality π(γij= 1, γik= 1|D)≈ 1−ρρπ(γij= 1, γik= 0|D).
Therefore we deduce that,
(1−ρ)π(γij= 1|D)≈π(γij= 1, γik= 0|D),
which gives,
π(γij= 1|D, γik= 0)≈
(1−ρ)π(γij= 1|D)
1−π(γij= 1|D)
, (3)
or
π(γij= 1|D)≈
π(γij= 1|D, γik= 0)
1−ρ+π(γij= 1|D, γik= 0)
. (4)
Hence, including an identical regulator in a network reconstruction reduces the link probabilityj→iby a factor of1−ρ+π(γij = 1 | D, γik = 0), which can be close to 2 for a strong link (π(γij = 1| D, γik = 0) ≈1) in a sparse network (ρlow). For weaker connections the reduction factor is smaller but the relative change proportionally greater, growing as1 + [(1−ρ)/π(γij= 1|
D, γik= 0)].
2.1.2 Demonstration of regulator interference on experimental data. We use time-series data forS. coelicolorunder phosphate depletion (Nieselt et al., 2010), expression data consisting of 19 time points with 1 hr sampling, see section 1.1 of Supp. Material. In bacteria the PhoP two-component system (PhoURP, SCO4228-30 inS. coelicolor) is the primary response pathway during phosphate depletion (Rodriguez-Garcia et al., 2007); transcription of phoP
(SCO4230) dramatically increasing within 1 hr of depletion (Nieselt et al., 2010), a signalling cascade that gives rise to antibiotic synthesis within 20 hrs (Wentzel et al., 2012) through activation of thered(undecylprodigiosin, RED) andact(actinorhodin, ACT) gene clusters. For demonstration purposes we selected a set of 120 differentially expressed (DE) genes comprising 65 predefined DE regulators (removingphoU/Rwhich have a high correlation with
phoP; the interference of these 3 regulators is analysed in section 4.1) together with a selection ofphoP dependent genes andphoP
independent genes. We denote this data setD1×phoP to reflect that it has 1 copy of thephoPgene. We constructed an augmented data set by including 1 additional artificial regulator which we called SCO0000 with expression data that is an exact copy ofphoP. We called this data setD2×phoP since it has 2 regulators (SCO4230, SCO0000) with identical gene expression.
The bioconductor package GRENITS was used for inference of the gene regulatory network on D1×phoP, andD2×phoP, see Section 2 of Supp. Material. GRENITS uses a Markov chain Monte Carlo (MCMC) algorithm to implement Bayesian inference on the sparse network model (1), giving samples of the network from which link probabilities can be calculated. For the duplicated data setD2×phoP
, we calculated the conditional link probabilities for SCO4230 and SCO0000 from the MCMC samples; i.e. the probability of SCO4230 being on whilst SCO0000 is off, and
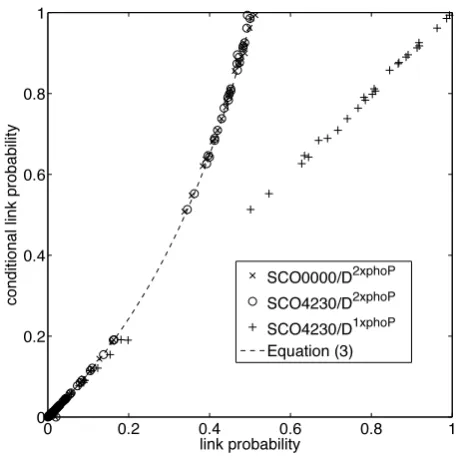
[image:4.595.313.543.104.336.2]vice versa. As is shown in Figure 1, the link probabilities for
Fig. 1. Link probability suppression in the presence of an identical regulator. For each target the conditional link probabilities of SCO4230 (◦) and SCO0000 (×) (condition on other regulator being off) are plotted against their posterior link probabilities for the network inferred on the data set
D2×phoPcomprising 121 genes, including the regulator SCO4230 and its artificial copy SCO0000. The conditional link probability is computed from the MCMC samples (18,000 samples) by conditioning on the respective duplicate being off. The theoretical relationship, Equation (3) withρ = 0.026 (posterior mean) is shown (dashed line). The conditional link probability of SCO4230 on D2×phoP is also plotted against the link probability of SCO4230 inferred onD1×phoP(+), the corresponding data set that lacks the artificial regulator SCO0000.
SCO4230 decreased dramatically when its duplicate SCO0000 was included relative to the conditional probability when the duplicate was switched off. This demonstrates the presence of regulator interference in causal networks under an exact data symmetry. Our analysis also demonstrates that the conditional probability allows the link probability to be accurately reconstructed compared to network inference on a reduced set of regulators,i.e. removal of the artificial (duplicated) gene SCO0000 in this case. Specifically, the conditionalπ(γi SCO4230|D2×phoP, γi SCO0000= 0)is identical
to π(γi SCO4230 | D1×phoP)for each target i, lying down the
diagonal of Figure 1. Therefore, up to the proviso of sufficient samples to compute the conditional, all analysis can be performed from one run of the MCMC sampler through a post processing step. Further, since the conditional probabilities of SCO4230 and SCO0000 agree (conditioned on each other), both lying on the theoretical curve (3), Figure 1, the GRENITS sampler mixes well under this data duplication,i.e. an identifiability symmetry between regulators does not affect mixing.
2.2 Multiple identical regulators
For n identical regulators Si, |Si| = n, of the target i, the regulator interference analysis of section 2.1.1 generalises to give
at University of Warwick on July 7, 2014
http://bioinformatics.oxfordjournals.org/
the approximate relationship, see section 4.1 of Supp. Material,
π(γij= 1|D, γik= 0, ∀k∈Si\ {j})
≈ (1−ρ) n−1
π(γij= 1|D)
1−1−(1−ρ)n−1
ρ π(γij= 1|D) .
For strong links in a sparse network (ρ small), we get the approximate relation,
π(γij= 1|D)≈
π(γij= 1|D, γik= 0, ∀k∈Si\ {j}) n
Thus, interference by identical regulators in sparse networks reduces link probabilities by the number of identical genes, the network topology running randomly over the single regulator networks since states with multiple links are severely down weighted byρ. The regulators thus share equally the causal signal and the true link probability of the causal dependence is (approximately) given by the sum over the link probabilities of these interfering regulators.
3 DETECTING NETWORK LINK INTERFERENCE
A continuity argument to the identical regulator case above, section 2.1.1, suggests that we should expect interference to occur between highly correlated regulators. However, the dependence of interference (link suppression) on the degree of correlation between the regulators, the expression levels of the regulators and their targets, is unknown. What is clear is that correlated genes can interfere with each other, potentially causing a significant reduction in the posterior link probabilities of dynamically similar regulators by as much as a factor ofnfornhighly correlated regulators. Therefore causal networks defined by application of a simple threshold criterion, π(γij = 1 | D) > φ, are potentially erroneous because interfering regulators may be lost since their posterior link probabilities fall below the thresholdφ. Here we establish a method to construct a network corrected for interference.
Our method is as follows. Given expression (time-series) data D
(restricted to DE genes), and a subsetRof potential regulators based on, for example functional annotation, define the interference-corrected network (ICN)N(ω, φ)with correlation and link thresholdsω,φrespectively, by:
1. Cluster the regulators R into correlated sets |Cjk| ≥ ω, using the correlation coefficient (or other similarity index) Cjk, defining clusters CRs(ω), s = 1,2..., possibly singletons. We determine levels of interference between regulators within each cluster, ignoring interference between regulators outside these sets. Singleton clusters are regulators where interference from all other regulators is ignored.
2. Infer the network posterior distribution and the conditional posterior link distributions for regulators in the clusters (here we use MCMC samples from GRENITS). Specifically, compute for eachj∈CRs(ω) the conditionalsπ(γij= 1|D, γik= 0,∀k∈CRs(ω)\ {j})for each targeti.
3. For a regulatorj∈CRs(ω)and a targeti, a linkj→iin the network
N(ω, φ)exists if either of the following two conditions holds,
α-link:π(γij= 1|D, R)≥φ.
β-link:π(γij= 1|D, R)< φand
π(γij= 1|D, R, γik= 0∀k∈CRs(ω)\ {j})≥φ.
For singletons, only the α-link condition is relevant. A further numerical restriction is also applied toβ-links; the sample size for calculating the conditional probability should be greater than or equal
to 100 in order that a 90% confidence interval can be computed; on smaller sample sizes accuracy of this estimate is poor. Small sample sizes can occur if there is a very strong link in the cluster, then conditioning on that link to be off gives a small number of samples. Acquiring a larger number of posterior samples (running the sampler for longer) relaxes this limitation.
Theα-links inN(ω, φ)are the original links inN(1, φ)(uncorrected network), i.e. the ICN comprises the original network augmented with recoveredβ-links. We define the link probability for each link in the ICN as the maximum of its posterior link probability and the links conditional probability based on the regulator’s cluster at thresholdω(if applicable).
The number ofβ-links in the ICN increases on average as the correlation thresholdωdecreases for a fixed link probability thresholdφ. However, as the correlation threshold decreases, interference amongst clustered regulators becomes weaker as regulators with decreased levels of mutual interference are clustered together. Therefore, in order to find a correlation threshold where the partitioning of regulators into mutually interfering sets is optimised we use a scoring method which quantifies levels of interference. We propose a score where aβ-link has a weight inversely proportional to the number of regulators in its clusterCRs(ω), giving theβ-link network score,
S(ω, φ) =X s
X
j∈CRs
X
i
I(j→i)
|CRs(ω)| (5)
whereI(j → i)is 1 if theβ-link is present, otherwise 0. Then strong interference among highly correlated regulators increase the score while weaker regulators (where only a proportion of the regulators in the cluster have a conditional probability above threshold to a given target) decrease the score. For instance, forming a new cluster (ωdecreasing) comprising twoβ-links adds a total of 1 to the score. But adding a third regulator to the cluster that does not regulate that target (conditional below threshold) reduces the contribution to the score to 2/3. Typicallyβ-links are stable in that those present atωare a subset ofβ-links for allω0< ω. We maximise the network scoreS(ω, φ)with respect toω, defining the optimal correlation thresholdω∗(φ)and associated optimal ICN. In cases where there is a tie we use the highest correlation that maximises theβ-link network score since further clustering gives no evidence of an increase in inteference.
The link probability threshold φ is chosen based on the confidence required for assigning links (Morrissey et al., 2010, 2011); in practice it is lower than desirable since posterior link probabilities are typically low, see Supp. Figure S4. We note that the valueφ= 1/(2−ρ)has a special significance as regards interference analysis (the prior link probability parameterρis fixed at its posterior mean), since it is the highest value of the conditional link probability for two identical regulators, see equation (4) withπ(γij = 1|D, γik = 0) = 1. Thus, whenφ <1/(2−ρ)some of theα-links are in fact interfering with each other as shown in Figure 1. Hence, to correctly assess interference the link threshold should be greater than1/(2−ρ). In section 4, we consider the effect ofφon interference, and its impact onω∗(φ)on real data sets.
Finally we note that different clustering methods are likely to give slightly different results for the ICN but identification of interfering regulators is likely similar.
4 DEMONSTRATIONS ON REAL DATA NETWORKS
In this section we analyse interference on three experimental examples. Firstly, the full expression data set forS. coelicolorunder phosphate depletion (Nieselt et al., 2010), a second experimental data set for S. coelicolor under glutamate depletion (Waldvogel et al., 2011), and expression data for theArabidopsis circadian clock (Windram et al., 2012), see Section 1 of Supp. Material. In each case we do not subselect regulators based on their (dynamic) similarity but construct the causal network with all potential
4
at University of Warwick on July 7, 2014
http://bioinformatics.oxfordjournals.org/
regulators present. We demonstrate in two of the networks that a high proportion of the recovered links are functional and quantify network accuracy.
4.1 Example 1: phosphate depletion causal network
0.75 0.85 0.95
0
200
400
600
800
1000
1200
(a) Network size
absolute correlation
n
umber of links
Link_0.4 Link_0.55 Link_0.6 Link_0.65 Link_0.7
0.75 0.85 0.95
0
20
40
60
80
100
120
(b) Score beta links
absolute correlation
[image:6.595.322.552.91.380.2]scores
Fig. 2. Analysis of theβ-link composition of theS. coelicolorphosphate depletion ICN with respect to linkφand correlationωthresholds. The total number of links (a) and theβ-link network score (b) for networksN(ω, φ) are plotted against the absolute correlation thresholdωbetween regulators for link thresholdsφ=0.4, 0.55, 0.6, 0.65, 0.7, see legend. At the correlation thresholdω= 1, the network comprisesα-links only determined from the posterior link probabilities.
The phosphate depletion data consists of 988 DE genes, of which 67 are predefined regulators comprising DNA binding proteins and proteins capable of regulating gene expression indirectly such as kinases, see section 1 of Supp. Material. The regulators show a wide spread of correlation, Supp. Figure S6(a); we expect interference to be only important amongst the highest correlating regulators and thus only examine the correlation threshold in the interval [0.7,1]. We grouped the 67 regulators into highly correlated sets by a hierarchical clustering method, Supp. Figure S6(b). The merge points in the tree are the values ofωat which the networkN(ω, φ) is determined. We used GRENITS to infer the casual network on all 988 genes, see section 2 of Supp. Material. Interference was then analysed on the merge points in 0.7 < ω < 1across the link probabilities φ = 0.4,0.55,0.6,0.65,0.7following the method in section 3. All these φ are in the tail of the posterior link probability distribution, Supp. Figure S4(a), and significantly larger than the posterior estimate for random links,ρ = 0.0266± 0.0010(distribution standard deviation). Therefore links on all these thresholds demonstrate evidence of causal regulation at varying levels of significance.
An analysis of the ICN is shown in Figure 2. Since the number of α-links remains constant and, typically, β-links are added to the network, the total number of links in the network increases on average with respect to increasing clustering stringency (decreasing
Fig. 3. Cytoscape visualisation of theS. coelicolorphosphate depletion optimal ICN, N(0.865,0.55). Nodes are regulators (pink) and (non-regulator) target genes (blue). There are 498α-links (cyan), and 259β-links (magenta). The T-arrow at the end of an link denotes inhibition and an arrow denotes activation. Link length has no meaning. The network has a large hub around SCO3217 (cdaR), targets making up the large diameter, interferring with the close proximity hub SCO5881 (redZ), to the left, and with another small hub SCO4425, positioned far left; these three regulators are clustered together atω= 0.865. The second interfering cluster is the Pho regulon hub complex around SCO4228, SCO4229, SCO4230, merged hubs on top right; again these 3 regulators are clustered atω = 0.865. There are 5 smaller hubs, SCO4261, SCO4908, SCO5877, SCO7516 and SCO7463, lower right. Zoom into figure for detail or see cytoscape file, Supp. Material.
ω) for allφ, Figure2(a). Theβ-link network score indicates that levels of interference are initially strong, but decrease as the cluster threshold falls below 0.85. Thus, the score has a maximum around 0.86-0.90 for all the link probability thresholds, Figure2(b), and therefore the optimumω∗(φ)is fairly robust to changes in the link thresholdφ. Interference is in fact fairly uniform across link strength with 30-40% of links being recovered at the optimum correlation thresholdω∗(φ)for each givenφ.
As discussed in section 3, the link threshold should be greater
than 1/(2−ρ) = 0.507for a full interference assessment. To
examine ICN structure and the potential biological importance of the inferred links we chooseφ= 0.55for illustration, much larger thanρ(the probability of random links) and close to the minimum threshold for interference detection. The β-link network score is maximised (forφ = 0.55) atω = 0.865 (the highest absolute correlation with the maximum score), Figure 2(b). The network N(0.865,0.55)has a main hub centred on SCO3217, the calcium dependent antibiotic regulatorcdaR, and a smaller Pho regulon hub
at University of Warwick on July 7, 2014
http://bioinformatics.oxfordjournals.org/
[image:6.595.67.260.182.370.2]around PhoURP, Figure 3. There are 259 recoveredβ-links out of a total of 757 links in the ICN,i.e.regulator interference caused a loss of 34% of links, 103 in thecdaRhub, interfering primarily with
redZ(SCO5881), the principal regulator of the undecylprodigiosin antibiotic gene cluster (with a correlation of 0.95), and 125 in the
phoURPhub, a result of cross interference betweenphoU,phoR,
phoP(correlation coefficients>0.93) with 69, 32 and 24β-links respectively.
Interference to a common target is in fact highly heterogeneous across regulators within a cluster. For illustration, classify targets for clustered regulators according to the type of links in the ICN, ranging from sole α targets (one regulator is an α-link, other regulators lack a link), mixedα/β targets (at least one α- and β-link), partialβ targets (at least one β-link but not all β, and no α) and complete β targets; these respective classifications have increasing levels of mutual interference. The joint targets between SCO3217 and SCO5881 in ICN N(0.95,0.55) then show a diversity of classes, with the absolute target-regulator (time shifted) correlation predicting the target classification, Supp. Figure S9. Specifically the sole α targets of SCO3217 have a higher absolute correlation with SCO3217 than with SCO5881, andvice versa, whilst completeβtargets have closer correlation coefficients. The degree of mutual interference also shows variation, Supp. Figure S10; the complete β targets are evenly weighted with similar conditional link probabilities, while the partialβ-links have greater differences in their conditional link probabilities. Results are similar for the optimal ICN, but more complex because of the 3-way interference between SCO3217, SCO5881 and SCO4425. Interference is thus heterogeneous within the target base of clustered regulators.
[image:7.595.328.521.411.602.2]To assess levels of accuracy of our recovered β-links, we examined the 24 targets predicted for PhoP (7 are in the same operon as defined by (Charaniya et al., 2007)); in the uncorrected networkphoPhad no targets, whilephoUand phoR had 19 and 69 respectively atφ = 0.55. It is highly likely that most of these targets are actually regulated by PhoP, the principle regulator of the phosphate response (Rodriguez-Garcia et al., 2007; Martin et al., 2012). We examined two criteria, firstly whether these targets had distinctly different profiles underphoP knock-out (Thomas et al., 2012), Supp. Figures S11 and S12, and whether there was evidence of a PHO box upstream of the gene, the binding site for PhoP (motif GTTCA). The first criteria showed that 5 predicted targets were significantly altered at the 0.5% level (SCO1196, SCO3899, SCO4726, SCO5390, SCO6753), and 3 others at 5%, Supp. Table S3. The second criteria indicated that 5 targets (SCO3899, SCO4545, SCO4653, SCO4726, SCO6753) and the operon (7 genes) have strong evidence of a PHO box or a dyad, (MEME score above 10, resp. 6); 5 genes were in both categories, Supp. Table S3. Close examination of the transcriptional profiles shows that many have a discernible difference in the dynamics across phosphate depletion; typically∆phoP shows slower changes in gene expression. All those with a PHO box show this behaviour. Thus, over 50% of predicted targets have supporting evidence of a PhoP binding site, Supp. Table S3. The two genes SCO1196 and SCO5390 underwent a dramatic change in expression but there was little evidence of the presence of a PHO box. They may therefore be indirect targets or possess functional but altered PHO boxes. Together this provides strong evidence that correcting for interference is essential since otherwise important targets may be
missed. In fact all of the PhoP targets were lost in absence of an interference correction in this case.
4.2 Example 2: glutamate depletion causal network
We examined the ICN for a second S. coelicolordata set under glutamate depletion (Waldvogel et al., 2011), a treatment that also gives rise to the synthesis of RED and ACT antibiotics. The data comprises 945 DE genes including 59 predefined DE regulators, see section 1 of Supp. Material. The absolute correlation between these regulators and the corresponding clustering tree, Supp. Figure S7, are similar to those in the phosphate depletion experiment, Supp. Figure S6. Under the same analysis as above, the optimal ICN occurred at a similar clustering threshold, (φ= 0.55, ω∗(0.55) = 0.859, Supp. Figures S13 and S14) and comprises 283 links of which 35 areβ-links, i.e. there is a substantially lower level of regulator interference in this data set with an estimated loss of 12% by regulator interference. Thus, despite similar correlations amongst the regulators and a similar posterior link probability distribution (Supp. Figure S4(b)) to that in the phosphate depletion experiment, regulator interference, although significant at 35 β -links, was reduced. This may be because of the different network structure; under phosphate depletion the network comprises distinct separated large hubs, while under glutamate depletion the network is more dispersed amongst a number of smaller hubs.
4.3 Example 3:Arabidopsiscircadian clock network
0.0 0.4 0.8
0
5
10
15
(a) Network size
absolute correlation
n
umber of links
Link_0.4 Link_0.55 Link_0.6 Link_0.65 Link_0.7
0.0 0.4 0.8
0.0
0.5
1.0
1.5
(b) Score beta links
absolute correlation
scores
Fig. 4. Analysis of the ICNβ-link composition with respect to linkφand correlationωthresholds for theArabidopsiscircadian clock data. The total number of links (a) and the score ofβ-links (b) for networksN(ω, φ)are plotted against the absolute correlation thresholdωbetween regulators for link thresholdsφ=0.4, 0.55, 0.6, 0.65, 0.7, see legend.
The Arabidopsis circadian clock is one of the most well established biological networks containing both transcriptional and translational regulation. We used transcriptome data comprising 10 regulators (Windram et al., 2012), every 2 hours up to 48 hours, 24 time points in total. There are 4 biological replicates at each time
6
at University of Warwick on July 7, 2014
http://bioinformatics.oxfordjournals.org/
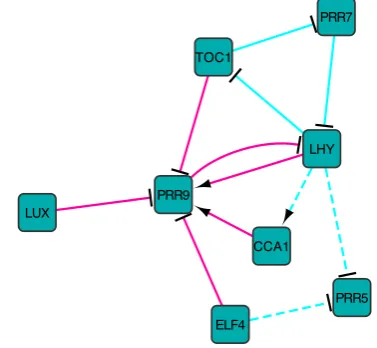
Fig. 5. InferredArabidopsiscircadian clock ICN showingα-links (cyan) andβ-links (magenta). Solid lines indicate predictions consistent with the latest experimental data and model (Pokhilko et al., 2013), while the dashed lines indicate predictions that are not thus far supported by current literature. Arrows indicate activation and the T-arrows inhibition.
point allowing the replicate causal linear model with Student noise in GRENITS to be used for network inference (Morrissey et al., 2010). The absolute correlation between these regulators and the corresponding clustering tree are shown in Supp. Figure S8. The ICNN(ω, φ) was constructed following the method in section 3, Figure 4, and displayed similar trends to the two previous larger networks, Figure 2 and Supp. Figure S13. We constructed the optimal ICN forφ= 0.55, Figure 5; the lowest link threshold for a full interference assessment is1/(2−ρ) = 0.543in this case, Supp. Figure S5.
In order to validate our method, we compared our reconstructed network to the Arabidopsis circadian clock model in (Pokhilko et al., 2013), defining the ground truth network, Supp. Table S4. We inferred 12 links which consist of 6 α-links and 6 β-links, Figure 5. In particular, all the β-links are correct, while only 3 of theα-links are correct. The precision of our ICN prediction is thus 75%, subject to the degree to which the network is actually known. Furthermore, an analysis of the ICNs across link threshold φ shows that the optimal ICN always has maximal precision for link thresholds φ = 0.55and above, Supp. Figure S15. Finally, a comparison between NIACS and Murphy’s Bayes Net Toolbox (Murphy and Mian, 1999) shows that our method has much higher precision, Supp. Table S5.
5 DISCUSSION
In this paper we have proposed a method for dealing with the problem of regulators with similar dynamics suppressing causal link signals in the auto-regression model Equation (1). By analysis of the level of interference between highly correlated regulators (computed from the posterior conditional link probabilities) we are able to correct for link suppression by near identical regulators, and thus recover regulator links that would otherwise be lost because their posterior link probabilities are reduced below threshold. We defined
an interference-corrected network (ICN)N(ω∗, φ)that includes as a subnetwork the original networkN(1, φ), i.e. our method only adds links lost by interference. The ICN is defined at the value of the correlation threholdω∗where interfering regulators are judged to be optimally clustered as measured by a score that sums over weighted β-links; our score punished clustering of inconsistent regulators through a lack of mutual interference or no interference.
Our approach avoids a subjective sub-selection of the set of predefined regulators, i.e. all regulators should be included in the inference in absence of prior information, and, by a post-processing step, interference is corrected. In effect we are assuming that there are potentially multiple regulators for a target but network inference is hampered by insufficient dynamic data to separate signals from (individual) regulators with similar dynamics. Determining whether there are two true regulators as opposed to one is not possible without additional experimental data, e.g.
experiments under conditions where the regulators have distinct dynamics or conducting experiments with strains where either regulator is expressed under an inducible promotor. Our method crucially prevents loss of both regulators from the inferred network. We demonstrated that the recovered β-links for PhoP and the
Arabidopsiscircadian clock are functional, with precision at least as good as that for the predictedα-links. In a comparison against other network inference methods on simulated data (DREAM4), GRENITS is already highly competitive, whilst performance is further improved when coupled with NIACS to correct for regulator interference, the area under precision recall curve increasing on average by 10%, Supp. Table S2. Most of the improvement is in the crucial high confidence predictions, Supp. Figure S3. NIACS outperformed the other methods in 10 of 14 cases.
For the ICN N(ω∗, φ), we assign the link probability as the maximum of the posterior link probability and the conditional probability (if applicable). However, we do not expect the conditional probabilityπ(γij= 1|D, γik= 0, ∀k∈CRs(ω∗)\ {j})to truly reflect the probability of regulatorjregulatingi, since this is dependent on the clustering set CRs(ω∗). In essence, if there are multiple regulators they all affect the dynamics (if on), and a true measure of their regulatory effects is in the presence of the other regulators. Therefore, we recommend thatβ-links arising from interference remain distinguished since their probabilities are corrected and thus a direct comparison with α-links may be misleading. However, the relative weighting within a cluster of regulators according to their conditional posterior probabilities is a reflection of the evidence in the data as to the identity of the true regulator. The identity of this true regulator may also be discerned by using additional experiments or gene annotations. This data can also be used as prior information in GRENITS restricting allowable links thereby removing some of the regulator abiguity.
Our analysis on three real data sets demonstrated that interference is not simply a function of regulator correlation. In the phosphate depletion causal network (Example 1), for two highly correlated regulators we found a spread of interference amongst their targets comprising a set of targets on which interference is mutual, while other targets have only a sole regulator despite their high correlation; interference is thus heterogeneous on the set of targets. These observations mean that interference must be analysed on a per experiment, per target basis and the optimal correlation threshold determined in each case.
at University of Warwick on July 7, 2014
http://bioinformatics.oxfordjournals.org/
In addition to regulator interference we also observed another phenomena in our networks whereby two (or more) regulators enhance the causal signals of each other; specifically the regulators have elevated posterior link probabilities in the presence of each other. We define pairwisesynergisticregulators j, k on targeti as regulators withπ(γij = 1|D), π(γik = 1|D) > φ, π(γij = 1|D, γik = 0), π(γik = 1|D, γij= 0)< φ(this definition can be easily generalised to the case of multiple regulators). Causal signal synergy between regulators was rare, with 3, 3 and 1 synergistic regulators in examples 1,2,3 respectively, Supp. Table S6. We emphasise that neither interference or synergy between the causal signals implies that a mechanistic interference/synergy exists. Link suppression/enhancement from interference/synergy in our context arises because of similarity (correlation) in the regulator dynamics.
Interference between dynamically similar regulators in causal network inference is a general problem. It will occur in any statistical hypothesis testing methodology for the model in Equation 1. For instance, since the weightsBijin Equation 1 are suppressed under interference, and their variance increases under a lack of (a posteriori) identifiability, any test for a non zero coefficient will be subject to loss of highly correlated regulator links, see section 4.2 of Supp. Material. In this paper, we have provided a methodology to recover missing (suppressed) links within a Bayesian context through a post-processing of the network posterior samples.
ACKNOWLEDGEMENT
We thank Dr. Jonathan Moore for composing the perl code in NIACS together with the first author. We are grateful to the anonymous referees for their helpful comments.
Funding: This work was supported by BBSRC (New Investigator), grant number BB/H109502/1 to MLG. CAP was funded by EPSRC, grant EP/I036575/1.
REFERENCES
Bansal,M. et al. (2007) How to infer gene networks from expression profiles.Mol. Syst. Biol., 3, 78.
Charaniya,S. et al. (2007) Transcriptome dynamics-based operon prediction and verification inStreptomyces coelicolor.Nucleic Acids Res., 35, 7222-7236. De Smet,R. and Marchal,K. (2010) Advantages and limitations of current network
inference methods.Nat. Rev. Micro., 8, 717-729.
Emmert-Streib,F. et al. (2012) Statistical inference and reverse engineering of gene regulatory networks from observational expression data.Front Genet., 3, 8. Hache,H. et al. (2009) Reverse engineering of gene regulatory networks: a comparative
study.EURASIP J. Bioinform. Syst. Biol., 2009, 617281.
Lebre,S. (2009) Inferring dynamic genetic networks with low order independencies.
Stat. Appl. Genet. Mol. Biol., 8, 9.
Maetschke,S.R. et al. (2013) Supervised, semi-supervised and unsupervised inference of gene regulatory networks.Brief. Bioinform., doi: 10.1093/bib/bbt034. Margolin,A.A. and Califano,A. (2007) Theory and limitations of genetic network
inference from microarray data.Ann. N. Y. Acad. Sci., 1115, 51-72.
Markowetz,F. and Spang,R. (2007) Inferring cellular networks–a review. BMC Bioinformatics, 8, S5.
Martin,J.F. et al. (2012) Transcriptomic studies of phosphate control of primary and secondary metabolism inStreptomyces coelicolor.Appl. Microbiol. Biotechnol., 95, 61-75.
Morrissey,E.R. et al. (2010) On reverse engineering of gene interaction networks using time course data with repeated measurements.Bioinformatics, 26, 2305-2312. Morrissey,E.R. et al. (2011) Inferring the time-invariant topology of a nonlinear sparse
gene regulatory network using fully Bayesian spline autoregression.Biostatistics, 12, 682-694.
Murphy,K. and Mian,S. (1999) Modeling gene expression data using dynamic Bayesian networks.Technical Report, Computer Science Division, University of California, Berkeley, CA.
Nieselt,K. et al. (2010) The dynamic architecture of the metabolic switch in
Streptomyces coelicolor.BMC Genomics, 11, 10.
Olsen,C. et al. (2009) On the impact of entropy estimation on transcriptional regulatory network inference based on mutual information.EURASIP J. Bioinform. Syst. Biol., 2009, 308959.
Opgen-Rhein,R. and Strimmer,K. (2007) Learning causal networks from systems biology time course data: an effective model selection procedure for the vector autoregressive process.BMC Bioinformatics, 8, S3.
Penfold,C.A. and Wild,D.L. (2011) How to infer gene networks from expression profiles, revisited.Interface Focus, 1, 857-870.
Pokhilko,A. et al. (2013) Modelling the widespread effects of TOC1 signalling on the plant circadian clock and its outputs.BMC Syst. Biol., 7, 23.
Rodriguez-Garcia,A. et al. (2007) Genome-wide transcriptomic and proteomic analysis of the primary response to phosphate limitation inStreptomyces coelicolorM145 and in a DeltaphoP mutant.Proteomics, 7, 2410-2429.
Thomas,L. et al. (2012) Metabolic switches and adaptations deduced from the proteomes ofStreptomyces coelicolorwild type and phoP mutant grown in batch culture.Mol. Cell Proteomics, 11, M111.013797.
Waldvogel,E. et al. (2011) The PII protein GlnK is a pleiotropic regulator
for morphological differentiation and secondary metabolism in Streptomyces coelicolor.Appl. Microbiol. Biotechnol., 92, 1219-1236.
Wentzel,A. et al. (2012) Optimized submerged batch fermentation strategy for systems scale studies of metabolic switching inStreptomyces coelicolorA3(2).BMC Syst. Biol., 6, 59.
Werhli,A.V. et al. (2006) Comparative evaluation of reverse engineering gene regulatory networks with relevance networks, graphical gaussian models and bayesian networks.Bioinformatics, 22, 2523-2531.
Windram,O. et al. (2012)Arabidopsisdefence againstBotrytis cinerea: chronology and regulation deciphered by high-resolution temporal transcriptomic analysis.Plant Cell, 24, 3530-3557.
8
at University of Warwick on July 7, 2014
http://bioinformatics.oxfordjournals.org/