Bachelor Thesis:
Usability of information-retrieval chatbots and the
effects of avatars on trust
Nina Böcker
June 2019
University of Twente.
Faculty of Behavioural, Management and Social Sciences
Abstract
The aim of this study was to examine the effects of avatars on the trustworthiness of chatbots and to develop a questionnaire that measures different factors which are important in determining the usability of chatbots. Until today, there are only a few studies that examine the interaction process between end-users and chatbots, and which aspects are influential regarding their usability. Existing measurement tools were not specifically developed for assessing the usability of chatbots and are often only able to determine a general satisfaction score. Hence, there is no discrimination between potential different aspects possible.
Furthermore, it was found that trust plays an important role in assessing the usability of conversational agents. Research regarding avatars and an associated uncanny valley effect that might influence the trustworthiness of chatbots revealed rather mixed results. This study conducts focus groups to determine the most relevant aspects of the usability of chatbots and continues with a usability test in which a preliminary usability satisfaction questionnaire is tested and the effects of avatars on trust are determined. The data are analysed with different multivariate and univariate ANOVA, correlation analyses, and a principal component analysis. It was found that the type of chatbot had a small but significant effect on the perceived trustworthiness and overall usability. Also, with the principal component analysis, different factors could be extracted which influence the general usability of chatbots. These findings suggest that different intercorrelated factors are important in determining usability. It is recommended that the currently tested usability satisfaction questionnaire should be further validated and refined. Moreover, developers should shift their focus in the design of chatbots to more influential aspects than avatars to increase usability and trustworthiness, such as the flexibility of linguistic input and the perceived credibility.
Table of contents
Introduction ... 4
Previous attempts to increase the usability of chatbots ... 6
Goals of this research ... 7
Expert analysis ... 8
Focus groups ... 11
Methods ... 11
Participants. ... 11
Procedure and material. ... 11
Data Analysis. ... 12
Results ... 13
Usability testing ... 14
Methods ... 15
Participants. ... 15
Procedure and material. ... 15
Data Analysis. ... 16
Results ... 17
Outliers and descriptive statistics. ... 17
Trust and the relationship among the USQ and UMUX-Lite. ... 18
Principal component analysis of the USQ. ... 20
Discussion ... 26
The effects of the type of chatbot on trust and usability ... 26
The UMUX-Lite, the USQ and its components ... 27
Strengths and limitations ... 29
Recommendations... 30
References ... 31
Appendix A ... 35
Preliminary Usability Satisfaction Questionnaire (USQ) ... 35
Appendix B ... 38
Focus groups script ... 38
List of key features and their descriptions... 39
List of items ... 40
Informed consent ... 44
Appendix C ... 47
Qualtrics questionnaire flow ... 47
Appendix D ... 59
Introduction
Conversational agents are a part of human-computer interaction and were firstly designed in the 1960s (Ciechanowski, Przegalinska, Magnuski, & Gloor, 2019). The initial aim of using conversational agents was to determine whether users could be deceived into believing that they were interacting with real human beings instead of a computer
(Ciechanowski et al., 2019), which could be assessed with the Turing Test (Saygin, Cicekli, & Akman, 2000). One of the earliest and probably the most famous one attempting this test was ELIZA, a computer program simulating responses of a therapist developed by Weizenbaum (Ireland, 2019). Especially since 2016, the use of conversational agents substantially
increased (McTear, 2017). A conversational agent is a form of consumer-oriented artificial intelligence. They simulate human behaviour based on formal models. Furthermore, a
conversational agent is a software program that uses natural language for the interaction with its users. This ‘natural’ language that is programmed into them marks the main difference between a conversational agent and a human, where the latter possesses natural language as an innate capability. But it is this ‘natural’ aspect of the language that conversational agents are using which makes them so fascinating. When interacting with technology, the ability to use natural language lets technology itself appear handier and less complicated (Gnewuch, Moran, & Maedche, 2018).
The interaction between users and conversational agents takes place via a
conversational interface where input and output can be given in the form of speech, text, touch, and various other forms (McTear, 2017). This type of input differentiates for example between chatbots, which are text-based conversational agents, and so-called virtual or digital assistants, which operate based on speech (Gnewuch et al., 2018). Chatbots can be service-oriented systems that are used to help online customers to find information (Jenkins, Churchill, Cox, & Smith, 2007). Such service-oriented chatbots support users’ information-retrieval and serve as an automated customer service agent that may answer to users’ queries using natural language in textual or vocal form. Furthermore, Huang (2017) suggests that computers and other technologies in future will leave the mere function of a tool behind and rather serve as an assistant and dialog partner. According to the latter author, this change of function is evident in the increasing use of embodied conversational agents, or chatbots.
More and more companies employ chatbots to interact with their online customers (Araujo, 2018). The growing use of conversational agents is especially evident when looking at the adoption of service-oriented chatbots that support information-retrieval. Since
Sorofman, 2016), the service interface evolves to be technology-dominant rather than driven by humans (Larivière et al., 2017). In this context, chatbots are largely service-oriented and intended to help customers in finding information at often large and complex websites (Jenkins et al., 2007). The chatbot gives natural language answers to the customer and therewith acts as a computerized customer service agent.
Until now, the main focus in research lies on the creation and design of chatbots. Designers and developers try to make chatbots as human-like and intelligent as they can. But during this process, there is the risk of forgetting that eventually, humans are the ones
interacting with chatbots (Shackel, 2009). In the end, the end-user needs to be satisfied with the interaction process and chatbots need to serve their needs. Although the communication between humans often involves typing, especially in the case of frequent online users, there are issues regarding the humans’ expectations of chatbots and the way they perceive them (Jenkins et al., 2007). For many users the concept of having a conversation with a computer is troublesome. According to Araujo (2018), consumers are frequently sceptical towards
technology and prefer to interact with humans. There appears to be a general resistance against technology in the form of chatbots. Moreover, chatbots are a rather new form of technology which enhances the perceived risk of consumers to interact with them (Trivedi, 2019).
Despite consumers’ perceived risks and scepticism towards chatbots, Ciechanowski et al. (2019) found that participants of their study eventually enjoyed the interaction with
These findings show that users have rather clear and high expectations of the abilities and functions a chatbot should possess and stress the importance to further assess users’ preferences so that the focus in the development of chatbots can again shift to the end-user’s needs. The present study deals with the clarification of users’ requirements regarding the interaction with chatbots, and the extraction of factors leading to user satisfaction to eventually develop a measurement tool assessing the usability of chatbots.
Previous attempts to increase the usability of chatbots
At present, there is a lack in research about the usability and possible design guidelines regarding conversational agents, especially in the context of customer service, which includes information-retrieval chatbots (Gnewuch et al., 2018). Until now, there are only few studies that directly examine the interaction between chatbots and humans (Barakova, 2007; Jenkins et al., 2007; “The media equation”, 1997), or that only focus on very narrow aspects of the usage (e.g. Chakrabarti & Luger, 2015; Peters et al., 2016). The authors Gnewuch et al. (2018) state that problems in the design need to be solved before chatbots can effectively contribute to the online customer service. Currently, some researchers suggest that the interaction with chatbots is often neither convincing nor engaging for users (Jenkins et al., 2007; Mimoun, Poncin, & Garnier, 2012). Still, it needs to be said that there exist several attempts to make the interaction with chatbots more engaging and to reduce people’s concerns and scepticism.
In increasing the engagement and reducing the doubts that end-users might have when interacting with chatbots, trust plays an important role (Corritore, Kracher, & Wiedenbeck, 2003). The authors state that trust is a crucial factor in the success of online environments such as information-retrieval chatbots. Furthermore, Corritore et al. (2003) stress the importance of investigating end-users’ trust in different technologies, and especially in the field of chatbots, such studies are rare. According to Seeger, Pfeiffer, and Heinzl (2017), end-users have certain social expectations, norms, and beliefs towards technological systems that are more demanding in terms of efficiency and rationality than towards other humans. One attempt to increase users’ engagement with chatbots, to make the interaction process more natural and comfortable, and to increase end-users’ trust in the technology is to add an avatar to the user interface of the chatbot (Angga, Fachri, Elevanita, Suryadi, & Agushinta, 2015).
An avatar can come in varying forms such as human-, animal, or object-like
Researchers found that the use of avatars smoothens the process of interaction (Tanaka, Nakanishi, & Hiroshi, 2015). However, there are also studies with rather mixed results about the benefits of chatbots having an avatar (Jenkins et al., 2007). Here, it was found that some participants find the interaction with chatbots that involved an avatar more engaging while others said there is no need for an avatar.
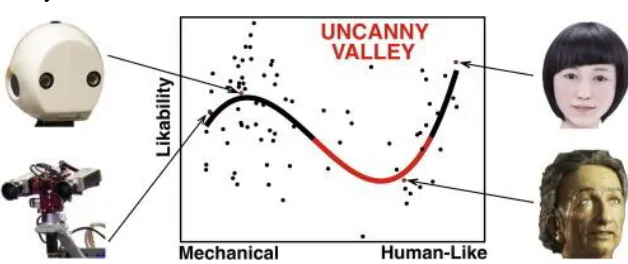
Furthermore, there are recent findings that an uncanny valley effect in the interaction with certain technologies can appear (e.g. Ciechanowski et al., 2019; Mathur & Reichling, 2016). The uncanny valley hypothesis states that consumers have a feeling of eeriness and discomfort towards technology that appears in forms of human-machine interaction (Mori, 1970). Mathur and Reichling (2016) state that the uncanny valley characteristics are apparent in the interaction with robots. The more human a robot appeared, the less it was liked by participants, but as the faces of robots became nearly human, the likability increased again (see Figure 1). By means of a social game in which participants were asked with how much money they would trust each robot, the researchers found that the uncanny valley has a profound effect on the trustworthiness, with a higher uncanny valley resulting in lower trustworthiness. Additionally, Ciechanowski et al. (2019) found that participants showed more negative emotions when using avatar-chatbots than pure text-chatbots. Participants found text-chatbots less weird and inhuman, and the interaction with avatar-chatbots
[image:7.595.72.386.477.609.2]displayed higher physiological arousal of participants, which is an indication of the uncanny valley effect.
Figure 1. Illustration of the uncanny valley effect (Mathur & Reichling, 2016).
Goals of this research
To conclude, there is a rise in the use of chatbots in today’s online world that is
Attempts to increase the engagement of the interaction process such as including an avatar yielded mixed results. This highlights the urgent need for further research in this area.
Research question 1. Do chatbots with an avatar have an effect on end-users’ trust in
chatbots and its usability in comparison to chatbots without an avatar?
Moreover, there is a need to clarify what features are important in human-chatbot interactions. Therefore, the overall goal of this research is to attempt the initial development of a valid and reliable measurement tool to assess the usability of chatbots. The development of such a tool is primarily based on the study of Tariverdiyeva and Borsci (2019), who identified a list of key features that are important in assessing the usability of chatbots. As part of their research, chatbots were assessed with the UMUX-Lite (Lewis, Utesch, & Maher, 2013) and it was concluded that there is the need for a more sufficient usability measurement which takes into account more detailed aspects of the usability and interaction process. Nevertheless, the UMUX-Lite (Lewis et al., 2013) gave an overall indication of the general usability of chatbots.
Research question 2. Do the results of a newly developed questionnaire correlate with
the results of the UMUX-Lite?
Research question 3. Is there an underlying factor structure of the item scores of a
newly developed questionnaire?
Expert analysis
The expert analysis aimed to discuss and refine the existing list of features and to generate
items according to the features.
The current research team consists of three researchers who function as experts due to their familiarity and resulting expertise regarding the usability of chatbots. Based on the findings of Tariverdiyeva and Borsci (2019), an initial list consisting of 18 key features was used (see Table 1). These features were deduced from a systematic literature review and modified Delphi technique, an online survey of both users and experts, and an interaction test using the UMUX-Lite (Lewis et al., 2013). Prior to the first expert meeting, an independent literature review was conducted to get familiar with the features and to add potential
Table 1
Feature Description
1. Response time Ability of the chatbots to respond timely to users’ requests 2. Maxim of quantity Ability of the chatbots to respond in an informative way without
adding too much information
3. Maxim of quality Ability of the chatbot to avoid false statements/information 4. Maxim of manners Ability of the chatbot to make its purpose clear and communicate
without ambiguity
5. Maxim of relation Ability of the chatbot to provide the relevant and appropriate contribution to people needs at each stage
6. Appropriate degrees of formality
Ability of the chatbot to use appropriate language style for the context
7. Reference to what is on the screen
Ability of the chatbot to use the environment it is embedded in to guide the user towards its goal
8. Integration with the website
Position on the website and visibility of the chatbot (all
pages/specific pages, floating window/pull-out tab/embedded etc.) 9. Process facilitation and
follow up
Ability of the chatbot to inform and update users about the status of their task in progress
10. Graceful responses in unexpected situations
ability of the chatbots to gracefully handle unexpected input, communication mismatch and broken line of conversation 11. Recognition and
facilitation of users’ goal and intent
Ability of the chatbot to recognize user's intent and guide the user to its goal
12. Perceived ease of use The degree to which a person believes that interacting with a chatbot would be free of effort
13. Engage in on-the-fly problem solving
Ability of the chatbot to solve problems instantly on the spot
14. Themed discussion Ability of the chatbot to maintain a conversational theme once introduced and to keep track of the context to understand the user’s utterances
15. Users’ privacy and ethical decision making
Ability of the chatbot to protect user’s privacy and make ethically
appropriate decisions on behalf of the user 16. Meets neurodiversity
needs
Ability of the chatbot to meet needs of users independently from their health conditions, well-being, age, etc.
18. Flexibility of linguistic input
Ability of the chatbot to understand users’ input regardless of the
phrasing
During several expert meetings of the research team, the initial key features of Tariverdiyeva and Borsci (2019) were extensively discussed. We decided to exclude the feature Ethical decision-making due to the small likelihood of ethically questionable topics in interactions with information-retrieval chatbots. Also, the feature The meeting of neuro-diverse needs was excluded since a single user can only evaluate if his or her own needs were
met, not the needs of others. However, this is an important feature for designers and should be kept in mind.
Additionally, we decided to edit and change some other features. The feature trust was split into the features Perceived credibility and Privacy and security after discussing that the initial feature was not specific enough. The feature Maxim of quality was replaced by
Perceived credibility as it was concluded that the user would not be able to determine whether
the information given is accurate or not, rather the perception of accuracy is key to this feature. Furthermore, to ensure better comprehensibility and to avoid misunderstandings, several existing features were renamed, and their descriptions edited. Maxim of manners was renamed into Understandability and Reference to what is on the screen was renamed into Reference to service, which also includes the provision of hyperlinks and automatic
transitions. From this last feature, also the feature Integration with the website was subsumed. From this, it already becomes apparent that different features might be intercorrelated, some more than others. As all the features are related to the overall usability of conversational agents based on the corresponding literature, it is likely that some of them are highly
correlated, e.g. the features Perceived credibility and Privacy and security, which were both deduced from the general feature Trust. However, due to the separate works of research from which the different features were distinctly extracted, it is not possible yet to determine a definite underlying model of potential intercorrelations.
Furthermore, after agreeing upon a list of features, each expert generated at least one item per feature. Each item was reviewed and edited along with the guidelines suggested by Boateng, Neilands, Frongillo, Melgar-Quiñonez, and Young (2018) and Carpenter (2017). Thus, the expert meetings resulted in a final list of 21 key features with short and
Focus groups
The focus groups were conducted to determine the relevance and clearness of the different
features and their descriptions.
Methods
Participants.
In total, 16 students (8 male, 8 female) were recruited at the University of Twente via the BMS (Behavioural, Management, and Social Sciences) Test Subject Pool system SONA and convenience sampling. The nationalities of the participants were German (N=6), Indian (N=5), Bulgarian (N=3), and Dutch (N=2). The participants’ age ranged from 19 to 30 (M=22.06, SD=1.84). Eligibility was restricted to students above the age of 18 years. The students received an incentive in the form of 2 credits in the BMS Test Subject Pool system SONA in exchange for their participation. The BMS Ethics Committee of the University of Twente ethically approved the study and all participants gave informed consent. Four of the participants were part of a pilot test. Due to the smooth procedure and valuable output of the pilot test, its data were included in the data analysis.
Procedure and material.
An exploratory design with focus groups was applied to gain a deeper understanding of the perceived relevance of features and their comprehensibility as well as the clearness of the related items from the perspective of potential end-users of chatbots. The focus groups took place in enclosed project rooms at the University of Twente library. Four participants and two researchers attended each focus group. The participants were seated around a table, with one researcher, the moderator, sitting at the head. The other researcher served as an observer and was seated in some distance to the table with a good view of the group. The focus groups were all led similarly based on a script. Firstly, participants were welcomed, and the informed consent forms were handed out and read and signed by participants. In case of disagreement of at least one person regarding the video-recording, the session was only audio-taped, if the participant also disagreed to this procedure, we restricted the recording to taking notes.
Afterwards, we gave the participants discussion guidelines. A short introduction to chatbots followed. The chatbot Finnair in the Facebook Messenger was used in interaction with the participants to give an example. Participants were asked to reflect on their experience with the chatbot. The first main task followed, which focused on participants’ opinions
Then, the same procedure was repeated for the list of items, which focussed on the participants’ opinion about the items and their clearness. Lastly, the participants were informed that they could get the results of the study if desired. We handed out a contact address for any further questions and the participants were thanked for their contribution to this research.
The materials used for the focus groups were a GoPro Hero 5 to video- and audio-tape the sessions. We also used a screen to display a PowerPoint presentation with the leading question of each part of the discussion and to show an example of using a chatbot.
Furthermore, different lists and questionnaires were used during the focus groups (Appendix B). A questionnaire for assessing the participants’ demographics and the informed consent forms were used. There was one list per participant showing the key features of the
preliminary USQ, their description and space to write down comments, and one list per participant showing all the items of the preliminary USQ and additional space for comments. To ensure a similar procedure for each session, a script with all the necessary information was used every time.
Data Analysis.
Both a quantitative and qualitative data analysis were performed. The qualitative analysis involved watching the videotapes and retrieving specific features that were
mentioned during the discussion, whether participants considered them relevant or irrelevant and the arguments behind their opinions. Also, the comments on the two lists were read and assessed regarding the features’ relevance and the items’ phrasing.
quantitative data. Features that reached consensus lower or equal to 75% were then discussed by the researchers. For this expert review, the qualitative data of the participants were taken into account, as well as the expertise of the researchers.
Results
After comparing and discussing both the quantitative and qualitative data of the focus groups, we decided to remove seven key features from the initial list. In the following, the removed features will be discussed ranging from the lowest to the highest consensus reached among participants. The features Personality and Enjoyment scored very low in the scoring system and obtained a consensus of only 50% (see Table 2). Also, the qualitative data
analysis did not reveal arguments in favour of the relevance of these features (e.g. participant 1.3: “I don’t mind its personality if it gives me the information I need”; participant 2.2: “I’d rather it not be humanlike, so I know what to do with it”). Therefore, these features were
removed. The feature Graceful responses in unexpected situations was kept although having low consensus since the qualitative data showed that participants still regarded it as important after discussing what its exact meaning was (e.g. participant 4.1: “It’d be nice if it can handle all kinds of input, nearly like a human”). Despite a low consensus of the feature Ease of
starting a conversation and low scores in the second scoring system, we did not exclude it
due to the young age of the sample. All of the participants were students familiar to technology and especially messaging applications, therefore the feature felt rather
unnecessary for them. But for older users who are less familiar with this kind of technology, the ease of starting a conversation could be a very relevant feature in assessing their
satisfaction with information-retrieval chatbots.
The features Engage in on-the-fly problem solving, Process tracking, and Appropriate language style reached 75% consensus or less and thus were removed, also because no further
arguments in favour of these features could be found in the qualitative data. The feature Trust had a consensus of 81.25% but scored on the lower end in the second scoring system and the qualitative data revealed that most participants regarded it as redundant with the feature Privacy and security (e.g. participant 3.1: “My trust on it would be based on the privacy and security”). The latter feature had a higher consensus of 87.5% and accordingly the feature
Trust was excluded. The feature Ease of use had high consensus about its relevance among
the same content. Anyhow, the results of the focus group do not give clear indications about the correlations between features. To summarise, the analysis led to a revised list of 14 key features in total which are considered as important in assessing the usability of chatbots.
Table 2
Featurea Consensus in %b Scoring system in
pointsc
F5 Perceived credibility 100 17
F6 Understandability 100 16.5
F10 Maxim of quantity 100 16.5
F11 Ease of use 100 14.5
F15 Expectation setting 100 17
F1 Response time 93.75 14.5
F12 Flexibility of linguistic input 93.75 15
F16 Reference to service 93.75 9.5
F4 Perceived privacy and security 87.5 13
F9 Ability to maintain themed discussion 87.5 14.5
F13 Visibility 87.5 12.5
F18 Recognition and facilitation of user’s goals
and intent
87.5 12.5
F3 Trust 81.25 9
F7 Maxim of relation 81.25 12.5
F8 Appropriate language style 75 10
F17 Process tracking 75 9
F2 Engage in on-the-fly problem solving 68.75 8
F14 Ease of starting a conversation 68.75 6.5
F19 Graceful responses in unexpected situations 68.75 7.5
F20 Personality 50 .5
F21 Enjoyment 50 0
a Features not in bold were removed
b Consensus on the relevance of a feature indicated as an unambiguous positive answer c Scoring system taking into account ambiguous answers with the highest score being 17
Usability testing
The usability test was conducted to explore the newly developed questionnaire and possible
underlying factor structures, potential correlations with the UMUX-Lite, and the effects of
Methods
Participants.
The BMS Test Subject Pool system SONA and convenience sampling were used to recruit 46 students (29 male, 17 female) in total. The participants’ nationalities were German (23), Indian (14), Korean (2), Dutch (2), Bulgarian (1), Pakistani (1), Brazilian (1), Turkish (1) and Finnish (1). The eligibility was restricted to students above the age of 18 years. The age of the participants ranged from 18 to 55 (M=23.65, SD=5.38). The students received an incentive in the form of 1.5 credits in the BMS Test Subject Pool system SONA in exchange for their participation. The study was ethically approved by the BMS Ethics Committee of the University of Twente and all participants gave informed consent.
Procedure and material.
In total, 10 chatbots were tested, consisting of 4 chatbots already assessed by Tariverdiyeva and Borsci (2019) and 6 new chatbots of which no prior usability indication exists. Of the already tested chatbots, two scored on the higher and two on the lower end in terms of usability. Each participant was presented with five chatbots. The allocation of
chatbots per participant was randomized with the only restriction that it was ensured that each participant interacted with two already tested chatbots and three new ones. For each chatbot, there was one task prepared which the participant should perform by interacting with the chatbot.
participant. After completion of all steps, the recording was stopped. Finally, participants were thanked for their participation and it was ensured that they had the necessary
information in case of further questions or remarks about the research.
For administering the usability test, an ASUS notebook with a 13.3” screen and Windows 8 operating system was used. Attached to it were an external English QWERTY keyboard and a mouse which were used instead of the inbuilt hardware of the notebook. The software Qualtrics (Qualtrics, Provo, UT, USA) was run to administer the USQ consisting of the 42 items generated by the researchers, the UMUX-Lite (Lewis et al., 2013), the task difficulty item (Sauro & Dumas 2009), and a pre- and post-trust item. Additionally, informed consent forms were used.
Data Analysis.
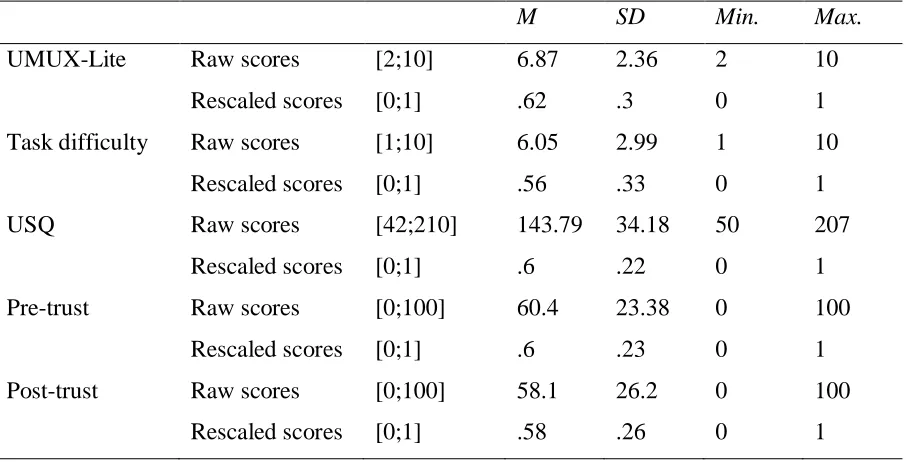
The data were analysed using R (R Core Team, 2013; Appendix D). First, it was checked for outliers using graphs. Then, descriptive statistics were calculated for each scale. The UMUX-Lite (Lewis et al., 2013) has two items with a combined total score ranging from 2 to 10. The task difficulty item has a raw score ranging from 1 to 10. Both pre- and post-trust items have raw scores ranging from 0 to 100. The newly developed USQ consists of 42 items with a 5-point Likert scale, resulting in a minimum score of 42 and a total maximum score of 210. For further analysis, the variables were rescaled to intervals ranging from 0 to 1 to harmonize the scales.
Additionally, the tested chatbots were classified into chatbots with only a brandlogo (Booking, Flowers, HSBC, Tommy Hilfiger), chatbots with a human-like profile picture (Amtrak, USCIS, Absolut), and chatbots with a human-like avatar (Inbenta, Toshiba). A MANOVA with the type of chatbot as independent and pre- and post-trust as dependent variables was performed to check for possible correlations between the two dependent
variables and the type of chatbot. The respective model assumptions were checked and 97.5% confidence intervals were determined via bootstrapping with 9999 replicates of the effect size η2. Also, follow-up analyses to examine the contrasts were performed. Next, a univariate
ANOVA with the type of chatbot as independent and the total UMUX-Lite score as
dependent variable was performed to determine possible effects of the type of chatbot on the overall usability.
Furthermore, the correlation between the total scores of the newly developed USQ and the UMUX-Lite (Lewis et al., 2013) scores was computed. The corresponding model
reliability. The task difficulty scores were correlated with scores of the UMUX-Lite to further check the reliability and validity of the different scales (Sauro & Dumas 2009). For both correlations, 97.5% confidence intervals were calculated using bootstrapping with 9999 replicates of the correlation estimate.
Lastly, although certain underlying models were already assumed based on the literature review and focus groups, an exploratory factor analysis in the form of a principal component analysis was carried out. At this stage of the research, it would have been
unpractical to identify a definite model that can be tested with a confirmatory factor analysis since according to the current findings different intercorrelations between features are possible and such analyses should only be based on strong theoretical foundations (Swisher, Beckstead, & Bebeau, 2004; Fabrigar, Wegener, Maccallum, & Strahan, 1999). Moreover, it is aimed to refine the newly developed USQ, which is best achieved by an exploratory analysis (Field, Miles, & Field, 2012). The model assumptions of a principal component analysis were checked and further analyses regarding the reliability of the scale were
performed, including computing Cronbach’s alpha for each factor. Furthermore, items that did not load as much as other items on factors and items that cross-loaded with many other factors were considered to be excluded to shorten the USQ, since absolute cut-off scores are not necessarily the best practice (Osborne, Costello, & Kellow, 2008). For exclusion criteria, also the results of the focus groups were taken into account to attempt that items covering the most relevant features are not deleted.
Results
Outliers and descriptive statistics.
(M=143.79, SD=34.18). For the pre-trust item, scores ranged from 0 to 100 (M=60.40, SD=23.38) and for the post-trust item, the minimum score obtained was 0 and the maximum
[image:18.595.73.526.174.405.2]score 100 (M=58.10, SD=26.20).
Table 3
M SD Min. Max.
UMUX-Lite Raw scores [2;10] 6.87 2.36 2 10
Rescaled scores [0;1] .62 .3 0 1
Task difficulty Raw scores [1;10] 6.05 2.99 1 10
Rescaled scores [0;1] .56 .33 0 1
USQ Raw scores [42;210] 143.79 34.18 50 207
Rescaled scores [0;1] .6 .22 0 1
Pre-trust Raw scores [0;100] 60.4 23.38 0 100
Rescaled scores [0;1] .6 .23 0 1
Post-trust Raw scores [0;100] 58.1 26.2 0 100
Rescaled scores [0;1] .58 .26 0 1
Trust and the relationship among the USQ and UMUX-Lite.
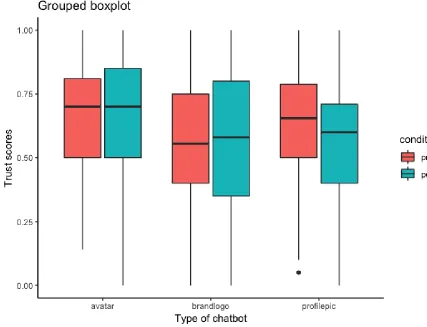
To analyse potential effects on the type of chatbot on the perceived trustworthiness before and after each interaction, first a grouped boxplot with both the pre- and post-trust variables was explored (see Figure 2). Especially the chatbots with a brandlogo in the pre-trust boxplot seem to score lower than the other types of chatbots. Overall, the differences of the means scores and standard devisations between the types of chatbots and also between pre- and post-trust scores seem small. Then, a MANOVA was performed. Although the model assumption of multivariate normality was not met by both the pre- and post-trust variables as determined by the Shapiro-Wilk normality test, this should not be a major concern due to the rather large sample size and the central limit theorem (Ghasemi, & Zahediasl, 2012). Using Pillai’s trace, there was an effect of the type of chatbot on the level of trust before and after the interaction (F(2,226)=2.85), with an effect size of η2=.04. We can be 97.5% certain that
the effect size is at least η2=.01. Separate univariate ANOVAs on the outcome variables
revealed significant effects on pre-trust (F(2,226)=4.00, p=.02) and post-trust
(F(2,226)=3.31, p=.04). By looking at the contrasts via a multiple linear regression analysis with a 95%-confident interval, it becomes apparent that the type of chatbot can explain pre-trust to a significant amount of 3% (F(2,226)=4.00, p=.02, R2=.03, R2
of chatbot can explain post-trust to a significant amount of 2% (F(2,226)=3.31, p=.04, R2=.03, R2
Adjusted=.02). Also, a univariate ANOVA with the total UMUX score as outcome
variable revealed a significant effect of the type of chatbot with an explained variance of 3% (F(2,226)=4.87, p=.01, R2=.04, R2
[image:19.595.72.499.179.506.2]Adjusted=.03).
Figure 2. Pre- and post-trust scores in form of a grouped boxplot for each type of chatbot.
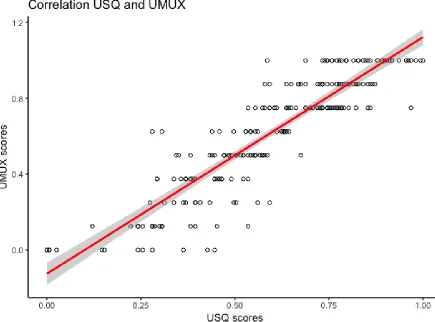
With the total scores obtained of the USQ and the UMUX-Lite, a correlation analysis was executed. While checking the model assumptions of a correlation analysis, it was found that the scores of the USQ and the UMUX-Lite are not normally distributed based on the Shapiro-Wilk normality test. Hence, it was decided to use Kendall’s tau which is not only better fitted for non-normal data than Pearson’s or Spearman’s correlations as a rank-based measure of correlation but generally rated as more sensitive for measuring correlations (Newson, 2002). The best-guess estimate of the correlation between the scores of the USQ and the UMUX-Lite was found to be rt=.76 (see Figure 3). We can be 97.5% certain that the
correlation is at least rt=.73. A reliability of ɑ=.83 was found for the UMUX-Lite items.
Figure 3. Graphical representation of the correlation between the USQ and UMUX scores
with linear smoother and 97.5% confidence intervals.
Principal component analysis of the USQ.
A principal component analysis (PCA) was conducted on the 42 items of the USQ with oblique rotation (oblimin). The Kaiser-Meyer-Olkin measure was used to verify the sampling adequacy for the analysis KMO=.88 (Kaiser, 1974), and the KMO values for all individual items were >.5, which is seen as acceptable. Bartlett’s test of sphericity, x2 (861) =
32.68, p < .001, indicated that correlations between the items were sufficiently large for
not show changes in the factor structure and indeed the reliability of factor seven increased to ɑ=.81.
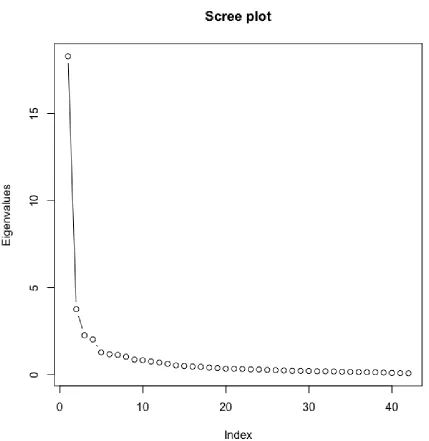
Figure 4. Scree plot of the PCA with all 42 items of the USQ.
Table 4
Oblique rotated factor loadingsa
Item TC1 TC2 TC4 TC8 TC3 TC5 TC7 TC6
USQ_10
Flexibility of linguistic
input 0.94 0.03 0 0.01 0.02 -0.11 -0.09 -0.13
USQ_11
Flexibility of linguistic
input 0.85 -0.11 0.10 -0.05 -0.04 -0.20 0.06 -0.05 USQ_22 Recogn. and facil. of goal 0.69 0.07 0.08 0.07 0.05 0.06 0.06 0.14 USQ_24 Recogn. and facil. of goal 0.60 -0.01 0.07 0.12 0.06 0.15 0.13 0.16
USQ_12
Flexibility of linguistic
input 0.60 0.14 0.09 0.09 0.04 -0.05 0.2 -0.01
[image:21.595.73.523.631.782.2]USQ_26 Maxim of relation 0.55 0.04 0.02 0.12 0.12 0.18 0.1 0.14 USQ_23 Recogn. and facil. of goal 0.53 -0.05 0.13 0.05 0.08 0.28 -0.01 0.18
USQ_14
Ability to maint. themed
dis. 0.53 0.07 0.02 -0.02 0.09 0.12 0.12 0.21
USQ_27 Maxim of relation 0.52 0.10 0.04 0.09 0.02 0.19 0.04 0.27 USQ_37 Perceived credibility 0.51 0.02 0.11 0.29 0.02 0.26 -0.06 0 USQ_39 Perceived credibility 0.46 0.11 0.03 0.30 0.09 0.25 -0.08 -0.02 USQ_25 Maxim of relation 0.44 0.03 0.01 0.24 0.02 0.18 0.11 0.24 USQ_16 Reference to service 0.44 0.01 0.06 0.11 0.02 0.38 0.11 0.12 USQ_30 Maxim of quantity 0.40 0.06 -0.09 0.33 0 0.10 0.12 0.22
USQ_15
Ability to maint. themed
dis. 0.38 0.08 -0.02 0.08 0.06 0.15 0.15 0.26
USQ_7 Expectation setting 0.30 0.06 0.23 0.23 -0.03 0.10 0.28 0.07 USQ_5 Visibility 0.06 0.89 -0.03 -0.06 0.07 0.05 -0.11 0.02 USQ_4 Visibility -0.02 0.87 0.05 -0.02 -0.07 0.04 -0.06 0.10 USQ_6 Visibility -0.07 0.85 0.04 -0.12 0.04 0.07 -0.03 0.08 USQ_3 Ease of start. a conversation 0.10 0.76 -0.01 0.04 0.05 -0.04 0.10 -0.10 USQ_2 Ease of start. a conversation -0.07 0.71 0.10 0.21 0.04 -0.08 0.07 -0.15 USQ_1 Ease of start. a conversation -0.05 0.69 0.02 0.10 -0.07 -0.11 0.26 -0.08 USQ_41 Response time 0.02 0.01 0.95 -0.03 0.01 0.01 -0.02 0.02 USQ_42 Response time -0.01 0.02 0.94 -0.07 0 0.05 0.02 0.04 USQ_40 Response time 0 0.02 0.90 0.09 0.01 -0.06 0.01 -0.03 USQ_35 Understandability -0.10 0 -0.01 0.85 0.08 -0.04 0 0.12 USQ_36 Understandability 0.01 0.04 0.15 0.75 0.01 0.02 0.05 0 USQ_34 Understandability 0.23 0.06 -0.01 0.58 0.05 0.06 0.13 0.03 USQ_38 Perceived credibility 0.22 0.03 0.08 0.40 0.16 0.31 -0.05 -0.13 USQ_29 Maxim of quantity 0.29 0.10 -0.06 0.37 -0.05 0.16 0.18 0.21 USQ_28 Maxim of quantity 0.22 0.07 -0.05 0.32 -0.05 0.13 0.18 0.17
USQ_21
Perceiv. privacy and
security -0.01 -0.01 0.09 0.02 0.92 -0.05 -0.02 -0.06
USQ_19
Perceiv. privacy and
security -0.03 -0.01 0.09 0.07 0.88 -0.02 0 0
USQ_20
Perceiv. privacy and
security 0.01 0.04 -0.18 -0.08 0.85 0 0.07 0.08
USQ_17 Reference to service -0.11 0.03 0.03 -0.06 -0.02 0.94 0.03 -0.06 USQ_18 Reference to service 0.05 0.10 0.07 0.20 -0.01 0.65 0.12 -0.04 USQ_9 Expectation setting -0.05 0.02 -0.02 -0.08 0.11 0.07 0.89 -0.07 USQ_8 Expectation setting 0.02 -0.02 0.05 0.07 -0.02 -0.04 0.85 0.05 USQ_32 Graceful responses -0.03 0.01 0.05 0.07 -0.01 -0.16 -0.05 0.88 USQ_33 Graceful responses 0.01 0.01 0.07 0.04 0.13 0.08 0.09 0.70
Eigenvalues 7.71 4.33 3.27 4.01 2.80 2.96 2.73 2.67
% of variance 19 11 8 10 7 7 7 7
ɑ .97 .9 .94 .88 .87 .79 .81 .68
a factor loadings >.3 appear in bold.
Per component, it was checked which items did not load as much as other items on a
and the consensus reached in the focus groups were considered to decide which items should be deleted. For all components, items with loadings <.7 were deleted (USQ_1, USQ_13, USQ_18, USQ_34, USQ_28, USQ_38). For component 8, there was the exception of keeping item USQ_29 to maintain an item of the feature Maxim of quantity, which reached 100% consensus in the focus groups. Another exception was component 1, in which only items with loadings <.5 were deleted (USQ_7, USQ_15, USQ_16, USQ_25, USQ_30, USQ_39). This decision was made based on high loadings (>.7) of only the first two items of the component. The consensus of other features covered by the remaining items as reached in the focus groups showed that these were considered as important and therefore, for component 1 the threshold to delete items was decreased.
The corresponding items were removed, and the principal component analysis was repeated. The Kaiser-Meyer-Olkin measure was KMO=.84, but for items USQ_9 and USQ_17 the KMO value was <.5 and therefore, both items were removed. A repeated analysis showed an overall KMO=.86 and all individual items had KMO values >.5. Also, Bartlett’s test of sphericity, x2 (3578) = 20.76, p < .001, indicated that correlations between
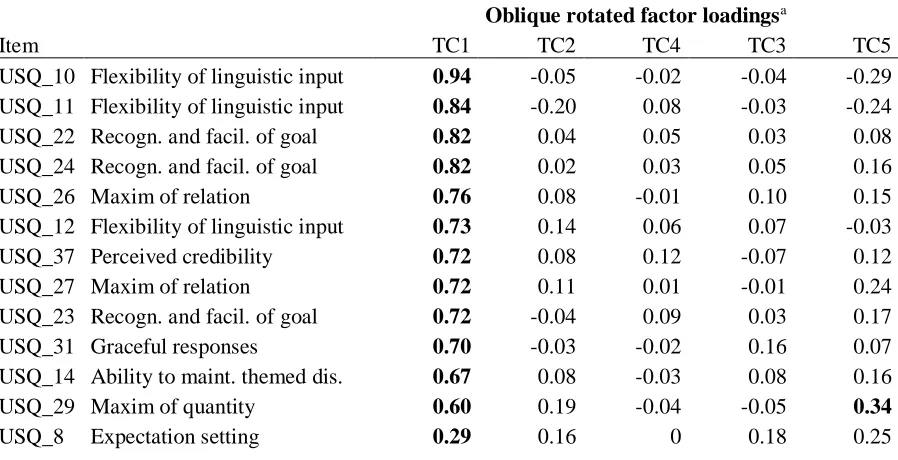
[image:23.595.75.524.549.779.2]the items were sufficiently large enough for further analysis. Again, an initial analysis was run to obtain eigenvalues for each component. Here, five components had eigenvalues above Kaiser’s criterion of 1. The scree plot also gave an indication to retain five factors for further analysis. Therefore, a repeated PCA with five factors was conducted (see Table 5). Reliability analysis of the five factors did not show that the exclusion of any item would significantly increase the reliability of factors and the item-rest correlation was >.3 for every item.
Table 5
Oblique rotated factor loadingsa
Item TC1 TC2 TC4 TC3 TC5
USQ_10 Flexibility of linguistic input 0.94 -0.05 -0.02 -0.04 -0.29 USQ_11 Flexibility of linguistic input 0.84 -0.20 0.08 -0.03 -0.24 USQ_22 Recogn. and facil. of goal 0.82 0.04 0.05 0.03 0.08 USQ_24 Recogn. and facil. of goal 0.82 0.02 0.03 0.05 0.16
USQ_26 Maxim of relation 0.76 0.08 -0.01 0.10 0.15
USQ_12 Flexibility of linguistic input 0.73 0.14 0.06 0.07 -0.03
USQ_37 Perceived credibility 0.72 0.08 0.12 -0.07 0.12
USQ_27 Maxim of relation 0.72 0.11 0.01 -0.01 0.24
USQ_23 Recogn. and facil. of goal 0.72 -0.04 0.09 0.03 0.17
USQ_31 Graceful responses 0.70 -0.03 -0.02 0.16 0.07
USQ_14 Ability to maint. themed dis. 0.67 0.08 -0.03 0.08 0.16
USQ_29 Maxim of quantity 0.60 0.19 -0.04 -0.05 0.34
USQ_5 Visibility 0.05 0.88 -0.04 0.04 -0.08
USQ_4 Visibility 0 0.88 0.04 -0.09 0.02
USQ_6 Visibility -0.09 0.87 0.01 0.03 0
USQ_3 Ease of start. a conversation 0.13 0.76 0 0.07 -0.09 USQ_2 Ease of start. a conversation -0.04 0.73 0.14 0.04 -0.01
USQ_41 Response time 0.01 0.01 0.95 0.01 -0.02
USQ_42 Response time 0 0.02 0.93 0.02 0
USQ_40 Response time 0.01 0.02 0.92 0.01 0.01
USQ_21 Perceiv. privacy and security -0.02 0 0.11 0.90 -0.06 USQ_20 Perceiv. privacy and security 0.04 0.03 -0.18 0.88 -0.06
USQ_19 Perceiv. privacy and security 0 0 0.11 0.87 0.02
USQ_32 Graceful responses 0.05 -0.15 0.05 0.03 0.73
USQ_33 Graceful responses 0.19 -0.04 0.03 0.17 0.64
USQ_35 Understandability 0.19 0.11 0.10 -0.01 0.54
USQ_36 Understandability 0.32 0.18 0.23 -0.06 0.36
Eigenvalues % of variance ɑ
7.92 3.87 3.04 2.66 2.39
28 14 11 9 9
.95 .90 .94 .87 .74
a factor loadings >.3 appear in bold.
The items that cluster on the same components indicate that component 1 (USQ_8, USQ_10, USQ_11, USQ_12, USQ_14, USQ_22, USQ_23, USQ_24, USQ_26, USQ_27, USQ_29, USQ_31, USQ_37) represents general usability including features like Expectation setting, Flexibility of linguistic input, Ability to maintain a themed discussion, Recognition and
facilitation of user’s goal and intent, as well as the Maxims of relation and quantity (see
Table 6). Component 2 (USQ_2, USQ_3, USQ_4, USQ_5, USQ_6) represents the ease of getting started with the features Ease of starting a conversation and Visibility, component 3 (USQ_19, USQ_20, USQ_21) the Perceived privacy and security, and component 4
(USQ_40, USQ_41, USQ_42) the Response time. Component 5 (USQ_32, USQ_33,
USQ_35, USQ_36) seems to focus on the chatbot’s articulateness with the features Graceful responses in unexpected situations, and Understandability. This results in a refined version of
the USQ with five factors and 28 items in total.
Table 6
Items Covered features
Component 1:
General
usability
USQ_8 I was immediately made aware of chat information the chatbot can give me.
F15 Expectation setting USQ_10 I had to rephrase my input multiple times
for the chatbot to be able to help me.
[image:24.595.73.521.69.342.2]USQ_11 I had to pay special attention regarding my phrasing when communicating with the chatbot.
USQ_12 It was easy to tell the chatbot what I would like it to do
USQ_14 The chatbot was able to keep track of context.
F9 Ability to maintain themed discussion USQ_22 I felt that my intentions were understood by
the chatbot.
F18 Recognition and facilitation of users’ goals and
intent USQ_23 The chatbot was able to guide me to my
goal.
USQ_24 I find that the chatbot understands what I want and helps me achieve my goal. USQ_26 The chatbot is good at providing me with a
helpful response at any point of the process.
F7 Maxim of relation USQ_27 The chatbot provided relevant information
as and when I needed it.
USQ_29 The chatbot gives me the appropriate amount of information.
F10 Maxim of quantity USQ_31 The chatbot could handle situations in
which the line of conversation was not clear.
F19 Graceful responses in unexpected situations USQ_37 I feel like the chatbot’s responses were
accurate.
F5 Perceived credibility Component 2:
Ease of
getting
started
USQ_2 It was easy for me to understand how to start the interaction with the chatbot.
F14 Ease of starting a conversation USQ_3 I find it easy to start a conversation with the
chatbot.
USQ_4 The chatbot was easy to access. F13 Visibility USQ_5 The chatbot function was easily detectable.
USQ_6 It was easy to find the chatbot. Component 3:
Perceived
privacy and
security
USQ_19 The interaction with the chatbot felt secure in terms of privacy.
F4 Perceived privacy and security USQ_20 I believe the chatbot informs me of any
USQ_21 I believe that this chatbot maintains my privacy.
Component 4:
Response
time
USQ_40 The time of the response was reasonable. F1 Response time USQ_41 My waiting time for a response from the
chatbot was short.
USQ_42 The chatbot is quick to respond. Component 5:
Articulatenes
s
USQ_32 The chatbot explained gracefully when it could not help me.
F19 Graceful responses in unexpected situations USQ_33 When the chatbot encountered a problem, it
responded appropriately.
USQ_35 The chatbot only states understandable answers.
F6 Understandability
USQ_36 The chatbot’s responses were easy to understand.
Discussion
The purpose of this study was to develop a questionnaire that measures different usability aspects of chatbots and to examine the effects of avatars on the trustworthiness of chatbots. For this, expert meetings and focus groups with extensive discussions were held, from which a preliminary usability satisfaction questionnaire (USQ) was developed. In usability tests with several different chatbots, the USQ was further tested and refined and the trustworthiness of the chatbots was examined.
The effects of the type of chatbot on trust and usability
The first research question, if chatbots with an avatar affect end-users’ trust in chatbots and its usability in comparison to chatbots without an avatar, was affirmed. However, the explained variance of trust before the interaction by the type of chatbot (chatbots with a brand logo, chatbots with a profile picture, chatbots with an avatar) only reached 3% and after interaction 2%. These findings can be subordinated to research such as that of Jenkins et al. (2007), who found mixed results about the benefits of chatbots with avatars. The results contrast the findings of Ciechanowski et al. (2019) and Mathur and Reichling (2016), who suggested that avatars and the therewith associated uncanny valley effect negatively influence the trustworthiness of chatbots. These authors found a stronger association between the variables than in the current research. It is possible that other factors play a more important role in determining the trustworthiness of chatbots as perceived by the end-user. In this
such website characteristics significantly influence their trustworthiness and might affect the trustworthiness of the respective chatbots in a stronger way. These findings and the results of the current research suggest that avatars only play, if any, a minor role in the perceived trustworthiness of chatbots.
Furthermore, the type of chatbot (chatbots with a brand logo, chatbots with a profile picture, chatbots with an avatar) could explain 3% variance of the usability as measured by the UMUX-Lite, which is again a rather small amount. Here, it is possible as well that other factors play a more important role in explaining the usability of chatbots. This is not in line with the suggestion that avatars benefit chatbots and smoothen the interaction process (Angga et al., 2015; Tanaka et al., 2015). However, in the focus groups, it already became apparent that a feature like personality, which includes an avatar, was perceived as relevant by only 50% of the participants. Also, participants in the focus groups indicated that the feature Trust is redundant with Privacy and security, which suggests that the latter feature is more relevant and influential. This indicates that other aspects, e.g. the perceived privacy and security, than the type of chatbot are important in determining the usability of chatbots.
The UMUX-Lite, the USQ and its components
Second, the research questions about the correlation between the results of the newly developed questionnaire and the results of the UMUX-Lite (Lewis et al., 2013) was affirmed. A good correlation between the two measurements was found. Since the UMUX-Lite (Lewis et al., 2013) is a validated measurement of general usability, this is an indication for the validity of the newly developed USQ. Furthermore, Cronbach’s alpha of the UMUX-Lite had a similar value as in the research of Lewis et al. (2013) and the scores were significantly correlated with the task difficulty. This strengthens the current research and further suggests that the collected data are valid.
2013) play an important role when examining the usability of chatbots. The results further suggest that the underlying features of each component are intercorrelated with each other.
When investigating the individual components, it becomes apparent that the first one covers the feature Flexibility of linguistic input, which is supported by the research of
Gnewuch et al. (2018), who state that technology which is able to process natural language is preferred by end-users. Also, the feature Recognition and facilitation of users’ goals and intents supports the importance of natural language processing and Huang’s (2017) statement
that in future, technologies will increasingly serve as assistants and dialog partners instead of mere tools. These features seem to include the input phase of the interaction and the ability of the chatbot to process this input. This suggests that the according features indeed are
intercorrelated and together build a more general factor focusing on the chatbot’s ability to process the input.
The feature Graceful responses in unexpected situations of component one is underlined by the results of Jenkins et al. (2007), who found that users assume high quality and sensitive output as well as manners. The other features of the first component are
Expectation setting and Perceived credibility. In the research of Kim et al. (2003) and Seeger
et al. (2017), it is stated that users place high expectations on chatbots’ abilities, which is covered with the feature Expectation setting. Kim et al. (2003) further explain that chatbots need to give high-quality output and be more efficient than humans, which underlines the features Perceived credibility and Maxim of relation. These features seem to focus more on the chatbot’s output and its overall perceived credibility, which suggests that they are in turn intercorrelated. Naturally, all features of the first component play a role in determining the overall usability of conversational agents. However, from the existing literature, it is not entirely clear how the first set of features of component one, focusing on the input, are correlated with the second set of features, focusing on the output, as it is suggested by the results of the principal component analysis. Here, more research is needed to clarify the intercorrelations among features.
The intercorrelation of the features The ease of starting the process and Visibility already becomes clear in the research of Kuligowska (2015), who states that the position and visibility of the chatbot influence its usability. This could also be found in the present research as these two features are covered in component two. In addition, chatbots should give users the impression of Privacy and security (component three) to increase user satisfaction, which was also found by Applin and Fischer (2015). As Jenkins et al. (2007) researched, the
the components three and four, only one feature is covered with all its corresponding items. Hence, these a priori assumed features seem to be autonomous aspects of the general usability of conversational agents. Still, the oblique rotation suggests that they are correlated with the other components, which supports the assumption that all components together measure the overall usability.
Besides, the last component includes two features which seem to be intercorrelated. The feature Graceful responses in unexpected situations is underlined by the results of
Jenkins et al. (2007), who found that users assume high quality and sensitive output as well as proper manners. Moreover, the authors highlight the importance of the chatbot to use
appropriate and comprehensive language, which is covered by the feature Understandability. As these two features are already investigated in the same research by Jenkins et al. (2007) and the content of both is focused on the chatbot’s output and its articulateness, their intercorrelation as suggested by the principal component analysis seems reasonable.
Only one of the features maintained after the focus groups is not included any more by the items of the refined USQ with 28 items. 93.75% of the participants agreed on the
relevance of this feature, the Reference to service. Due to the high consensus reached in the focus groups, the option of keeping the belonging items regardless of their low factor loadings should be kept in mind. Although these items did not load highly on the current factors, the feature could still play an important role in assessing the overall usability of chatbots and might need to be represented by more accurate items. Due to the current lack of research about the interaction with and usage of chatbots (e.g. Barakova, 2007; Chakrabarti & Luger, 2015; Peters et al., 2016), more investigation into this area is needed to support and
potentially extend the here extracted list of factors which are important regarding the usability of chatbots and to strengthen the validity of the USQ.
Strengths and limitations
Zahediasl, 2012), this violated assumption should be noted. Furthermore, it needs to be mentioned that the chatbots and therewith also the avatars used in the present research belonged to certain websites and brands, and as already discussed, these brands might have a more profound effect on the perceived trustworthiness than the type of chatbot itself.
Therefore, the results concerning the trustworthiness of the chatbots might not be caused by the type of chatbot but rather by the corresponding brands and websites.
Recommendations
From this, different recommendations for future research can be derived. More research is needed to further validate and refine the USQ to develop a valid and reliable questionnaire that measures the most important aspects of usability in the long-term. To achieve this, the research should be repeated on a larger scale. Also, the whole version of the USQ with 42 items and the refined version with 28 items after the principal component analysis should be examined further. The principal component analysis should be repeated to check if similar results are reached. Additionally, the hereby assumed underlying factor structure of the general usability could be tested with a confirmatory factor analysis. Moreover, the study could be repeated with neutral chatbots and avatars that are not
associated with specific brands to test if the type of chatbot indeed accounts for only a small amount of trustworthiness or if these results were caused by confounding effects. For
developers of chatbots, it is important to note that, as currently found, the implementation of an avatar neither does explain a high amount of its trustworthiness nor of its usability. This suggests that the focus in the development and design should shift towards more meaningful features of the usability of chatbots, such as the understandability, the perceived credibility, and the flexibility of linguistic input, which were all regarded as relevant by the vast majority of participants in the focus groups.
References
Angga, P. A., Fachri, W. E., Elevanita, A., Suryadi, & Agushinta, R. D. (2015). Design of chatbot with 3D avatar, voice interface, and facial expression. 2015 International Conference on Science in Information Technology (ICSITech).
doi:10.1109/icsitech.2015.7407826
Applin, S. A., & Fischer, M. D. (2015). New technologies and mixed-use convergence: How humans and algorithms are adapting to each other. 2015 IEEE International
Symposium on Technology and Society (ISTAS). doi:10.1109/istas.2015.7439436
Araujo, T. (2018). Living up to the chatbot hype: The influence of anthropomorphic design cues and communicative agency framing on conversational agent and company perceptions. Computers in Human Behavior, 85, 183-189.
doi:10.1016/j.chb.2018.03.051
Barakova, E. I. (2007). Social Interaction in Robotic Agents Emulating the Mirror Neuron Function. Nature Inspired Problem-Solving Methods in Knowledge Engineering Lecture Notes in Computer Science,389-398. doi:10.1007/978-3-540-73055-2_41
Boateng, G. O., Neilands, T. B., Frongillo, E. A., Melgar-Quiñonez, H. R., & Young, S. L. (2018). Best Practices for developing and validating scales for health, social, and behavioral research: A primer. Frontiers in Public Health, 6.
doi:10.3389/fpubh.2018.00149
Carpenter, S. (2017). Ten steps in scale development and reporting: A guide for researchers. Communication Methods and Measures,12(1), 25-44. doi:10.1080/19312458.2017.1396583
Chakrabarti, C., & Luger, G. F. (2015). Artificial conversations for customer service chatter bots: Architecture, algorithms, and evaluation metrics. Expert Systems with
Applications, 42(20), 6878-6897. doi:10.1016/j.eswa.2015.04.067
Ciechanowski, L., Przegalinska, A., Magnuski, M., & Gloor, P. (2019). In the shades of the uncanny valley: An experimental study of human–chatbot interaction. Future
Generation Computer Systems, 92, 539-548. doi:10.1016/j.future.2018.01.055
Corritore, C. L., Kracher, B., & Wiedenbeck, S. (2003). On-line trust: Concepts, evolving themes, a model. International Journal of Human-Computer Studies, 58(6), 737-758. doi:10.1016/s1071-5819(03)00041-7
Fabrigar, L. R., Wegener, D. T., Maccallum, R. C., & Strahan, E. J. (1999). Evaluating the use of exploratory factor analysis in psychological research. Psychological
Field, A., Miles, J., & Field, Z. (2012). Discovering statistics using R. London: SAGE Publications Ltd.
Ghasemi, A., & Zahediasl, S. (2012). Normality tests for statistical analysis: A guide for non-statisticians. International Journal of Endocrinology and Metabolism,10(2), 486-489. doi:10.5812/ijem.3505
Gnewuch, U., Morana, S., & Maedche, A. (2018). Towards designing cooperative and social conversational agents for customer service. In ICIS 2017: Transforming Society with Digital Innovation. Retrieved from
https://www.scopus.com/inward/record.uri?eid=2-s2.0- 85041742966&partnerID=40&md5=e04f4be1dea36cccd52963bb8da7106f Golvin, C. S., Foo Kune, L., Elkin, N., Frank, A., & Sorofman, J. (2016). Predicts 2017:
Marketers, expect the unexpected. Retrieved from
https://www.gartner.com/binaries/content/assets/events/keywords/digital-marketing/gml3/gartner-2017-marketing-predicts.pdf
Huang, H. (2017). Embodied conversational agents. The Wiley Handbook of Human Computer Interaction,599-614. doi:10.1002/9781118976005.ch26
Ireland, C. (2019, June 04). Alan Turing at 100. Retrieved from
https://news.harvard.edu/gazette/story/2012/09/alan-turing-at-100/
Jenkins, M., Churchill, R., Cox, S., & Smith, D. (2007). Analysis of user interaction with service oriented chatbot systems. Human-Computer Interaction. HCI Intelligent Multimodal Interaction Environments Lecture Notes in Computer Science, 76-83.
doi:10.1007/978-3-540-73110-8_9
Kaiser, H. F. (1974). An index of factorial simplicity. Psychometrika, 39(1), 31-36. doi:10.1007/bf02291575
Kim, B., Park, K., & Kim, J. (2003). Satisfying different customer groups for IS outsourcing: A korean IS company’s experience. Asia Pacific Journal of Marketing and
Logistics,15(3), 48–69. doi:10.1108/13555850310765006
Kuligowska, K. (2015). Commercial Chatbot: Performance Evaluation, Usability Metrics and Quality Standards of Embodied Conversational Agents. Professionals Center for Business Research,2(02), 1-16. doi:10.18483/pcbr.22
Larivière, B., Bowen, D., Andreassen, T. W., Kunz, W., Sirianni, N. J., Voss, C., ... & De Keyser, A. (2017). “Service encounter 2.0”: An investigation into the roles of technology, employees and customers. Journal of Business Research, 79, 238-246. doi:10.1016/j.jbusres.2017.03.008
SIGCHI Conference on Human Factors in Computing Systems - CHI ’13 (p. 2099).
New York, New York, USA: ACM Press. doi:10.1145/2470654.2481287
Mathur, M. B., & Reichling, D. B. (2016). Navigating a social world with robot partners: A quantitative cartography of the uncanny valley. Cognition,146, 22-32.
doi:10.1016/j.cognition.2015.09.008
McTear, M. F. (2017). The rise of the conversational interface: A new kid on the
block? Lecture Notes in Computer Science Future and Emerging Trends in Language Technology. Machine Learning and Big Data,38-49.
doi:10.1007/978-3-319-69365-1_3
Mimoun, M. S., Poncin, I., & Garnier, M. (2012). Case study—Embodied virtual agents: An analysis on reasons for failure. Journal of Retailing and Consumer Services,19(6), 605-612. doi:10.1016/j.jretconser.2012.07.006
Mori, M. (1970). The uncanny valley. Energy, 7(4), 33-35.
Newson, R. (2002). Parameters behind “nonparametric” statistics: Kendall’s tau, Somers’ D and median differences. The Stata Journal, 2(1), 45-64. Retrieved from
https://www.stata-journal.com/sjpdf.html?articlenum=st0007
Osborne, J., Costello, A. & Kellow, J. (2008). Best practices in exploratory factor analysis. In Osborne, J. Best practices in quantitative methods (pp. 86-99). Thousand Oaks, CA: SAGE Publications, Inc. doi: 10.4135/9781412995627
Peters, C., Maglio, P., Badinelli, R., Harmon, R. R., Maull, R., Spohrer, J. C., ... & Griffith, T. L. (2016). Emerging digital frontiers for service innovation. Communications of the Association for Information Systems: CAIS, 1(39). doi:10.17705/1CAIS.03908
R Core Team (2013). R: A language and environment for statistical computing. R Foundation for Statistical Computing, Vienna, Austria. Retrieved from http://www.R-project.org/ Sauro, J., & Dumas, J. S. (2009). Comparison of three one-question, post-task usability
questionnaires. Proceedings of the 27th International Conference on Human Factors in Computing Systems - CHI 09. doi:10.1145/1518701.1518946
Saygin, A. P., Cicekli, I., & Akman, V. (2000). Turing test: 50 years later. Minds and machines, 10(4), 463-518. doi:10.1023/A:1011288000451
Seckler, M., Heinz, S., Forde, S., Tuch, A. N., & Opwis, K. (2015). Trust and distrust on the web: User experiences and website characteristics. Computers in Human Behavior,45, 39-50. doi:10.1016/j.chb.2014.11.064
Anthropomorphic design and trustworthiness of conversational agents. In Proceedings of the Sixteenth Annual Pre-ICIS Workshop on HCI Research in MIS, AISeL, Seoul,
Korea (Vol. 10). http://aisel.aisnet.org/sighci2017/15
Shackel, B. (2009). Usability–context, framework, definition, design and evaluation. Interacting with computers, 21(5-6), 339-346.
doi:10.1016/j.intcom.2009.04.007
Swisher, L.L., Beckstead, J.W., & Bebeau, M.J. (2004). Factor analysis as a tool for survey analysis using a professional role orientation inventory as an example. Physical Therapy. doi:10.1093/ptj/84.9.784
Tanaka, K., Nakanishi, H., & Hiroshi, I. (2015). Appearance, motion, and embodiment: Unpacking avatars by fine-grained communication analysis. Concurrency and Computation: Practice and Experience,27(11), 2706-2724. doi:10.1002/cpe.3442
Tariverdiyeva, G., & Borsci, S. (2019). Chatbot’s perceived usability in information retrieval tasks: an exploratory analysis (Master thesis). Retrieved from University of Twente
Student Theses
The media equation: How people treat computers, television, & new media like real people & places. (1997). Computers & Mathematics with Applications,33(5), 128.
doi:10.1016/s0898-1221(97)82929-x
Trivedi, J. (2019). Examining the Customer Experience of Using Banking Chatbots and Its Impact on Brand Love: The Moderating Role of Perceived Risk. Journal of Internet Commerce,1-21. doi:10.1080/15332861.2019.1567188
Appendix A Preliminary Usability Satisfaction Questionnaire (USQ)
Feature Description Item 1 Item 2 Item 3
F1 Response time Ability of the chatbot to respond timely to users' requests
The time of a response was
reasonable.
My waiting time for a response
from the chatbot is short.
The chatbot is quick to respond.
F2 Engage in on-the-fly problem solving
Ability of the chatbot to solve problems instantly on the spot
The chatbot solved my problems instantly.
The chatbot is able to answer any questions within a few seconds.
The chatbot immediately provided a solution. F3 Trust (general) Ability of the chatbot to convey
accountability and trustworthiness to increase willingness to engage
I felt that I could trust the chatbot.
The chatbot reassures me that I can trust this technology.
I trust this chatbot.
F4 Privacy & security
Ability of the chatbot to protect the user’s privacy
The interaction with the chatbot
felt secure in terms of privacy.
I believe the chatbot is informing
me of any possible privacy issues
I believe that this chatbot maintains my privacy.
F5 Perceived credibility
How correct and reliable the chatbot's output seems to be
I feel like the chatbot's responses
were accurate.
I believe that the chatbot only
states reliable information.
I feel like the chatbot's responses were accurate.
F6 Understandability Ability of the chatbot to
communicate clearly and is easily understandable
I found the chatbot's responses
clear.
The chatbot only states understandable answers
The chatbot's responses were easy to understand. F7 Maxim of
relation
Ability of the chatbot to provide the relevant and appropriate contribution to peoples needs at each stage
The chatbot gave relevant
information during the
The chatbot is good at providing
me with a helpful