http://wrap.warwick.ac.uk
Original citation:
Hartmann, Manuela, Gomez-Pereira, Paola, Grob, Carolina, Ostrowski, Martin, Scanlan,
David J. and Zubkov, Mikhail V.. (2014) Efficient CO2 fixation by surface
Prochlorococcus in the Atlantic Ocean. The ISME Journal, Volume 8 (Number 11). pp.
2280-2289. ISSN 1751-7362
Permanent WRAP url:
http://wrap.warwick.ac.uk/63606
Copyright and reuse:
The Warwick Research Archive Portal (WRAP) makes this work of researchers of the
University of Warwick available open access under the following conditions.
This article is made available under the Creative Commons Attribution 3.0 (CC BY 3.0)
license and may be reused according to the conditions of the license. For more details
see: http://creativecommons.org/licenses/by/3.0/
A note on versions:
The version presented in WRAP is the published version, or, version of record, and may
be cited as it appears here.
OPEN
ORIGINAL ARTICLE
Efficient CO2
fixation by surface
Prochlorococcus
in the Atlantic Ocean
Manuela Hartmann
1, Paola Gomez-Pereira
1,3, Carolina Grob
2,4, Martin Ostrowski
2,5,
David J Scanlan
2and Mikhail V Zubkov
11Ocean Biogeochemistry and Ecosystems Research Group, National Oceanography Centre, Southampton,
UK and2School of Life Sciences, University of Warwick, Coventry, UK
Nearly half of the Earth’s surface is covered by the ocean populated by the most abundant photosynthetic organisms on the planet—Prochlorococcus cyanobacteria. However, in the oligotrophic open ocean, the majority of their cells in the top half of the photic layer have levels of photosynthetic pigmentation barely detectable by flow cytometry, suggesting low efficiency of CO2 fixation compared with other phytoplankton living in the same waters. To test the latter assumption, CO2fixation rates of flow cytometrically sorted14C-labelled phytoplankton cells were directly compared in surface waters of the open Atlantic Ocean (301S to 301N). CO2fixation rates of Prochlorococcusare at least 1.5–2.0 times higher than CO2fixation rates of the smallest plastidic protists and Synechococcus cyanobacteria when normalised to photosynthetic pigmentation assessed using cellular red autofluorescence. Therefore, our data indicate that in oligotrophic oceanic surface waters, pigment minimisation allows Prochlorococcus cells to harvest plentiful sunlight more effectively than other phytoplankton.
The ISME Journal(2014)8,2280–2289; doi:10.1038/ismej.2014.56; published online 24 April 2014
Subject Category:Geomicrobiology and microbial contributions to geochemical cycles
Keywords: primary production; chlorophyll autofluorescence; flow cytometric cell sorting;14C radiolabelling
Introduction
Oceanic phytoplankton constitute only a minute fraction of the photosynthetic biomass on Earth (Falkowski, 2012), but they contribute almost half of the yearly global net primary production (Falkowski
et al., 1998; Fieldet al., 1998; Behrenfeldet al., 2001).
Prochlorococcus (Pro) cyanobacteria are the most abundant phytoplankton in the ocean, inhabiting nutrient-depleted environments from the equator up
to 40–501 of latitude (Campbell and Vaulot, 1993;
Zubkov et al., 2000). However, in surface waters the
cellular pigment concentration of Pro is very low
(B0.1 fg divinyl chlorophyll per cell), and
conse-quently their carbon to chlorophyll ratios are very
high (93.3–122 mg C per mg chlorophyll-a) in
comparison with Synechococcus cyanobacteria and
small picoeukaryotes (38–58 mg C per mg chlorophyll-a)
(Veldhuis and Kraay, 2004; Boumanet al., 2006).
From their discovery onwards, Pro cells were
almost exclusively enumerated by flow cytometry using their red autofluorescence and small size for
identification (Chisholm et al., 1988; Partensky
et al., 1999). Cellular red autofluorescence and chlorophyll pigment content are directly linked
(Moore et al., 1995; Cavender-Bares et al., 1999;
Dusenberryet al., 2001), although the relation may
not always be linear and can be affected by pigment ‘packaging’ or variations in accessory pigments predominantly for larger, more heterogeneous cells
(Sosiket al., 1989). Low red autofluorescence ofPro
cells hampered their flow cytometric enumeration
(Olson et al., 1990; Dusenberry and Frankel, 1994)
and technical improvements such as tightening of the beam spot, broadening of laser excitation, the introduction of quartz flow cells with integrated lenses as well as the reduction of the sheath
pressure were used to detect low pigmented Pro
cells (Olson et al., 1990; Cavender-Bares et al.,
1998). However, in the upper 40–80 m of stratified oligotrophic oceanic waters, it has remained a
challenge to enumerate Pro cells unambiguously
using their red autofluorescence (Chisholm et al.,
1988; Zubkov et al., 1998; Partensky et al., 1999;
Ting et al., 2002; Malmstrom et al., 2010). In such
surface waters, the flow cytometrically visible Pro
population is typically shaped in the form of a
Correspondence: MV Zubkov, Ocean Biogeochemistry and Ecosystems Research Group, National Oceanography Centre, Southampton, European Way, Southampton, Hampshire SO14 3ZH, UK.
E-mail: [email protected]
3Current address: Philips Research, Cambridge, UK.
4Current address: School of Environmental Sciences, University
of East Anglia, Norwich, UK.
5Current address: Department of Chemistry and Biomolecular
Science, Macquarie University, North Ryde, New South Wales, Australia.
Received 5 December 2013; revised 6 March 2014; accepted 11 March 2014; published online 24 April 2014
The ISME Journal (2014) 8,2280–2289
&2014 International Society for Microbial Ecology All rights reserved 1751-7362/14
‘rising sun’ emerging out of the background noise on
a scatter plot of red autofluorescence (4650 nm) vs
901 side light scatter (Charles et al., 2005 and
Supplementary Figure S1). In some studies, an
extrapolation based on the visible part of the Pro
population was applied to correct for the missing
part (see, for example, Partensky et al., 1996).
Nucleic acid staining of bacterioplankton was
proposed as an alternative solution to the Pro cell
detection problem (Zubkov et al., 2000). Later
molecular identification confirmed that a distinct population observed following nucleic acid staining
consists mainly of Pro cells (Zubkov et al., 2007;
Maryet al., 2008; Gomez-Pereiraet al., 2013). Direct
comparison of the two approaches forPro
enumera-tion, that is, using red autofluorescence or cellular DNA-content/light scatter for identification, showed
that in surface waters, up to a half of theProcells are
unaccounted when red autofluorescence is used as
the sole identifier (Zubkovet al., 2000).
High irradiance and resulting bleaching of photo-synthetic pigments alongside potential nutrient-limitation in surface waters of oceanic subtropical gyres are common explanations for almost
colour-less Pro cells in surface ocean waters. Because in
deeper (480 m) nutrient-replete but less
illumi-nated parts of the water column,Pro pigmentation
is much more intense (Partensky et al., 1999), the
CO2 uptake studies have focussed on Pro living in
deeper waters (Chisholmet al., 1988; Li, 1994).
We put to the test two alternative explanations that account for the extremely low
photopigmenta-tion of Pro cells in the nutrient-depleted surface
waters: (1) pigment levels are decreased as a result of the combined effects of high irradiance and nutrient limitation that diminishes capacity of the cells to cope with this stress, or (2) constitutively low cellular levels of photosynthetically active pigmen-tation are adequately physiologically balanced for these environmental conditions. In the former case,
Pro red autofluorescence-normalised CO2 fixation
should be low compared with other phytoplankton,
whereas red autofluorescence-normalised CO2
fixa-tion ofPro cells will be comparable with, or higher
than, red autofluorescence-normalised CO2fixation
by other phytoplankton cells if the latter were true. Here, we present direct experimental evidence that
red autofluorescence-normalised CO2 fixation of
sur-faceProis high compared with the smallest eukaryotic
phytoplankton and Synechococcus cyanobacteria.
These results demonstrate that the dim red
autofluor-escence of surfaceProdoes not prevent them attaining
high CO2fixation rates across the Atlantic Ocean.
Materials and methods
SamplingPre-dawn seawater samples were collected from 20 m depth in 20 l Niskin (Miami, FL, USA) bottles attached to a standard conductivity–temperature– depth profiler on the 20th cruise of the Atlantic
Meridional Transect programme aboard the UK
Royal Research Ship James Cook in October–
November 2010 (Supplementary Figure S2). Sea-water content of the entire Niskin bottle was decanted into an acid-rinsed polycarbonate carboy. To prevent exposure of photosynthetic cells to artificial light on board, the carboy was covered completely with two layers of dark plastic. Samples were processed immediately after collection. The sampling depth was chosen because it reflects the surface mixed layer, and the influence of ship movement and contaminants at that depth are minimal. At selected stations (indicated in Supplementary Figure S2) additional samples were taken from the bottom of the thermocline in order to
compare CO2 fixation rates of deeper vs surface
phytoplankton communities.
Abundance measurements and definition of regional boundaries
Concentrations of theSynechococcus(Syn) andPro
cyanobacteria were determined in unstained, fixed (1% paraformaldehyde, final concentration; Sigma-Aldrich, Hamburg, Germany) samples according to
Olsonet al. (1993) using a FACSort flow cytometer
(Becton-Dickinson, Oxford, UK). Pro cells were
counted in both unstained (Prounst) and stained
fixed samples (Prost) on the basis of their red
autofluorescence and 901side light scatter, and their
nucleic acid content (green fluorescence) and 901
side light scatter, respectively. Subsamples for Prost
counting were taken from a 20 l carboy and fixed with 1% paraformaldehyde for 1 h in the dark at room temperature and stained with SYBR Green I
dye (Sigma-Aldrich) (Marie et al., 1997). Cellular
abundances of small (o2mm) and large (2–5mm)
plastidic eukaryotes (Plast-S and Plast-L, respec-tively) were determined in parallel from the same sample. Before flow cytometric analyses, a mixture
of 0.5 and 1.0mm multi-fluorescent beads
(Polysciences, Eppelheim, Germany) at a calibrated concentration (Zubkov and Burkill, 2006) was added to both stained and unstained samples. The beads were used as an internal standard for calculating absolute cell concentrations and for normalising cellular red autofluorescence.
Four major oceanic regions were identified using
primarily Syn abundances: Northern subtropical
gyre (NG), equatorial waters (EQ), Southern sub-tropical gyre (SG) and Southern temperate waters
(ST) (Hartmannet al., 2012).
Catalysed reporter deposition fluorescence in situ hybridisations (CARD-FISH) on flow cytometrically sorted cells
In order to confirm that the distinct, high-nucleic acid bacterial population observed by flow cytome-try (Supplementary Figure S1) consists mainly
of Pro cells, CARD-FISH hybridisations using the
Pro-specific probe PRO405 (West et al., 2001) were
carried out on sorted cells at selected stations
covering each province (NG, EQ and SG). The in
silico specificity of the probe was re-evaluated by running TestProbe (part of the Silva online software
packages, www.arb-silva.de; Quast et al., 2013)
against the Silva SSU r117 reference database. In
addition, the Eubacteria-targeted probe mix
Eub338I-III (Amannet al., 1990; Daimset al., 1999)
was used to determine overall hybridisation effi-ciency. The details of contamination-free flow sorting of target cells and CARD-FISH are described
in Gomez-Pereira et al. (2013). We analysed seven
stations in the NG, three stations in the EQ and four stations in the SG.
Total and cell-specific CO2fixation
Before each experiment, 60 ml Pyrex glass bottles (Fisher Scientific, Loughborough, UK) were acid-soaked overnight (10% HCl) and rinsed twice with 30 ml sample sea water. After washing, 60 ml of seawater sample was added to each bottle and spiked
with trace metal-clean 14C radiolabelled sodium
bicarbonate (34.66 mM NaH14CO3; DHI, Hørsholm,
Denmark). Samples were then incubated at ambient temperatures (regulated by a refrigerated water bath (Grant Instruments, Shepreth, UK)) in a 6 l water tank illuminated by a warm white light-emitting diode array (Photon Systems Instruments, Drasov, Czech
Republic) adjusted to a constant output of 500mmol
photons m2s1. The chosen light intensity equals
half the irradiance reaching the water surface at
noon-time in the equatorial region (Jittset al., 1976),
because on average at 20 m depth the light intensity is reduced by 33–55%. Moreover, no photoinhibition
occurs at this light intensity (Morel et al., 1996). In
contrast to incubations at ambient light, the constant
light output made it possible to compare CO2fixation
rates at different stations.
Two different concentrations of NaH14CO
3 were
used to determine total CO2 fixation during a
time series and to measure CO2 fixation of flow
cytometrically sorted phytoplankton populations, respectively. Time series were carried out to ensure linear uptake of label and to guarantee that the small volumes of sorted cells are representative of the whole community (Supplementary Figure S3). Subsamples of 1.6 ml were taken at 0 and 10 h for flow cytometric analyses to ascertain that community composition remained unchanged for the duration of the experi-ment (Suppleexperi-mentary Figure S4).
For time series CO2 fixation measurements,
3.7 kBq ml1NaH14CO
3was added to 60 ml seawater
sample. In total six Pyrex glass bottles were prepared. Five bottles were incubated for 2, 4, 6, 8 and 10 h in the light, and the remaining bottle was incubated for 10 h in the dark. At each discrete time point, the whole sample was fixed by adding 1% paraformaldehyde (final concentration) and incubated for 1 h at room temperature. Subse-quently, the complete sample was filtered onto a
0.2mm polycarbonate filter (Nuclepore, Whatman,
Little Chalfont, UK), washed three times with ultra-clean water (MQ system, Millipore, Whatman, Walford, UK) and placed in a scintillation vial.
Before addition of 5 ml scintillation cocktail
(Goldstar, Meridian, Epsom, UK), 1 ml of 10% HCl was added, the vial gently swirled and incubated for
10–30 min to fume out non-incorporated NaH14CO
3.
Dark CO2 fixation rates were o3% of paired
CO2 fixation rates in the light in all experiments
(Supplementary Figure S3).
To determine group-specific CO2 fixation rates,
higher NaH14CO
3 concentrations had to be used
because of the small size of the organisms. To 60 ml
seawater sample in a Pyrex glass bottle,
246 kBq ml1 NaH14CO
3 was added, the sample
incubated for 10 h and then fixed with 1% paraf-ormaldehyde (final concentration). Three 1.6 ml subsamples were taken directly to determine total
CO2 fixation and to sort Prost. In order to sort
adequate cell numbers of cyanobacteria (Prounst and
Syn), 20 ml of the sample was concentrated on a
0.6mm polycarbonate filter (Nuclepore, Whatman)
mounted in a filtration unit (Swinnex, Millipore) using a syringe pump (KD Scientific, Holliston, MA,
USA) at a flow rate of 2.5 ml min1. This pore size
was selected as it was shown in an earlier
publica-tion (Zubkov et al., 1998) that the Pro population
with visible red autofluorescence had a cell
dia-meter of 0.63±0.03mm. Moreover, similar 901 side
light scatter values of Prounst before and after
concentration suggest that there is no selective enrichment of larger cells because of the
concentra-tion procedure (Student’s t-test, P¼0.871,
Supplementary Figure S5). The remaining sample
was concentrated on a 0.8mm polycarbonate filter
(Nuclepore, Whatman) the same way to enrich
eukaryotic phytoplankton. Apart from the 0.6mm
concentrated fraction, all samples were stained with
SYBR Green I (Marieet al., 1997), stored at 41C and
sorted flow cytometrically within 10 h.
In order to determine the influence of nutrients on
CO2fixation, at three stations (NG and SG) a parallel
incubation was carried out where 2.6 ml of nutrient-enriched sea water from 300 m depth was added to 60 ml of seawater sample from 20 m to simulate a mixing event (Supplementary Figure S2). The experiment was run in parallel to our standard 20 m incubations for 10 h under the same light regime. The sample was processed as described above for the standard incubations. The nutrient
addition corresponds to an B20-fold increase in
nitrite/nitrate concentration (0.03 and 16.83mmol l1
average ambient concentration at 20 and 300 m, respectively; Harris and Woodward, 2014) along the whole transect. At four stations (Supplementary Figure S2, EQ and SG), samples from the bottom of the thermocline were incubated in parallel at the same light intensity as surface samples to compare
CO2fixation rates of phytoplankton groups living at
the two depths.
CO2fixation byProchlorococcus
M Hartmannet al
2282
Flow cytometric sorting
Different phytoplankton populations were sorted
according to light scattering properties (901or side
light scatter), relative concentration of SYBR Green I
stain per particle (green fluorescence; FL1,
530±30 nm), phycoerythrin content (orange
fluor-escence; FL2, 580±30 nm) and chlorophyll content
(red fluorescence; FL3, 4650 nm) using a FACSort
instrument (Becton-Dickinson). Because of their low pigmentation in surface waters, we used two
approaches to sort Pro cells. A distinct bacterial
population, verified to be mainlyProby CARD-FISH
(486%, Table 1), was sorted from unconcentrated,
SYBR Green I stained samples (Prost) according to
side scatter and green fluorescence properties. In
addition,Prowas sorted according to red
autofluor-escence from 0.6mm concentrated unstained
samples (Prounst), as earlier studies indicated a cell
diameter of 40.6mm (Chisholm et al., 1988; Vaulot
et al., 1990; Zubkov et al., 2000). From the same
sample, Syn cells were sorted according to their
phycoerythrin content. Plast-S and Plast-L
popula-tions were sorted from 0.8mm concentrated, stained
samples using side scatter, SYBR Green I stain and red autofluorescence as defining parameters. For each population, 4–6 replicates of different cell numbers were sorted. Bacterial and eukaryotic cells were
collected on 0.2 and 0.8mm polycarbonate filters,
respectively, and treated following the same procedure
as for total CO2 measurements (see above) before
counting. Radioassaying of samples was carried out using an ultra-low-level liquid scintillation counter (1220 Quantulus, Wallac, Waltham, MA, USA).
Cell biomass estimation of Pro and other phytoplankton
Cell diameters of Prost and Prounst surface
popula-tions were determined on Atlantic Meridional Transect (AMT)-4 at 11 stations spanning NG, EQ and SG regions using a size fractionation method
(Zubkov et al., 2000). Briefly, cell concentrations
were measured in unfiltered samples and filtrates after filtering samples through polycarbonate filters
(Nuclepore) of different pore sizes. The filter pore size versus the percentage of cells in the correspond-ing filtrates relative to cell concentration in the unfiltered sample were plotted to estimate the pore size that would retain 50% of cells. That pore size was interpreted as a mean cell diameter. Average cell
diameters ofProst(0.52±0.03mm,n¼30) andProunst
(0.6±0.05mm, n¼35) were significantly different
(t-test,Po0.001). Mean cell biovolumes were
calcu-lated assuming a spherical cell shape. For Pro and
Syn cells, conversion factors of 184 and
211 fg Cmm3(Heldalet al., 2003) and cell diameters
of 0.52±0.03 and 0.95±0.31mm (Zubkov et al.,
2000) were applied. Details of all conversion factors used in this study can be found in Table 2. A
conversion factor of 200 fg Cmm3(Waterburyet al.,
1986) was used to calculate biomass-specific CO2
fixation rates assuming spherical cell shape and
average cell diameters of 2.0±0.1 and 3.1±0.3mm
for Plast-S and Plast-L cells, respectively (Hartmann
et al., 2012). These cell diameters were established for all studied regions on two consecutive AMT cruises, including AMT-20 where the here presented
CO2fixation rates were measured.
Data analyses
Cell-specific CO2 fixation rates were determined
from average per cell values of each of the sorted
replicates and converted to fg C cell1h1according
to (Parsons et al. (1984). Statistical analyses were
carried out using SigmaPlot (London, UK). In case of
normal distribution and equal variance,t-tests were
carried out for comparison. If the data were nonnormally distributed or the equal variance test failed, Mann–Whitney rank-sum tests were used.
Results
Determination of Pro cell abundance and CO2fixation rates
Because of the low red autofluorescence ofProcells
in surface waters and the resulting unreliability of detection, we focussed on a distinct population within the bacterioplankton based on flow cytome-trically determined cellular nucleic acid content
and 901 light scatter, called Prost (Supplementary
Figure S1; Zubkov et al., 2000). The taxonomic
identity of cells within this population was verified by flow sorting followed by Card-FISH using a
Pro-targeted probe (Pro405, West et al.2001) at 14
stations along the AMT (Table 1). The majority of flow sorted cells (86–94%) hybridised with the
Pro-specific probe, corroborating the results of
previous molecular studies of the same distinct
population (Table 1; Zubkovet al., 2007; Maryet al.,
2008; Gomez-Pereira et al., 2013). As a control,
Pro cells were in parallel enumerated on the basis
of red autofluorescence in unstained samples
(Prounst, Supplementary Figure S1) and compared
[image:5.595.38.278.619.677.2]with Prost cell numbers revealing a significant
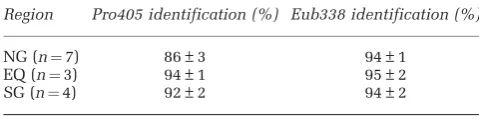
Table 1 Identification of a flow cytometrically sorted, distinct population with high-nucleic acid content asProchlorococcus
cyanobacteria (Pro) in different regions of the Atlantic Ocean using Pro-targeted CARD-FISH (Pro405)
Region Pro405 identification (%) Eub338 identification (%)
NG (n¼7) 86±3 94±1 EQ (n¼3) 94±1 95±2 SG (n¼4) 92±2 94±2
Abbreviations: EQ, equatorial region;n, number of sampled stations; NG, Northern Gyre; SG, Southern Gyre.
Numbers are given as percentage of 40,6-diamidino-2-phenylindole
(DAPI)-stained cells. For comparison, percentage of positive signals for the eubacterial probe (EUB338I-III) is presented. The symbol ‘±’ indicates standard error (s.e.m.).
underestimation of Pro abundance in Prounst
mea-surements (Figure 1a).
To independently validate the molecular
identifi-cation of Prost, fixation of14CO2was determined in
both Prost and Prounst sorted cells (Supplementary
Figure S1). Both populations were
photosyntheti-cally active, and the 14CO
2 fixation rate per cell of
Prounst was 50% higher than that ofProst(Wilcoxon
signed-rank test, Po0.001; Figure 1b). A strong
linear correlation between the14CO
2 fixation of the
ProstandProunstcells (R2¼0.93,Po0.001) indicated
that the Prounst cells comprised a subpopulation of
theProstpopulation (Figure 1).
There could be two reasons why the Prounst cells
systematically fixed 50% more 14CO
2than theProst
cells:
1. The presence of non-photosynthetic bacteria
among the sorted Prost cells could lower the
average cellular 14C content (because the total
measured14CO
2fixation was divided by the total
number of sorted cells). The cells among the
sortedProstpopulations not hybridising with the
Pro-targeted probe could either bePro cells with
ribosomal contents below detection level of FISH
(for example, Pro cells were compromised or
dead) or they could be by-sorted non-Pro cells
displaying similar DNA fluorescence and side light scatter properties. A small proportion of sorted cells (5–6%) could not be detected by FISH with the universal bacterial probe (Table 1), and this lends support to the former explanation. However, even in the extreme (assumed) case if
all probe-negative cells were by-sorted non-Pro
cells, one could explain a discrepancy of only
6–14% between Prost andProunst rather than the
measured 50% difference.
2. On average, larger Prounst cells that contain
proportionally higher chlorophyll amounts
resulting in detectable red autofluorescence
could fix more 14CO
2 than smaller Prost cells.
Indeed, cell diameter estimates carried out on an earlier AMT cruise (AMT-4) using size
fractiona-tion revealed thatProst cells were systematically
smaller than Prounst cells across the Atlantic
Ocean (Table 2; Zubkov et al., 2000). These
observations suggest that only larger or dividing
Pro cells with higher red autofluorescence were
visible above the threshold of the red fluores-cence photomultiplier detector. Indeed, the
abun-dance ofProunstcells was significantly lower than
that of Prost cells (on average 58±18%,
Figure 1a). Consequently, the Prounst cells are
not representative of the entirePropopulation in
surface waters. Sorting ofProunstwould therefore
lead to overestimation of the actual cellular CO2
fixation rates byPro, and we used hereafterProst
cells for more realistic measurement of CO2
fixation byPro cells.
The Procell-specific CO2fixation rates in the NG
and SG were similar, but their rates were more than
doubled in the EQ (t-test, P¼0.002; Supplementary
Figure S6 and Supplementary Table S1). The CO2
fixation rates of Plast-L cells followed the same
pattern (t-test, Po0.001), showing increased rates in
the EQ (Supplementary Figure S6 and Supplementary
Table S1). In contrast, Plast-S as well as Syn cells
showed similar rates in the NG, SG and EQ, but significantly lower CO2fixation rates in the ST (t-test,
P¼0.042 andP¼0.032, respectively, Supplementary
Figure S6 and Supplementary Table S1).
Comparison of cellular, red autofluorescence-normalised and biomass-specific CO2fixation of Pro, Syn and small eukaryotic phytoplankton
Although cellular CO2 fixation rates positively
correlated with cell sizes (R2¼0.83, Supplementary
Figure S6), no such relationship was found between red autofluorescence-normalised or biomass-specific
[image:6.595.65.556.90.185.2]CO2uptake (see Table 2 for details on biomass in this
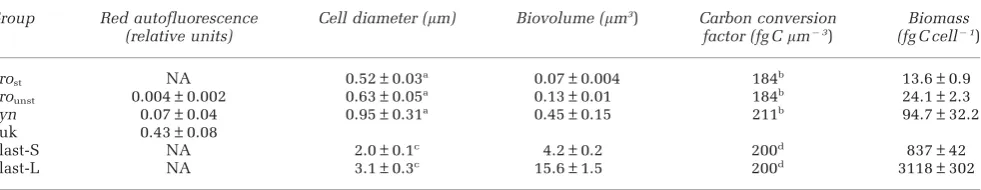
Table 2 Summary table of conversion factors used to calculate red autofluorescence-normalised and biomass-specific CO2fixation for
the different phytoplankton populations
Group Red autofluorescence (relative units)
Cell diameter (mm) Biovolume (mm3) Carbon conversion
factor (fg Cmm3)
Biomass (fg C cell1)
Prost NA 0.52±0.03a 0.07±0.004 184b 13.6±0.9
Prounst 0.004±0.002 0.63±0.05a 0.13±0.01 184b 24.1±2.3 Syn 0.07±0.04 0.95±0.31a 0.45±0.15 211b 94.7±32.2
Euk 0.43±0.08
Plast-S NA 2.0±0.1c 4.2±0.2 200d 837±42
Plast-L NA 3.1±0.3c 15.6±1.5 200d 3118±302
Abbreviations: Euk, eukaryotic phytoplankton; NA, not available; Plast-L, large (B3.1mm) plastidic eukaryotes; Plast-S, small (B2mm ) plastidic eukaryotes;Prost,Prochlorococcusstained;Prounst,Prochlorococcusunstained;Syn,Synechococcus.
Red autofluorescence values are based on mean red autofluorescence emitted by the individual populations and normalised to red
autofluorescence of 1.0mm multifluorescent reference beads as measured by flow cytometry. Cell biovolume was calculated on the basis of a spherical shape of the cell.
aZubkovet al.(2000). bHeldalet al.(2003). cHartmannet al.(2012). dWaterburyet al.(1986).
CO2fixation byProchlorococcus
M Hartmannet al
2284
study and Supplementary Table S2 for a summary table of published biomass estimates). Because it was technically impossible to determine red
auto-fluorescence of Prost with required precision, red
autofluorescence of Prounst (upper estimates,
Supplementary Figures S1b and d) were used for normalisation. Consequently, the derived normalised
values forProshould be treated as conservative lower
estimations. Red autofluorescence-normalised CO2
fixation shows thatProdespite an order of magnitude
lower red autofluorescence thanSyn(Table 2) can fix
up to 4 times more CO2 than other small
phyto-plankton (t-test, Pp0.005, Figures 2a and b) whereas
CO2fixation rates ofSyn and plastidic eukaryotes are
comparable.
Biomass-specific CO2 fixation rates of plastidic
eukaryotes were significantly lower than those of
cyanobacteria (Mann–Whitney, Po0.001) whereas
Syn showed on average 60% higher
biomass-specific CO2 fixation than Pro (t-test, P¼0.04;
Figures 2c and d). Because of the combined effect
of comparatively high CO2 uptake rates and high
abundance,Proled microbial CO2fixation across the
low-latitude Atlantic Ocean (Mann–Whitney,
Pp0.038; Figures 2e and f).
To assess whether cellular CO2 fixation and red
autofluorescence of surfaceProcould be influenced
by a lack of nutrients, additional experiments with added nutrients were performed. Nutrient addition to surface samples in the form of deep water (300 m
depth) had no significant effect on CO2fixation rates
of either Pro or Syn cells (t-test, P40.5, Figure 3)
and did not influence red autofluorescence of Pro
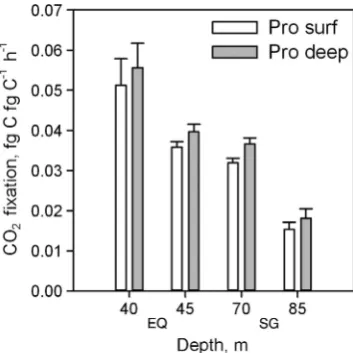
(t-test, P¼0.12). Moreover, comparisons of CO2
fixation rates ofPropopulations from surface waters
and deeper water (bottom of the thermocline)
revealed no significant differences in CO2 fixation
rates when exposed to the same light conditions,
despite stronger red fluorescence of deeperProcells
(Figure 4).
Discussion
Direct determination of group-specific CO2 fixation
rates using14C-tracer is technically challenging and
has been attempted only in three other studies so far
(Chisholm et al., 1988; Li, 1994; Jardillier et al.,
2010) that were spatially restricted to small areas of the Atlantic Ocean. This new data set provides for
the first time insight into CO2fixation rates of four
distinct phytoplankton groups across the Atlantic
Ocean. Cellular CO2fixation rates measured in the
equatorial region are comparable to those measured
in the North East Atlantic (Li, 1994; Jardillieret al.,
2010; Supplementary Table S3). Our slightly lower values can be most likely attributed to the differ-ences in light regime between the studies (artificial vs ambient light). Inferred from estimates of diel synchronised cell division in the photic layer
(Vaulot et al., 1995) and measurements of CO2
fixation by Pro inhabiting the deeper waters
(Chisholm et al., 1988),Pro could contribute more
than a half to the total CO2 fixation in the
low-latitude Ocean. These estimates concur with our results from surface waters (Figures 2e and f).
A combination of high sunlight irradiance (up to
3000mmol photons m2s1;Jitts et al., 1976), slow
rates of vertical mixing, low inorganic nutrient availability and potential preferential grazing
pres-sure by mixotrophic protists (Hartmannet al., 2013)
creates a harsh habitat for Pro cyanobacteria in
surface waters of the low-latitude Atlantic Ocean.
How do Pro cells remain numerous, effective CO2
fixers in these waters (Figure 2) with virtually undetectable red cellular autofluorescence (indica-tive of extremely low photosynthetic pigmentation)? Biosynthesis of photosynthetic pigments like chlorophyll requires certain inorganic nutrients, for example, nitrogen and iron, that are depleted in the subtropical gyres, and constrained nutrient
[image:7.595.128.452.68.227.2]bioavailability can lead to reduced cellular
Figure 1 Assessment ofProchlorococcusabundance (a) and CO2fixation (b) using either pigmentation (Prounst) or DNA content (Prost) to
flow cytometrically separate them from other groups. Different colours indicate sampled regions in the Atlantic Ocean (EQ, equatorial region; NG, Northern Gyre; SG, Southern Gyre; ST, Southern temperate waters). Actual numbers ofProare underestimated using pigmentation alone (a). A significant positive correlation between the two protocols suggests thatProunstis part ofProst(b).
pigmentation (Riemann et al., 1989; Staehr et al.,
2002). However, both plastidic protists and Syn
cyanobacteria can easily be detected in the same waters by their photosynthetic pigmentation, sug-gesting that the required nutrients are still
bioavail-able to those cells. Furthermore, CO2fixation rates of
Proremained unchanged in our deep water addition
experiments to simulate mixing events, suggesting
thatProare not nutrient limited, at least with regard
to CO2 fixation (Figure 3). These findings are in
accordance with a study in the equatorial Pacific
Ocean (Vaulotet al., 1995), where close to maximal
(that is, nutrient unlimited) growth rates ofProwere
estimated. In addition, Pro cells populating the
deeper parts of the mixed layer, where nutrients are still scarce but irradiance is less intense, exhibit stronger red autofluorescence (Zubkov
[image:8.595.111.510.68.572.2]et al., 1998).
Figure 2 Detailed (a,c,e) and average (b,d,f) red autofluorescence-normalised, biomass-specific and population-specific CO2fixation
ofProin comparison withSyncyanobacteria and smaller and larger plastidic eukaryotes (B2mm, Plast-S andB3.1mm, Plast-L) in the Atlantic Ocean (EQ, equatorial region; NG, Northern Gyre; ST, Southern temperate waters; SG, Southern Gyre and). Units on the y-axes are the same for (aandb,canddandeandf). Student’st-test confirmed significant differences in biomass-specific CO2fixation between
all phytoplankton groups (P¼0.001–0.047, see Result section for details).
CO2fixation byProchlorococcus
M Hartmannet al
2286
Perhaps Pro cells produce only low amounts of photosynthetic pigmentation in order to achieve
efficient CO2 fixation with minimal effort using
light energy for photosynthesis as well as for photoheterotrophy, that is, redirecting a part of the collected light energy for actively importing
organic molecules (Casey et al., 2009; Zubkov,
2009). This would allow them to compete with
Syn cells that spend considerable energy on the
production of photoprotective pigments (Raven, 1991; Ara´oz and Ha¨der, 1999). Molecular studies of
culturedSynandProshowed that theProresponse
to photo-damage is modelled to minimise energy demand, for example, during high irradiance periods of the day the main metabolic processes
are downregulated (Mella-Flores et al., 2012).
Lower biomass-specific CO2 fixation rates of Pro
in comparison with Syn (Figures 2c and d) are,
perhaps, a price worth paying to avoid constant
repair of photo-damaged reaction centres in highly irradiated surface waters. That might be a reason (additional to inorganic nutrient limitation (Tarran
et al., 1999; Vaulotet al., 1996)) for low
concentra-tions of Syn cells in oligotrophic waters despite
their higher biomass-specific CO2fixation rates. On
the other hand, the difference in biomass-specific
CO2fixation rates betweenProandSynis
compara-tively small given the higher pigment content, up to
10 times at 1000mmol m2s1 light in cultures
(Mooreet al., 1995) and according to red
autofluor-escence (Figures 2a and b) of the latter.
High red autofluorescence-normalised CO2
fixa-tion by Prois likely related to the high geometrical
absorption cross-section owing to their small cell
size (Morel et al., 1993; Bailey et al., 2005) and
package effect that states that the light-harvesting to the effect of increased pigmentation is reduced because of a parallel decrease in the absorption
cross-section (Dubinsky et al., 1986; Berner et al.,
1989). Light harvesting efficiency of Pro is further
increased by the unique pigment, chlorophyll a2
(Chisholm et al., 1988; Goericke and Repeta, 1992)
with absorption maximum that coincides with the wavelength of higher energy blue light. The cumu-lative outcome of these numerous adaptations has
enabled Pro cells with minimal photosynthetic
pigmentation to become highly efficient CO2 fixers
(Figure 2).
Conclusion
The results presented here demonstrate thatProare
highly efficient CO2 fixers in surface waters of the
Atlantic Ocean and their red
autofluorescence-normalised CO2fixation rates are higher than those
of Syn and small plastidic protists. These findings
indicate that Pro should be specially taken into
account when photosynthetic pigmentation data are
used for deducing biological CO2 fixation in the
oligotrophic open ocean.
Conflict of Interest
The authors declare no conflict of interest.
Acknowledgements
[image:9.595.43.277.64.229.2]We thank the chief scientist Andy Rees, Glen Tarran and fellow scientists as well as the captain and the crew on board the UK RRS James Cook for their help and support during the AMT-20 cruise in 2010. We also thank Rob Thomas from BODC for his help with ancillary data acquisition. This study was supported by the European Commission Seventh Framework Programme through the GreenSeas Collaborative Project (FP7-ENV-2010 Contract 265294) and by the UK Natural Environment Research Council through Research Grants NE/E016138/1 and NE/G005125/1. This is Atlantic Meridional Transect Publication no. 246.
Figure 4 Average biomass-normalised CO2 fixation ofProcells
[image:9.595.71.248.286.463.2]in surface waters (that is, 20 m depth, white) and deeper water layers (grey) in the Equatorial region (EQ) and the Southern gyre (SG). Numbers on x-axis indicate depth of the deep water sample. Figure 3 Average per cell CO2fixation of surfacePro(empty) and Syn (pattern) without (white) and with addition of nutrients (grey, that is, addition of sea water from 300 m depth). NG, Northern Gyre; SG, Southern Gyre.
References
Amann RI, Binder BJ, Olson RJ, Chisholm SW,
Devereux R, Stahl DA. (1990). Combination of 16S rRNA-targeted oligonucleotide probes with flow cyto-metry for analyzing mixed microbial populations.
Appl Environ Microbiol56: 1919–1925.
Ara´oz R, Ha¨der D-P. (1999). Phycoerythrin synthesis is
induced by solar UV-B in the cyanobacteriumNostoc.
Plant Physiol Biochem37: 223–229.
Bailey S, Mann NH, Robinson C, Scanlan DJ. (2005). The occurrence of rapidly reversible non-photochemical
quenching of chlorophyllafluorescence in
cyanobac-teria.FEBS Lett579: 275–280.
Behrenfeld MJ, Randerson JT, McClain CR, Feldman GC,
Los SO, Tucker CJ et al. (2001). Biospheric primary
production during an ENSO transition. Science 291:
2594–2597.
Berner T, Dubinsky Z, Wyman K, Falkowski PG. (1989).
Photoadaptation and the package effect inDunaliella
tertiolecta(Chlorophyceae).J Phycol25: 70–78. Bouman HA, Ulloa O, Scanlan DJ, Zwirglmaier K,
Li WKW, Platt Tet al.(2006). Oceanographic basis of
the global surface distribution of Prochlorococcus
ecotypes.Science312: 918–921.
Campbell L, Vaulot D. (1993). Photosynthetic picoplankton community structure in the subtropical North Pacific
Ocean near Hawaii (station ALOHA). Deep-Sea Res
Oceanogr A40: 2043–2060.
Casey JR, Lomas MW, Michelou VK, Dyhrman ST,
Orchard ED, Ammerman JWet al.(2009).
Phytoplank-ton taxon-specific orthophosphate (Pi) and ATP utilization in the western subtropical North Atlantic.
Aquat Microb Ecol58: 31–44.
Cavender-Bares KK, Frankel SL, Chisholm SW. (1998). A dual sheath flow cytometer for shipboard analyses of phytoplankton communities from the oligotrophic
oceans.Limnol Oceanogr43: 1383–1388.
Cavender-Bares KK, Mann EL, Chisholm SW, Ondrusek ME, Bidigare RR. (1999). Differential response of equatorial Pacific phytoplankton to iron fertilization.
Limnol Oceanogr44: 237–246.
Charles F, Lantoine F, Brugel S, Chre´tiennot-Dinet M-J, Quiroga I, Rivie`re B. (2005). Seasonal survey of the phytoplankton biomass, composition and production in a littoral NW Mediterranean site, with special
emphasis on the picoplanktonic contribution.Estuar
Coast Shelf Sci65: 199–212.
Chisholm SW, Olson RJ, Zettler ER, Goericke R, Waterbury JB, Welschmeyer NA. (1988). A novel free-living
prochlor-ophyte abundant in the oceanic euphotic zone.Nature
334: 340–343.
Daims H, Bru¨hl A, Amann R, Schleifer KH, Wagner M. (1999). The domain-specific probe EUB338 is insuffi-cient for the detection of all Bacteria: development and evaluation of a more comprehensive probe set.
Syst Appl Microbiol22: 434–444.
Dubinsky Z, Falkowski PG, Wyman K. (1986). Light
harvesting and utilization by phytoplankton. Plant
Cell Physiol27: 1335–1349.
Dusenberry JA, Frankel SL. (1994). Increasing the sensi-tivity of a FACScan flow cytometer to study oceanic
picoplankton.Limnol Oceanogr39: 206–209.
Dusenberry JA, Olson RJ, Chisholm SW. (2001).
Photoacclimation kinetics of single-cell fluorescence
in laboratory and field populations ofProchlorococcus.
Deep Sea Res I Oceanogr Res Pap)48: 1443–1458.
Falkowski P. (2012). The power of plankton.Nature483:
S17–S20.
Falkowski PG, Barber RT, Smetacek VV. (1998). Biogeo-chemical Controls and Feedbacks on Ocean Primary
Production.Science281: 200–207.
Field CB, Behrenfeld MJ, Randerson JT, Falkowski P.
(1998). Primary production of the biosphere:
integrating terrestrial and oceanic components.
Science281: 237–240.
Goericke R, Repeta DJ. (1992). The pigments of
Prochlor-ococcus marinus - The presence of divinyl
chloro-phyll-a and chlorophyll-b in a marine prokaryote.
Limnol Oceanogr37: 425–433.
Gomez-Pereira PR, Hartmann M, Grob C, Tarran GA,
Martin AP, Fuchs BMet al.(2013). Comparable light
stimulation of organic nutrient uptake by SAR11 and
Prochlorococcus in the North Atlantic subtropical
gyre.ISME J7: 603–614.
Harris C, Woodward EMS. (2014). AMT20 (JC053) micro-molar nutrient measurements from CTD bottle samples. British Oceanographic Data Centre - Natural
Environment Research Council, UK; doi:10.5285/
f3c482e3-245e-36a5-e044-000b5de50f38; in production. Hartmann M, Grob C, Tarran GA, Martin AP, Burkill PH,
Scanlan DJet al.(2012). Mixotrophic basis of Atlantic
oligotrophic ecosystems.Proc Natl Acad Sci USA109:
5756–5760.
Hartmann M, Zubkov MV, Scanlan DJ, Lepe`re C. (2013).
In situ interactions between photosynthetic
picoeukaryotes and bacterioplankton in the Atlantic
Ocean: evidence for mixotrophy. Environ Microbiol
Rep5: 835–840.
Heldal M, Scanlan DJ, Norland S, Thingstad F, Mann NH. (2003). Elemental composition of single cells of
various strains of marine Prochlorococcus and
Synechococcus using X-ray microanalysis. Limnol Oceanogr48: 1732–1743.
Jardillier L, Zubkov MV, Pearman J, Scanlan DJ. (2010).
Significant CO2fixation by small prymnesiophytes in
the subtropical and tropical northeast Atlantic Ocean.
ISME J4: 1180–1192.
Jitts HR, Morel A, Saijo Y. (1976). Relation of oceanic
primary production to available photosynthetic
irradiance.Aust J Mar Freshw Res27: 441–454.
Li WKW. (1994). Primary production of prochlorophytes, cyanobacteria, and eukaryotic ultraphytoplankton
- measurements from flow cytometric sorting.Limnol
Oceanogr39: 169–175.
Malmstrom RR, Coe A, Kettler GC, Martiny AC,
Frias-Lopez J, Zinser ER et al. (2010). Temporal
dynamics ofProchlorococcusecotypes in the Atlantic
and Pacific oceans.ISME J4: 1252–1264.
Marie D, Partensky F, Jacquet S, Vaulot D. (1997). Enumeration and cell cycle analysis of natural populations of marine picoplankton by flow cytometry
using the nucleic acid stain SYBR Green I. Appl
Environ Microbiol63: 186–193.
Mary I, Tarran GA, Warwick PE, Terry MJ, Scanlan DJ,
Burkill PHet al. (2008). Light enhanced amino acid
uptake by dominant bacterioplankton groups in
surface waters of the Atlantic Ocean.FEMS Microbiol
Ecol63: 36–45.
Mella-Flores D, Six C, Ratin M, Partensky F, Boutte C,
Le Corguille´ G et al. (2012). Prochlorococcus and
Synechococcus have evolved different adaptive
mechanisms to cope with light and UV stress.Front
Microbiol3: 285.
CO2fixation byProchlorococcus
M Hartmannet al
2288
Moore LR, Goericke R, Chisholm SW. (1995). Comparative
physiology of Synechococcus and Prochlorococcus
- Influence of light and temperature on growth, pigments, fluorescence and absorptive properties.
Mar Ecol Prog Ser116: 259–275.
Morel A, Ahn YH, Partensky F, Vaulot D, Claustre H.
(1993). Prochlorococcus and Synechococcus - A
comparative study of their optical properties in
relation to their size and pigmentation.J Mar Res 51:
617–649.
Morel A, Antoine D, Babin M, Dandonneau Y. (1996). Measured and modeled primary production in the northeast Atlantic (EUMELI JGOFS program): the
impact of natural variations in photosynthetic
parameters on model predictive skill. Deep Sea Res I
Oceanogr Res Pap43: 1273–1304.
Olson RJ, Chisholm SW, Zettler ER, Altabet MA,
Dusenberry JA. (1990). Spatial and temporal
distributions of prochlorophyte picoplankton in the
North Atlantic Ocean. Deep Sea Res I Oceanogr Res
Pap37: 1033–1051.
Olson RJ, Zettler ER, DuRand MD. (1993). Phytoplankton analysis using flow cytometry. In: Kemp PF, Sherr BF,
Sherr EB, Cole JJ (eds). Handbook of Methods in
Aquatic Microbial Ecology. Lewis Publishers: Boca Raton, FL, pp 175–186.
Parsons TR, Maita Y, Lalli CM. (1984). A Manual
of Chemical and Biological Methods for Seawater Analysis. Pergamon Press: New York.
Partensky F, Blanchot J, Lantoine F, Neveux J, Marie D. (1996). Vertical structure of picophytoplankton at different trophic sites of the tropical northeastern
Atlantic Ocean.Deep Sea Res I Oceanogr Res Pap43:
1191–1213.
Partensky F, Hess WR, Vaulot D. (1999).Prochlorococcus,
a marine photosynthetic prokaryote of global
signifi-cance.Microbiol Mol Biol Rev63: 106–127.
Quast C, Pruesse E, Yilmaz P, Gerken J, Schweer T, Yarza P
et al.(2013). The SILVA ribosomal RNA gene database project: improved data processing and web-based
tools.Nucleic Acids Res41: D590–D596.
Raven JA. (1991). Responses of aquatic photosynthetic
organisms to increased solar UV-B. J Photochem
Photobiol B Biol9: 239–244.
Riemann B, Simonsen P, Stensgaard L. (1989). The carbon and chlorophyll content of phytoplankton from
var-ious nutrient regimes.J Plankton Res11: 1037–1045.
Sosik HM, Chisholm SW, Olson RJ. (1989). Chlorophyll fluorescence from single cells - interpretation of
flow cytometric signals. Limnol Oceanogr 34:
1749–1761.
Staehr PA, Henriksen P, Markager S. (2002). Photoaccli-mation of four marine phytoplankton species to
irradiance and nutrient availability. Mar Ecol Prog
Ser238: 47–59.
Tarran GA, Burkill PH, Edwards ES, Woodward EMS. (1999). Phytoplankton community structure in the Arabian Sea during and after the SW monsoon, 1994.
Deep Sea Research Part II: Topical Studies in Oceanography46: 655–676.
Ting CS, Rocap G, King J, Chisholm SW. (2002). Cyano-bacterial photosynthesis in the oceans: the origins and significance of divergent light-harvesting strategies.
Trends Microbiol10: 134–142.
Vaulot D, Lebot N, Marie D, Fukai E. (1996). Effect of
phosphorus on the Synechococcus cell cycle in
surface Mediterranean waters during summer. Appl
Environ Microbiol62: 2527–2533.
Vaulot D, Marie D, Olson RJ, Chisholm SW. (1995). Growth of Prochlorococcus, a photosynthetic prokaryote,
in the equatorial Pacific Ocean. Science 268:
1480–1482.
Vaulot D, Partensky F, Neveux J, Mantoura RFC, Llewellyn CA. (1990). Winter presence of prochlor-ophytes in surface waters of the northwestern
Mediterranean Sea.Limnol Oceanogr35: 1156–1164.
Veldhuis MJW, Kraay GW. (2004). Phytoplankton in the subtropical Atlantic Ocean: towards a better
assessment of biomass and composition. Deep Sea
Res I Oceanogr Res Pap51: 507–530.
Waterbury JB, Watson SW, Valois FW, Franks DG. (1986). Biological and ecological characterization of the
marine unicellular cyanobacterium Synechococcus.
In: Platt T, Li W (eds). Photosynthetic Picoplankton.
Can Bull Fish Aquat Sci214: 71–120.
West NJ, Schonhuber WA, Fuller NJ, Amann RI, Rippka R,
Post AFet al.(2001). Closely relatedProchlorococcus
genotypes show remarkably different depth
distributions in two oceanic regions as revealed by in situ hybridization using 16S rRNA-targeted
oligonucleotides.Microbiology147: 1731–1744.
Zubkov MV. (2009). Photoheterotrophy in marine
prokaryotes.J Plankton Res31: 933–938.
Zubkov MV, Burkill PH. (2006). Syringe pumped high speed flow cytometry of oceanic phytoplankton.
Cytometry A69A: 1010–1019.
Zubkov MV, Mary I, Woodward EMS, Warwick PE, Fuchs BM,
Scanlan DJ et al. (2007). Microbial control of
phosphate in the nutrient-depleted North Atlantic
subtropical gyre.Environ Microbiol9: 2079–2089.
Zubkov MV, Sleigh MA, Burkill PH, Leakey RJG. (2000). Picoplankton community structure on the Atlantic Meridional Transect: a comparison between seasons.
Prog Oceanogr45: 369–386.
Zubkov MV, Sleigh MA, Tarran GA, Burkill PH, Leakey RJG. (1998). Picoplanktonic community
struc-ture on an Atlantic transect from 501N to 501S.Deep
Sea Res I Oceanogr Res Pap45: 1339–1355.
This work is licensed under a Creative
Commons Attribution 3.0 Unported
License. The images or other third party material in this article are included in the article’s Creative Commons license, unless indicated otherwise in the credit line; if the material is not included under the Creative Commons license, users will need to obtain permission from the license holder to reproduce the material. To view a copy of this license, visit http:// creativecommons.org/licenses/by/3.0/
Supplementary Information accompanies this paper on The ISME Journal website (http://www.nature.com/ismej)