A Thesis Submitted for the Degree of PhD at the University of Warwick
Permanent WRAP URL:
http://wrap.warwick.ac.uk/87332
Copyright and reuse:
This thesis is made available online and is protected by original copyright.
Please scroll down to view the document itself.
Please refer to the repository record for this item for information to help you to cite it.
Our policy information is available from the repository home page.
Form-finding of Arch Structures
By
Asal Pournaghshband
A thesis submitted in partial fulfilment of the requirements for the
degree of
Doctor of Philosophy in Engineering
University of Warwick, School of Engineering
List of Figures ... vi
List of Tables ... x
Acknowledgements ... xiv
Declaration ... xv
Abstract ... xvi
Symbols ... xvii
Abbreviations ... xx
Chapter 1 : Introduction ... 1
1.1. Framework and Motivation... 1
1.2. Research aims and objectives ... 4
1.3. Structure of the thesis ... 6
Chapter 2 : Literature review ... 8
2.1. Introduction ... 8
2.2. History of arches ... 9
2.3. Study of the behaviour of arches ... 10
2.4. Study of the analysis methods of arches ... 14
2.5. Optimization and form-finding survey ... 35
2.6. Concluding remarks ... 54
Chapter 3 : Analysis of two-pin arches ... 57
3.1. Introduction ... 57
3.2.1.1. Circular form equation ... 58
3.2.1.2. Parabolic form equation ... 59
3.2.1.3. Catenary form equation... 60
3.3. Project description ... 61
3.3.1. Arch specifications ... 61
3.3.2 Load cases ... 62
3.3.3. Assessment of arch stability over considered L:h ratios ... 65
3.4. Assessment criterion ... 68
3.5. Methodology ... 69
3.5.1. Bending moments ... 70
3.5.2. Combined stresses ... 78
3.5.3. Compressive force (thrust) ... 80
3.5.4. Displacements and deflections... 81
3.5.5. Shear forces ... 84
3.5.6. Horizontal reaction force ... 85
3.5.7. Arch mass ... 86
3.6. Arches of steel material ... 87
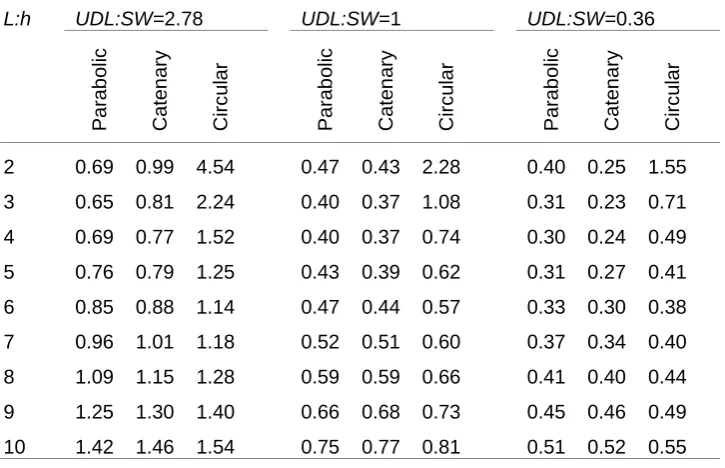
3.7. Exploring the effect of different ratios of UDL:SW ... 88
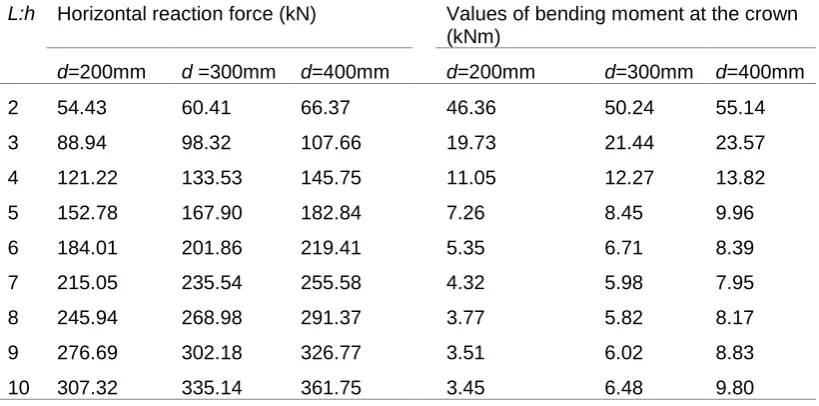
3.8. Exploring the effect of arch thickness ... 92
3.9. Exploring the effect of shortening of the arch ... 95
3.10. Concluding Remarks ... 100
Chapter 4 : Comparison of different methods of two-pin arch analysis ... 102
4.1. Introduction ... 102
4.2. Theoretical analysis method ... 103
4.3. Approximate analytical methods ... 105
4.3.1. Masonry design method ... 105
4.3.2. Virtual work method presented by Megson ... 107
4.4. Comparison of different methods of analysis ... 110
4.5. Exploring the thickness effect on horizontal reaction force using the Castigliano approach... 123
4.6. Exploring the shortening effect ... 131
4.6.1. Shortening effect of flat arches... 132
4.7. Concluding Remarks ... 135
Chapter 5 : Analytical form-finding of two-pin arch ... 137
5.1. Introduction ... 137
5.2. Optimality criterion of two-pin arches ... 139
5.3. Equilibrium of any point on the arch... 140
5.4. Geometry of the momentless arch ... 145
5.4.1. Finding the ‘x’ coordinate of the momentless arch ... 145
5.4.2. Finding the ‘y’ coordinate of the momentless arch ... 147
5.4.3. Finding the shape of momentless arch ... 147
5.4.6. Determination of horizontal reaction force ... 151
5.5. Comparing the geometry of the momentless arch with known shapes of arches ... 151
5.6. Case study ... 155
5.6.1. Calculating the weight of the arch rib ... 157
5.6.2. Calculating the weight of the vertical members (piers) ... 157
5.6.3. Calculating the weight of the deck (superimposed dead load) ... 161
5.6.4. Calculating the traffic load ... 161
5.6.5. Arch model... 162
5.6.6. Calculating the required reinforcement ... 165
5.6.7. Comparing the deflections of parabolic and momentless arches ... 168
5.6.8. Comparing the first failure of the cross-sections of the parabolic and momentless arches ... 171
5.7. Concluding Remarks ... 174
Chapter 6 : Discussion and Conclusions ... 176
6.1. Discussion of the general behaviour of the two-pin arch ... 176
6.2. Discussion of the comparison of different methods of analysis ... 180
6.3. Discussion of the optimal shape of two-pin arch ... 182
6.4. Conclusions ... 184
6.5. Recommendations for future work ... 186
6.5.1. Further work on form-finding of arch structures ... 186
Glossary ... 189
References ... 192 Appendix A: Theoretical analysis of a two-pin circular arch using Castigliano’s approach ... 199 Appendix B: Theoretical analysis of a two-pin parabolic arch using Castigliano’s approach ... 215
Figure 2.1. The Aqueduct of Segovia, Spain (http://whc.unesco.org/en/list/311) ... 9
Figure 2.2. Antonio Gaudi’s hanging model (http://memetician.livejournal.com) ... 36
Figure 3.1. Optimal arch shape according to different loading patterns (Proske and Pieter 2009) ... 58 Figure 3.2. Circular (a), parabolic (b) and catenary (c) arch shapes ... 58
Figure 3.3. Collapsed section of tunnel at Gerrards Cross (LHS) (NCE 2005) – FE: Displacement of circular arch when subjected to a UDL +SW (RHS) ... 62 Figure 3.4. FE: The load pattern of 20 kN/m UDL applied across the half span of the arch plus SW ... 63 Figure 3.5. FE: The load pattern of 20 kN/m UDL applied across the central 40% of the arch plus SW ... 64 Figure 3.6.FE: The load pattern of 20 kN/m UDL applied across the full span of the arch plus SW ... 64 Figure 3.7. Visual representation of load patterns ... 65
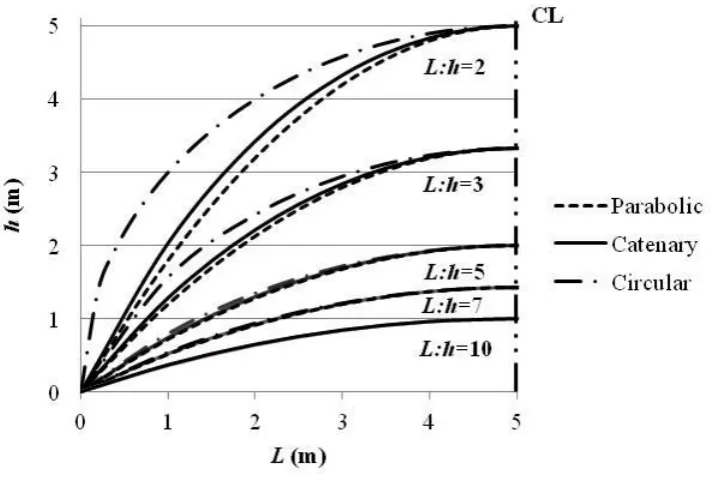
Figure 3.8. Geometric differences between arches for L:h ratios of 2, 3, 5, 7 and 10 ... 66 Figure 3.9. FE: Sensitivity analysis on circular arch with L:h of 2 ... 70
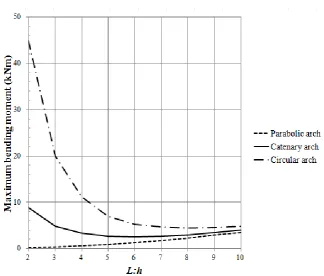
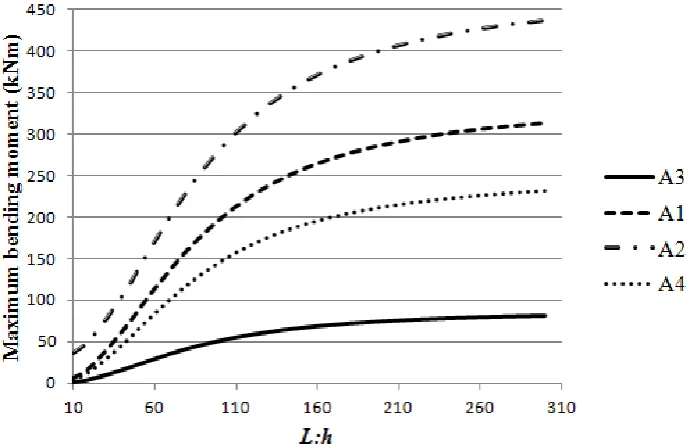
load case A2 ... 75 Figure 3.13. FE: The absolute value of maximum bending moment against L:h ratio for load case A3 (SW only) ... 76 Figure 3.14. FE: The absolute value of maximum bending moment against L:h ratio for load case A4 (UDL only) ... 76 Figure 3.15. FE: The value of maximum bending moments against L:h ratio between 10 and 300 for all load cases ... 78
Figure 3.16. FE: Maximum resultant displacements against L:h ratio, load case A1
... 82
Figure 3.17. FE: Maximum resultant displacements against L:h ratio, load case A2
... 82
Figure 3.18. FE: Deformed shapes of circular, parabolic, and catenary arches for load case A1 and L:h of 2, 4, and 6 ... 83 Figure 3.19. FE: Deformed shape of parabolic arch for load case A2 and L:h = 4 .. 84
Figure 3.20. FE: Absolute value of maximum shear force against L:h ratio for load cases A1 and A2... 84 Figure 3.21. FE: The horizontal reaction force against L:h ratio for load case A1 ... 86
Figure 3.22. FE: Arch mass against L:h ratio for each form ... 86
Figure 3.23. FE: The absolute value of the maximum combined stresses against L:h
ratio using concrete material for load case A1 ... 87 Figure 3.24. FE: The absolute value of the maximum combined stresses against L:h
ratio using steel material for load case A1... 88
Figure 3.27. Comparison of the horizontal reaction forces using different methods 98
Figure 4.1. Masonry design method (arch is divided into several segments) ... 106
Figure 4.2. Application of the virtual work method (using a unit load) to the two-pin arch ... 107 Figure 4.3. Elemental length, δs, split into x and y components δx and δy ... 109
Figure 4.4. The UDL:SW ratio against L:h ratio for different rib thicknesses of a parabolic arch subjected to 20 kN/m UDL only ... 130 Figure 4.5. Effect of rib shortening to calculate the horizontal reaction force of a two-pin circular arch based on Castigliano’s theory for load case A1 ... 134
Figure 5.1. The two-pin arch specification ... 141
Figure 5.2. Sign convention of the forces acting on the infinitesimal piece of the arch ... 141 Figure 5.3. Trigonometry of the arch slope... 142
Figure 5.4. The forces acting on the arch segment AP ... 142
Figure 5.5. Geometry differences between momentless arch and known shapes of arches for L:h ratios of 2, 3, and 5 when UDL:SW > 1 ... 152
Figure 5.6. Geometry differences between momentless arch and known shapes of arches for UDL:SW = 1 and UDL:SW < 1 when L:h = 2 ... 153
Figure 5.7. Diagram of forces in optimal arch shape subjected to UDL plus SW
(Salonga 2010) ... 154 Figure 5.8. Shape of the studied arch bridge ... 156
point loads from piers ... 160
Figure 5.11. SAP2000: Bending moment of parabolic arch subjected to SW plus
UDL of 264 kN/m ... 161
Figure 5.12. SAP2000: Deformed shape of parabolic arch subjected to UDL of 507 kN/m plus SW of 110.1 kN/m ... 168
Figure 5.13. SAP2000: Deformed shape of momentless arch subjected to UDL of 507 kN/m plus SW of 110.1 kN/m ... 169 Figure 5.14. Comparison of the interaction curve of the parabolic arch cross-section and diagram of the axial force and bending moment results from OpenSees when the vertical displacement at the arch crown is 3950 mm ... 173
Figure 5.15. Comparison of the interaction curve of the momentless arch cross-section and diagram of axial force and bending moment results from OpenSees
when the vertical displacement at the arch crown is 5200 mm ... 173
Figure A. 1. The two-pin circular arch specification ... 199
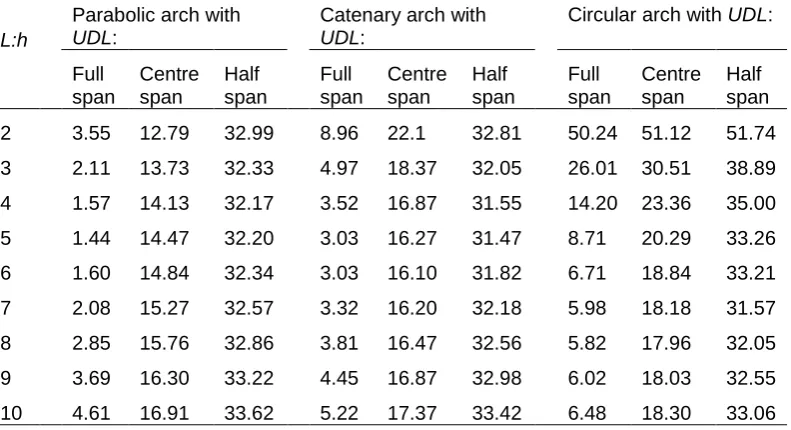
Table 3.1. The value of maximum bending moment (kNm) caused by SW plus differently positioned UDL of 20 kN/m applied on different arch shapes ... 64 Table 3.2. Maximum percentage difference between the y coordinates of each pair of arch shapes ... 66 Table 3.3. The critical values of the intensity of the load for the parabolic arch under
UDL only applied across the span of the arch (Timoshenko and Gere 1961) ... 67
Table 3.4. Maximum sagging bending moments (kNm), their locations along the span (m) and UDL:SW of the parabolic, catenary, and circular arches, load case A1
... 71 Table 3.5. Maximum hogging bending moments (kNm) and their locations along the span (m) of the parabolic, catenary, and circular arches, load case A1 ... 72 Table 3.6. Maximum sagging bending moments (kNm) and their locations along the span (m) of the parabolic, catenary, and circular arches for load case A2 ... 74 Table 3.7. Maximum hogging bending moments (kNm) and their locations along the span (m) of the parabolic, catenary, and circular arches for load case A2 ... 74
Table 3.8. Maximum combined stresses (MPa) and their locations along the span (m) of the parabolic, catenary, and circular arches for load case A1 ... 79
Table 3.9. Maximum combined stresses (MPa) and their locations along the span (m) of the parabolic, catenary, and circular arches for load case A2 ... 79
arches subjected to the general combination of SW plus UDL for different UDL:SW
ratios ... 89 Table 3.13. Maximum displacement (mm) of parabolic, catenary, and circular arches subjected to the general combination of SW plus UDL for different UDL:SW ratios 90
Table 3.14. Maximum combined stress (MPa) of parabolic, catenary, and circular arches subjected to the combination of SW plus UDL for different UDL:SW ratios . 91 Table 3.15. Horizontal reaction force and bending moment at the crown of parabolic arch for load case A1 ... 93 Table 3.16. Horizontal reaction force and bending moment at the crown of circular arch for load case A1 ... 93 Table 3.17. Horizontal reaction force (kN) of parabolic arch subjected to UDL only 96
Table 3.18. Horizontal reaction force (kN) of parabolic arch subjected to UDL only 98
Table 3.19. Percentage difference between arch length (S) and horizontal distance between the supports (L) of known shape of arches ... 100 Table 4.1. Horizontal reaction force of circular arch (kN) subjected to the UDL of 20 kN/m plus SW (A1) ... 111 Table 4.2. Maximum bending moments (M) and their locations along the span (x) of circular arch subjected to the UDL of 20 kN/m plus SW (A1) ... 111
Table 4.3. Maximum thrust (kN) of circular arch subjected to the UDL of 20 kN/m plus SW (A1) ... 112
Table 4.4. Maximum combined compressive stresses of circular arch (σ) and their locations along the span of the arch (x) subjected to the UDL of 20 kN/m plus SW
20 kN/m plus SW (A1) ... 114 Table 4.6. Maximum bending moments (M) and their location along the span (x) of parabolic arch subjected to the UDL of 20 kN/m plus SW (A1) ... 115 Table 4.7. Maximum thrust (kN) of parabolic arch subjected to the UDL of 20 kN/m plus SW (A1) ... 115 Table 4.8. Maximum combined compressive stresses of parabolic arch (σ) and their location along the span of the arch (x) subjected to the UDL of 20 kN/m plus SW 116 Table 4.9. Horizontal reaction force of parabolic arch (kN) subjected to the UDL of 20 kN/m only ... 120
Table 4.10. Maximum bending moment in parabolic arch (kNm) subjected to the
UDL of 20 kN/m only ... 121 Table 4.11. Horizontal reaction force (kN) of circular arch with different thicknesses (mm) using Castigliano approach with different categories (A1) ... 123
Table 4.12. Horizontal reaction force (kN) of parabolic arch with different thicknesses (mm) using Castigliano approach with different categories (A1) ... 124
Table 4.13. Bending moment at the crown (kNm) of circular arch with different thicknesses (mm) using Castigliano approach with different categories (A1) ... 124
Table 4.14. Bending moment at the crown (kNm) of parabolic arch with different thicknesses (mm) using Castigliano approach with different categories (A1) ... 125 Table 4.15. Horizontal reaction force (kN) of circular arch with different thicknesses (mm) using Castigliano approach with different categories(A4) ... 127
thicknesses (mm) using Castigliano approach with different categories (A4) ... 128
Table 4.18. Bending moment at the crown (kNm) of parabolic arch with different thicknesses (mm) using Castigliano approach with different categories (A4) ... 128 Table 4.19. Horizontal reaction force of parabolic arch (kN) subjected to the UDL of 20 kN/m plus SW (A1) using different methods of analysis ... 132
Table 5.1. Maximum/minimum bending moments in parabolic arch when modelled in SAP2000 using different numbers of nodes ... 163 Table 5.2. Coordinates of parabolic and momentless arch for the half span ... 164
Table 5.3. Maximum bending moments of both arches obtained from SAP2000 . 166
Table 5.4. Maximum displacements of momentless arch obtained from SAP2000
using different arch thicknesses (d) ... 170
Table A. 1. Horizontal reaction force of circular arch (N) subjected to load case A1
... 214
Table B. 1. Horizontal reaction force of parabolic arch (kN) subjected to load case
Acknowledgements
Special thanks should be given to my supervisor Dr Theodore L. Karavasilis for his support, guidance and encouragement. Dr Karavasilis supervised this work for the last six months and helped me writing and organising my thesis. A thank goes to my colleague Amin Najafi back in Iran for his assistance and long discussion on the analytical model. I would also like to thank Dr Fabio Freddi for his assistance in numerical part using OpenSees software. A thank should be given to Professor Roger Johnson in Civil Engineering department for taking his time and share his opinion with me. Many thanks to the staff of School of Engineering for their feedbacks and supports, I am extremely grateful.
Declaration
Abstract
Symbols
A Area of Arch Cross-section
a and b
and c
Constants in arch Equations Found Using Boundary Conditions
A’ and Acat Catenary Arch Constant
a’ Flexibility Coefficient of the Arch
Ai Load Case Indicator
ba Wide of Arch Cross-section C Indicate Concrete Material
Ci Integral Constant
D Denominator
d Arch Thicknesses
da Effective Depth of the Arch Cross-section ds Infinitesimal Piece of Arch length
E Young’s Modulus
{f} Load or Force Vector
F Shear Force
f(x) Arch Function
f’c Concrete Compressive Strength
fcd Concrete Design Stress in Compression Fx Horizontal Force
Fy Vertical Force fyk Steel Strength
g Radius of Gyration of the Arch Cross-section
G Shear Modulus
h Arch Height
H Horizontal Reaction Force
I Second Moment of Area
I0 Second Moment of Area at the Arch Crown k Shear Reduction Factor
[K] Stiffness Matrix of the Arch
L Arch Span
l Horizontal Distance between Arch Support and Arch Crown
m Midpoint of the Arch
Md Design Bending Moment Mrd Ultimate Bending Moment
n Number
N Numerator
P Arbitrary Point along the Arch
q Self-weight of Arch per unit Arc Length
qk Uniformly Distributed Load from Traffic Load r Span-to-height Ratio
R Radius of Curvature of the arch Structure S Indicate Steel Material
S Arch Length
S’ Length of the Parabolic Arch
t Derivative of Arch Function
T Thrust
u Displacement
U Strain Energy
V Vertical Reaction Force
w Deck Weight per unit Span
wcr Critical Value of the Intensity of Loading We External Virtual Work
Wi Internal Virtual Work Wi Point Loads from UDL +SW
X Location of Maximum Structural Response along Arch Span
x and y Arch Coordinates
z Lever Arm for Flexure
z’ Distance of the Surface from Neutral Axis
α Arch Slope at any Point along the Arch
αq Adjustment Factor for Traffic Load
β Angle
γ Slope of Arch at the Support
γ2 Numerical Factor Depends on the L:h Ratio
γc Concrete Partial Factor of Safety
Δ,h, Horizontal Displacement at Arch Support
δs Elemental Length of the Arch
η and ζ Horizontal Distance of Elemental arch length ds from Arch Support
υ’ Rib shortening Coefficient in Gaylord Equation
σ Maximum Combined Compressive Stresses
Abbreviations
2D Two-dimensional
3D Three-dimensional
ADS Advanced Design System
AMPL A Mathematical Programming Language
DDA Discontinuous Deformation Analysis
DEM Discrete Element Method
FDM Force Density Method
FE Finite Element
GA Genetic Algorithm
LM Load Model
LP Linear Programming
MEXE Military Engineering Experimental Establishment
NCE New Civil Engineer
NFDM Natural Force Density Method
SW Self-weight
Tcl Tool Command Language
TNA Thrust Network Analysis
TRRL Transport and Road Research Laboratory
UDL Uniformly Distributed Load
ULS Ultimate Limit State
Chapter 1 : Introduction
The form of arch structures and its effects on structural action is explored in this thesis. This study concerns an analytical determination of an optimal form of arch structures that are momentless, and their application. The methodology will be developed for any span (L) to height (h) ratios (L:h) and three different ratios of uniformly distributed load (UDL) to self-weight (SW). Three categories of loading comprises UDL:SW>1, UDL:SW=1, and UDL:SW<1, in which each category gives one functional relationship for the arch shape. The work is preceded by a comprehensive study of the behaviour of known shapes of arches including catenary, parabolic and circular forms. Also, different methods of analysis were investigated. In this regard, approximate methods of analysis, such as the masonry design (Curtin et al. 2006) and virtual work or energy methods suggested by Megson (Megson 2006) are evaluated by comparing their results with those obtained by the finite element analysis using GSA software (http://www.oasys-software.com/products/engineering/ GSA-suite.html), in addition to an accurate method of analysis that includes full structural action, i.e., strain energy due to bending, shear, thrust and coupling of bending and thrust (Timoshenko 1986).
1.1.
Framework and Motivation
arch structures are widely used in constructing bridges and tunnels. Other than spanning rivers and mountains for a transportation system, arches were used to form the roofs of large buildings, which is considered at the heart of the evolution of the vault.
There are about 75,000 masonry arch bridges in the United Kingdom, most of which are around 100 years old and still in service (Ng 1999). As the transportation system ages, arch structures may not be fit to withstand the speed, dimensions, loads, and volume of modern traffic conditions. Because of the increase in traffic load and speeds, a reliable assessment of the structural response of arch structures is required. In this regard, the behaviour of known shapes of arches are analysed and compared with each other. This comparison confirms the best shape from the known shape of arches based on the applied load. Also, the optimal range of span-to-height ratio for each shape of the arch is proposed in this study. The criterion of choosing the best arch and optimal span-to-height ratio causes the structural action within the arch material to be minimised. Moreover, different methods of analysis are evaluated. As a result, the accuracy of the approximate methods of analysis is explored through comparing with the most accurate method, i.e., the Castigliano approach based on full structural action.
with a constant cross-sectional area ease the complexity of design, but also, the cost of the construction can be reduced. In traditional design, arches were widely constructed as a filled barrel arch using masonry material. This kind of arch with very large self-weight could be counted as a brace that would keep the arch from buckling. The arch can carry the applied load, while the arch rib and the loading are connected through columns. The reason for great stability and durability of most of the historical arches was the large self-weight using masonry material as filled barrel arches that serve to brace it. Therefore, the shape of the arch was not a problem in the ancient design of arches.
Finding a desirable form of arches has recently become a significant issue in designing this classical form of structure. The shape of the arch has a direct effect on the stress that an arch structure will experience under the loading. Also, the cost of construction and the beauty of arches are directly related to their shape. Apart from designing suitable arches of known shapes, finding the optimal arch shape leads to low maintenance cost and favours the construction of new arch structures, both structurally and aesthetically. Since arch forms transfer dead load as compression forces, the optimal shape of the arch is one that can carry the loading in pure compression along the arch axis. However, there is only one optimal arch shape for any specific loading configuration that may be considered a limiting condition. Also, because of the behaviour of arch structures in transferring the loads, arch shapes are well suited to materials with high compressive strength such as masonry and concrete.
different sequence was determined as the cause for this failure. Hence, the failure could have been prevented if the arch had been of a shape less sensitive to disproportionate loading.
In previous practice, arch forms and their three-dimensional (3D) equivalents, i.e., vaults (tunnels), were designed to follow either a parabolic, circular, or catenary shape. None of these shapes represent an optimal form for the real case of self-weight plus uniformly distributed load, or variable, imposed loading. Although it is not possible to optimise the form (shape) for every practical load case, this proposed research will demonstrate that much improved design recommendations and analysis methods can be produced. Consequently, the best form of pin-ended rib concrete arches with constant cross-section in which the arch carries the loading in pure compression is a focus of this study. Hence, the optimal shape of an arch is proposed, using a novel form-finding technique.
1.2.
Research aims and objectives
action effects. The aim can be accomplished by specific set of objectives, listed below.
- To explore the effect of arch form on structural actions and a complete assessment of arch behaviour.
- To compare the behaviour of the known shapes of arches including, parabolic, catenary, and circular arches with each other.
- To find the optimum range of span-to-height ratio of the known shapes of arches in which the stress from the combination of bending stress and axial one reaches its minimum.
- To evaluate approximate methods of analysis of arches by comparing them with the most accurate method of analysis, i.e., the Castigliano approach based on full structural action.
- To find momentless two-pin arches for any span-to-height ratio and any ratios of unifomly distributed load to self-weight.
- To illustrate the application of the momentless arch as the optimal arch shape.
investigated analytically in this research. The advantage of momentless arch is also assessed numerically.
1.3.
Structure of the thesis
This thesis consists of six chapters starting with an introduction chapter and ending with a conclusion chapter. Both the first and last chapters outline the main points covered in other chapters.
In Chapter 2, current knowledge from and literature on common shapes of arches, methods of arch analysis and optimal arch form is reviewed. The form-finding technique is reviewed in this chapter.
Chapter 3 presents a numerical assessment of the known shapes of arches, namely parabolic, circular, and catenary, using GSA finite element software. The studied arches are pin-ended concrete ones with a constant cross-section. The optimum range of span-to-height ratio for each arch is then investigated. Therefore, the best shape amongst the known shapes of arches and optimal L:h ratio are obtained when the combined stress is at a minimum.
Chapter 4 presents a comparison of different methods of analysis for arch structures. These methods are mainly linear elastic ones applied to pin-ended arches to calculate their reaction forces. The methods consist of an accurate analytical method (the Castigliano approach) and approximate methods such as numerical method applying GSA software, the virtual work method described by Megson, and masonry design method. Therefore, the validity of the approximate methods is explored.
Chapter 5 presents the analytical calculation of a momentless arch using equations of equilibrium. The optimal shape of the arch is then achieved for any L:h
arch presented numerically through comparing its deflection and first failure load with the ones of the parabolic arch. Hence, the merit of the momentless arch is confirmed.
Finally, the main conclusions from the conducted study in this research project are reported in chapter 6.
This thesis also includes an Appendix section containing:
- Theoretical analysis of the two-pin circular arch using the Castigliano approach (Appendix A).
- Theoretical analysis of two-pin parabolic arch using the Castigliano approach (Appendix B).
Chapter 2 : Literature review
2.1. Introduction
The aim of this research project is to investigate the optimal shape of arch structures that are momentless, together with their application. This work is carried out via an analytical form-finding technique for arches with any span-to-height ratio (L:h) and any ratio of uniformly distributed load to self-weight (UDL:SW). Investigation of the optimal arch shape is grounded in a comprehensive study of the behaviour of different arch shapes. Hence, the effect of the form and span-to-height ratio of arches on their structural actions is studied in detail. The focus of this study is on two-pin arches with a constant cross-section which are built of masonry or concrete material and subjected to static loading. Furthermore, different methods of arch analysis involving approximate analytical and numerical methods and the accurate analytical method are explored.
2.2. History of arches
The arch is a curved structure with a variety of applications mostly to support or strengthen a building by transmitting compressive forces. Historically, arches have been made of masonry, then concrete, and lately of steel. The Romans can be considered the forerunners in appreciating the benefits of the arch in Europe, possibly building the first in the world (Ambrose and Tripeny 2011). Rounded arches, also called circular arches, are commonly found in ancient buildings. The Roman building constructions relied upon circular arches to span large, open areas. One of the Roman Empire’s most impressive works of engineering is the Aqueduct of Segovia (Figure 2.1). It was built in the first century AC in Spain and comprised 166 semi-circular brick-like stone arches (Ambrose and Tripeny 2011).
Figure 2.1. The Aqueduct of Segovia, Spain (http://whc.unesco.org/en/list/311)
around 1180, the Rhone in Avignon-France about 1180, and the Elbe in Dresden-Germany around 1200 (Proske and Pieter 2009).
Proske and Pieter (2009) stated that the use of circular arches was remarkable during the 14th and 15th centuries in the shape of filled barrel stone arch. In the late 16th century, the arch building industry entered a new stage of development, when new spans exceeded those achieved by the Romans by a large margin. Building arches with large spans was practised using other arch forms, although circular arches were still being widely used. Arches with large spans were found to be feasible when constructed of steel. The development of the knowledge of steel arches began in England during the mid-18th century. The first steel bridge was built at Coalbrookdale Ironbridge in England in 1781. This bridge was made of a semi-circular cast-iron rib with constant rectangular cross-section (published in the State of Maryland website, 2015).
2.3. Study of the behaviour of arches
evaluated. Moreover, it was seen that the buckling load of the arches is affected by the L:h ratios and the arch shape.
Later, Harvey and Smith in 1987 defended semi-circular arches as sound and aesthetic forms, when they are subjected to surcharge due to ground fill exerting horizontal forces. This case is an exception to the general findings, including the results presented in this thesis that confirm a circular arch form to be less efficient than parabolic or catenary shapes. Since finding the origin and direction of the thrust line of arches required difficult calculations for actual loading conditions, a microcomputer programme was developed by Harvey and Smith. The program was based on the mechanism analysis method in which Rankine’s concept of fill pressure was used to design a smooth vertical wall. As an elaborated example, they pointed to the test bridge at Bargower, which performed properly under different fill pressures. Further, their method, based on the thrust line analysis, is analogical to the masonry design method that produces inaccurate results, as discussed in Chapter 4 of this thesis. The authors concluded that an ideal arch shape did not exist, and that an optimal arch form may be found for each specific loading configuration.
arches was concerned. Unfortunately, their assessment was limited to arches with
L:h ratios of 2 and 4, respectively. In order to compare model tests in the study with full-scale bridge tests, Bridgemill and Bargower bridges tested by the University of Edinburgh were used. Therefore, the relationship between the model tests and full-scale bridges was obtained in terms of the collapsed loads, arch densities of the model, arch prototype and the linear dimension scale factor. The model tests demonstrated that by increasing the fill density, the collapse load increased too because of raising the dead weight and the support stiffness.
was about half of the collapse load when the L:h ratio of the arch was 3. This finding shows the sensitivity of the behaviour of the circular arch with a changing L:h ratio. The maximum collapse load was found for a L:h ratio between 4 and 5. Moreover, because of the low level of loading in their tests, which could not exceed the linearity state, they compared their results with those obtained from tests on masonry or concrete arches. The comparison demonstrated a fairly good correlation for the range of span-to-height ratio which has the highest collapse load. In spite of the remarkable findings for the optimal range of span-to-height ratio with the criterion of maximum collapse load, only the arches of circular shapes were analysed.
assumed that the spandrel columns were connected to the arch and deck with pins. Also, it was assumed that the flexural rigidity at the crown of the arch is equal to the flexural rigidity of the arch projected on the horizontal axis. The lowest shallowness ratio to guarantee the effectiveness of the arch was found to be 20. This threshold showed that the fixed-ended arch carried most of the uniform loads in axial compression.
2.4. Study of the analysis methods of arches
The methods of structural analysis have been developing in recent years. Many researchers developed assessment tools based on plastic principles, including Heyman (1966 and 1969), Harvey and Smith (1987-1991), Blasi and Foraboschi (1994), and Gilbert (2007). Other researchers such as Pippard et al. (1936-1968), Crisfield (1984), Bridle and Hughes (1989), and Choo and Coutie (1991) analysed arches based on “elastic” principles. Many of these methods were based on Castigliano’s energy method (1876; 1879). As Harvey et al. (1990) stated the most recognized analysis methods were mainly classified as: MEXE, mechanism and finite element.
The MEXE method was an elastic analysis method, initially introduced by the Military Engineering Experimental Establishment, using a semi-empirical approach based on Castigliano’s theorem and the work carried out by Pippard et al. (1936, 1938, 1951). A formula was developed based on the arch dimensions to estimate the strength of a masonry arch. The arch is required to be parabolic with the L:h
ratio of 4. The method does not fully capture the spandrel fill strength, or arch “thinning”. Moreover, its results were viewed as very conservative and the modification factors mainly affected the results from the method. However, the
method was that the arch material had an infinite compressive strength. As a consequence, the geometrical factor of safety and the thickness of the arch became respectively infinity and zero. These properties were known as the plastic theory hypothesis. The purpose was to obtain a distance between the thrust line and centre-line caused by a travelling load. In this regard, the calculations of simple plastic theory were used with the consideration of the formation of hinges which turned the arch into a mechanism. The calculations resulted in equality of the work done under all loadings on a small motion of the mechanism to the work dissipated in the hinges. He then applied this theory to analyse the stone bridge of Lincoln Cathedral with a constant cross-section and Ponte Mosca, in Turin, with a variable cross-section.
could be considered in the calculations if the initial dead load conditions were known. The loading history of the masonry arch could be estimated with evaluation of the arch geometry and used in the analyses.
thrust line was also related to the minimum energy in the structure. As a practical example, the three-hinge method was applied to the Torksey Bridge in Lincolnshire. The results of the three-hinge method showed that the measured collapse load was in accordance with the one obtained by the full-scale tests by the UK Transport and Road Research Laboratory (TRRL). However, the three-hinge method illustrated the behaviour of the arch before its failure. They also simulated the collapses for Torksey Bridge due to local crushing by expanding the three-hinge method. Moreover, they showed that by decreasing the arch ring thickness, the load that causes a mechanism to be formed would be reduced. As another example, the Preston-upon-the-Weald Moors Bridge, containing hunching above the springing, was simulated using the three-hinge method programme numerical predictions were compared with the test results from TRRL. In this example, a significant horizontal movement was observed when the load was increased, which indicated the action of hunching as an abutment. This caused the height of springing to rise effectively. The fourth hinge could not be formed in this case and the structure would survive until a significantly large load causes a failure through crushing at the hinge. Again, there was a good correlation between the programme and TRRL results. An advantage of the three-hinge method is that it can calculate the position and magnitude of the thrust line on each abutment. It was shown that the ultimate capacity of the arch was greatly influenced by the abutment movements.
analytical method with the results of FE analysis. Furthermore, they stated that the collapse approach was more reliable than FE for complex boundary conditions.
To find the proper material properties for three specific full-scale masonry arch bridges, Fanning and Boothby (2001) analysed the available test results of those in-service arch bridges. To do so, they applied the three-dimensional non-linear FE
Ng and Fairfield (2004) modified the conventional mechanism method using the deflection-dependent pressure updating algorithm. They assessed Bargower stone arch bridge to show the validity of their modification. The reason for this modification was triggered by the significant change in the arch profile at the time of failure. Ng and Fairfield reviewed the previous research carried out to assess masonry arch bridges with the soil material interaction. The authors believed Heyman ignored the arch shape deformation and only considered the lateral soil pressure distributed on the extrados, whereas the arch profile at the time of the arch failure was different from its original shape. Ng and Fairfield modified the four-hinge method assuming infinite strength for the arch compression with no tensile stresses. The authors plotted the collapse loads of the Bargower arch bridge against its vertical deflection under different load lines. The effects of the backfill’s weight, different ultimate passive deflection, the backfill’s angle, live dispersal angle and different arch unit weights were also analysed. They used the results of centrifuge tests on the soil– arch system obtained from Hughes et al. (1998) and Burroughes et al. (2001), when analysing the effect of changes in the live load dispersal angle. The authors concluded that the collapse-load estimation was largely affected by arch deflections. Consequently, the weight, angle of shearing resistance, and the ultimate passive deflection of the backfill influenced the predicted collapse load.
application of this method to masonry arch and vault analysis was justified. The results of DIANA software were compared with the analytical solutions. As a benchmark of analytical solutions, the snap-through truss method was used. This analytical approach gives two solutions to analyse the problem: one for shallow trusses (when Sinθ=θ, and θ is the internal angle of truss at the support with horizontal axis) only and the other for both shallow and deep trusses. The results from DIANA were compared with results from the snap-through truss work. From the information in plots of force-displacement for the different methods they concluded that, for problems including geometric non-linearity, DIANA could be suitable as long as large rotations were not included (shallow truss). Regarding the analytical investigation of masonry arch structures, they considered the geometrical factor of safety along with the thrust line. For the line of thrust, they applied Heyman’s theory (1982) that assumed the stability of a pure compression structure under all possible loads when the line of thrust lies entirely within the masonry section. According to Heyman, to contain the entire thrust line within an arch ring, a minimum thickness should be determined for the arch cross-section. The minimum thickness was also required to find the exact collapse load. To calculate the collapse load, two different methods were implemented, the mechanism method for asymmetrical loading and the virtual work method for symmetrical loading. To check the precision of the arch depth, the thrust line was drawn by programming it into
Gilbert (2007) highlighted the limit analysis in verifying the arch safety that has been transferred from hand calculation into computer-based assessment. The two main methods for arch analysis i.e., elastic and plastic, were considered in his research. The elastic method was not regarded as a straightforward approach since there was no unique computable equilibrium state existing for masonry arches. On the other hand, there was only one ultimate state of arch considered whilst assessing the plastic method. As a result, there were considerably fewer parameters and initial stress input data required. The specific conditions of the arch plastic limit state were defined by the “equilibrium”, “mechanism” and “yield” defined. The conditions demonstrated the state of the arch when a load (multiplied by a load factor) was applied. Ideally, the “uniqueness theorem” required all three pre-defined conditions to be satisfied. The resultant factor is for the minimum collapse load factor. There was an emphasis on the thrust line, the number of releases for the mechanism and the geometrical factors for safety whilst estimating the maximum loading factor. Line of thrust and rigid block had been the recognised techniques for masonry arch stability analysis until then. The backfill method was branded as the latest computational procedure capable of modelling the masonry and soil components. Moreover, they stated that three-dimensional masonry arch analysis was a potential area for investment in the future because the technique was still expensive and difficult to adopt in computer-based analysis.
this overestimation was because of the large value of the ratio of the pre-buckling deformation to the arch’s height. Therefore, the buckling formula for the symmetric snap-through mode of a two-pin shallow parabolic arch was found from the non-linear principal equilibrium equation of it. To obtain the equation of shallow parabolic arches subjected to a vertically distributed load, the static mathematical method was used. Thus, the common non-linear equilibrium equation of the arch was reformulated to achieve the equation of an incremental form for the shallow parabolic arch. Also, to find the symmetric buckling load, the shape of the arch was assumed to deform symmetrically. Following the reformulation of the equilibrium equation, the load–displacement relationship was acquired. Additionally, the threshold of different symmetric and asymmetric in-plane buckling modes was obtained in terms of the slenderness ratio and the height-to-span ratio. To find the threshold of different buckling modes, the dimensionless height term (H) was defined as 4h/π2g, in which h is the arch height and g is the radius of gyration of the arch cross-section. Thus, the stability, symmetric snap-through, and asymmetric buckling of the two-pin parabolic arch were determined for the range of dimensionless rise H. Hence, the arch is presumed to be stable for H<π/4, and the parabolic arch may have symmetric snap-through buckling for π/4<H<1.85, and finally asymmetric buckling may occur when H>1.85. To assess the accuracy of the suggested formula, numerical finite element examples were applied, although the interactive buckling was ignored. Hence, the findings from the buckling load via this novel formula and threshold were in accordance with the results of the numerical method.
used in computer software to investigate an arch’s behaviour under both vertical and horizontal displacements.
collapse mechanism theory. The authors recommended a study of backfill influence on an optimal arch shape as the way forward for future arch studies.
Pintucchi and Zani (2009) determined the impact of geometric non-linearity on the collapse mechanism of circular masonry arches. In their study, the material was assumed to have no tension strength and negligible compressive strength. Pintucchi and Zani evaluated the collapse load of arches under their self-weight and a uniformly distributed load or a vertical load applied at the structure crown. As they stated, the slenderness and the equivalent strength of the arch were two decisive factors in determining the collapse load. The former was the relation between the radius and thickness of the circular arch, and the latter was the relationship of the arch geometry to the compressive strength a weight of the arch. An algorithm was defined to estimate the critical load condition. The algorithm was developed into computational code. Pintucchi and Zani concluded that the resultant value of the collapse load was not dependent only on the slenderness and equivalent strength parameters but also on something called equivalent stiffness derived from modulud of elasticity (E). Thus, the authors applied the limit analysis method to circular arches to calculate the multiplier of the collapse load. Moreover, it was presented that a collapse load would be reduced because of the destabilizing effect of forces such as a decreasing E value, which is in accordance with increasing the size of the arch. Furthermore, the reduction of the collapse load would be greater if the slenderness of the arch was greater.
tension strength. Both simple conservative (such as MEXE) and computerised (such as mechanism and FEM) methods were applied to investigate arch loading capacity. The conservative methods usually estimated a loading factor lower than the actual value, hence they were not a cost-effective solution. Additionally, Toth et al. believed that the conservative method was not suitable in the case of non-standard geometries. The computerized method such as the FE has been applied in two- and three-dimensional arch assessments. However, the computerized method was relatively expensive and complicated input data was required. The DEM was recognised to have advantages over previous methods since it modelled the arch through a “collection of separate blocks”. To achieve an appropriate method of masonry analysis, initially the geometry and mechanical properties of a one-span bridge model were defined based on experimental results. Then, Toth el al. developed a multi-span model from the one-span model using new material. In other words, they validated the parameters and mechanical behaviour of the Nishida one-span arch bridge using a discrete element FE method to generate the multi-span arch model. Then they compared the results of the multi-span structures with different backfill materials. The deflections, normal stresses, and plastic mode of backfill under different live load cases were estimated. Toth et al. concluded that the structure capacity was dependent on the stiffness, friction angle, and cohesion of the backfill.
Gibbons and Fanning (2010) compared five different analysis methods for masonry arch bridges. They suggested that these structures needed to be regularly reassessed to make sure their loading requirements and material strength were fit for purpose. However, there was no globally agreed framework. The modified
MEXE method, a three-hinge plastic method, a rigid block method and 2D and 3D
ranging from 2.4 to 15.2 m in Ireland. The modified MEXE method focused on the relation of the arch span and the crown thickness, based on the work of Pippard. However, there were some concerns regarding the span length, span-to-height ratios, depth of fill and its applicability to short-span bridges. Gibbons and Fanning added that the three-hinge plastic and rigid block methods both fell into the plastic method category defined by Heyman. The formation of the fourth hinge leading to the structure failure was the main principle of the plastic methods. Archie-M and
Ring were regarded as existing commercial software for the three-hinge plastic method and the rigid block method, respectively. The three-hinge plastic method was based on the formation of the three-hinge principle developed by Harvey. On the other hand, the rigid block method was based on the failure load factor criterion, which is for the loading required to form the fourth hinge in the arch, as developed by Gilbert and Melbourne (1994). The other assessed method was the elastic one. This involved two-dimensional and three-dimensional elastic analyses. In elastic method, an equation for the compressive strength to withstand the axial forces and bending moments, while having a limited tensile capacity, was used. Consequently, the axial forces and bending moments and compressive strength within the arch material were calculated. This was an iterative process and continued until the maximum axle load was identified. The vertical structural behaviour of the arch was also considered in three-dimensional analyses. Consequently, loads and loads factor, transverse load distribution, and the earth pressures were evaluated using the above-mentioned assessment methods. They concluded that the rigid block method and the 3D elastic method provide the user with the best results. Gibbons also recommended the impact of the earth's pressure on 2D and 3D elastic methods for future work in this field.
of load factor as the ratio of collapse load to live load, assuming a standard vehicle, the load factor was greater than 7 for the chosen single- and multi-span arches. Hence, the sample was relatively sound against the safety criteria.
Rizzi et al. (2014) studied the failure mode of a circular masonry arch with a recently developed analytical solution. The aim of the study was to investigate the Couplet– Heyman problem when the circular masonry arch thickness was at its minimum under self-weight. They used both analytical and numerical analysis to estimate the purely-rotational failure mode. The paper was part of a wider research program initiated at the University of Bergamo in 2006. The classical Heyman (1969, 1982) solution was an analytical method based on masonry arch limit analysis. The solution presented the essential parameters of the five-hinge mechanism failure method. On the other hand, the numerical analysis was also developed by the DEM
within a discontinuous deformation analysis (DDA) framework. There were two other
DEM categories developed by Cundall and Hart (1992). Rizzi et al. (2014) chose
DDA mainly because of its efficiency in the static modelling of masonry arches and they summarised existing DDA techniques in their paper. The results agreed with the analytical solutions. The authors compared the masonry arch critical condition of minimum thickness resulting from the analytical method with Heyman’s solution and validated their technique against DDA numerical computations. In summary, the analytical solutions presented in the paper signified how the minimum masonry arch thickness led to the maximum point on the curve in rotational equilibrium.
2.5. Optimization and form-finding survey
Moreover, finding an optimal arch shape leads to a cost-effective structure with high strength and efficiency.
Many researchers have defined structural form-finding. Otto and Rasch (1995) described form-finding as a technique which uses optimization methods to find the optimal form under a particular load condition. Millais (2005) and Megson (2006) defined form-finding as a technique for finding the most efficient shape of a structure under a specific load condition. The proposed technique involves physical and numerical modelling, and has been applied to a variety of structures, such as shells, domes, cable, and fabric membrane structures (Millais 2005). Coenders and Bosia (2006) defined form-finding as a “proper architectural and structural shape”. Later, Bletzinger (2011) expressed form-finding as “shape finding of equilibrium of forces in a given boundary considering specific stress state”. As a popular definition for form-finding, the optimal shape of a structure is in a state of static equilibrium.
One of the basic form-finding methodologies in the field of arch structures is the application of hanging models. It was Robert Hooke who first stated an anagram in Latin translated as “as hangs the flexible line, so but inverted will stand the rigid arch” (Osserman 2010). This philosophy was put into practice by Gaudi (Tomlow et al. 1989). Gaudi was well known for his novel forms of vertical and inverted catenaries (see Figure 2.2).
To shape catenaries when creating a vault or natural curved arch, Gaudi hung different weights on a series of strings and then photographed the shape and inverted it to get the required form. Many architects have applied this method in their work. Finnish-American architect Eero Saarinen and German-American structural engineer Hannskarl Bandel in 1947 designed the Gateway Arch in St. Louis as an inverted catenary (Osserman 2010). The stability of catenary arches subjected to self-weight only that can transfer only axial forces was explored at the University of Stuttgart (Tomlow et al. 1989). Catenary arches subjected to self-weight only showed great stability while being rocked in their experimental investigation. Inspired by physical hanging models, Kilian and Ochsendorf (2005) applied a well-known programme named the particle-spring system to find a funicular form that could transmit axial forces only. The hanging model was represented by lumped masses linked using axial springs in the computational model. Later, they used an iterative solver to find the equilibrium state of each mass. Thus the optimal structural form was achieved once the whole system was in equilibrium. The technique started with two-dimensional funicular forms and expanded to three-dimensional networks.
Arch form-finding can also be carried out analytically, using mathematical equations. One of the early analytical studies into the optimization of arches was carried out in 1973 by Tadjbakhsh and Farshad. They investigated the possibility of the optimal shape of funicular arches when both the bending moment and shear forces are zero. The general shape of the arch was defined from the beginning in their study. Moving toward form-finding of arches, Farshad (1976) obtained different parametric functions for the shape of an optimal arch under static loading, defining multiple objectives. The objectives in his research comprised minimizing the arch length, arch thrust, and volume of the arch material separately. Consequently, the shape of the arches with minimum thrust and minimum length was found individually when the arches were of a constant cross-section. In the case of arches with a variable cross-section, the objectives were minimized the thrust and the volume of the arch material respectively. Later on, Tadjbakhsh (1981) obtained the geometry of a momentless arch subjected to self-weight and the deck weight, assuming constant axial stress in arches with a variable cross-section. Tadjbakhsh showed that the arch shape was independent of the magnitude of the loading in the case of uniformly distributed load. However, the cross-sectional area varied in proportion to the loading.
emphasised the significance of sensitivity analysis for an optimization. Haftka and Grandhi considered calculating accurate stress at the boundary as important parameters in shape design optimization. To obtain valid optimization results, the design variables had to be selected carefully, especially when they were selected as coordinates of boundary nodes. The shape design variables were chosen so as to reducing the stresses at the boundary. Their work dealt with changing mesh in finite element model when the boundary is changing. The optimization with shape design variables controlled the geometry of the structure. They noted to the significant impact of changes in shape on the structure performance. The importance of the shape effect on the structural action is investigated in the third chapter of this thesis.
shoulder fillets. The author drew a flow chart describing “the design process of the shape optimization”.
arch as the only geometric variable, they minimized the volume of the parabolic arch in this case. The last example was the optimization of the fixed-ended arch under a uniformly distributed load having the same variable as the second example. In this case, they compared the optimal arch shape from their analysis with the parabolic shape. As the result, it was demonstrated that the parabola is the optimal shape of arches under uniformly distributed load. Furthermore, the new results for the three examples were compared with the findings of the two design space methods conducted by Byun and Han in 1984. A plot of the iteration history of the force approximation method showed a swift rate of convergence through few finite element analyses. This was an advantage of the approach by Vanderplaats and Han over the approach of Byun and Han.
Serra (1994) proposed analytical and numerical approximate solutions for the optimal form of funicular arches as a uniformly compressed structure. Serra found the shape of the arch with variable cross-section subjected to uniform horizontal and vertical loading analytically. It was assumed that the L:h ratio is a minimum in the analytical solution, while the limit for this ratio was not given.
three-The application of the form-finding process in architecture was done by Otto and Rasch (1995) in the second half of the 20th century. Otto is well-known because of his lightweight tensile and membrane structures. As he believed, the optimal architecture is ethical architecture, including an aesthetic viewpoint, and his works were considered as artistic and innovative masterpieces, such as the West German Pavilion at the Montreal exhibition in 1967 and the roof of the Munich Olympic Arena in 1972. He considered form-finding as a research technique and a way of designing natural systems without destruction in nature. Moreover, his main tool for working was physical modelling that could be used to simulate the optimized solution. He concentrated on tents with a minimal surface area, including soap-film experiments, pressure-loaded vault forms, and grid shells stabilized by tension lines through careful construction and experimental physical models. Earlier, in 1964, Otto established the famous Institute for Lightweight Structures at the University of Stuttgart. Accomplished experiments in that Institute have provided detailed information for the description of forces, as well as their transpositions, which were regarded as the explanation of the form principle. Then, by consuming minimum material and energy, any new structure was fitted into its environment. Many form-finding experiments to obtain natural forms of arches and their three-dimensional equivalents such as domes continue to be conducted in the University of Stuttgart. They demonstrated a great stability of a natural arch shape subjected to self-weight only, which is turned out to be a catenary arch with the momentless shape.
shell theory of Kirchhoff–Love. The stress distribution was obtained from the elastic energy function and displacements constraints, which were defined for both fixed and simply supported arch ends. Hence, the compliance of the elastic energy functional was achieved from the equilibrium equation in terms of the geometrical description of the arch and the loading. To optimize the arch structure regarding displacements and stress distribution, he modified the shape of the arch structures. This optimization process was carried out by applying the cost function theorem to two different minimization areas. Cost parameters one was the minimization of the maximum stress distribution of the upper surface and the second was the minimization of the maximum displacement. In this process, a parabola form was first considered, and the optimal shape was identified, when the method converged after a number of iterations. Habbal showed that the optimal arch shape obtained under uniform and non-uniform distributed loading for the maximum displacement cost is different from the one for the maximum stress cost.
only suitable for shallow arches. He also indicated that Kim and Kwak (1993) had taken one further step and tackled the Dopker et al. and Chenais et al. generality issue by considering the structure in different segments, each segment representing a shallow arch. The continuum approach developed by Choi was initially introduced by Dems and Mroz in 1987. First, the curved beam “variational equation”, that is the derivation of the variational theory of the equilibrium equation, was formulated, followed by the shape variation sensitivity formula using continuum mechanics. Next, the resultant sensitivity coefficients were used in a parametric study. In summary, the author defined the design sensitivity formulation when stress was applied at a local segment of the structure. Choi believed that the proposed shape design sensitivity method could be solved numerically, giving accurate results. Additionally, the method thoroughly described the shape and its variation. The arch length variation was also considered in the analysis. As a result, such comprehensive analysis presented better optimal design parameters for complex shapes. Lastly, the proposed shape design sensitivity analysis was not limited to shallow arches. It could be expanded from linear elements to higher order elements. Choi also tried to validate the findings of his sensitivity assessment method with a number of examples. He applied the ANSYS finite element analysis tool with just a straight line representation. As he stated, ANSYS was more accurate compared to other tools in terms of numerical assessment. The author carried out shape optimization using his method of analysis for two design problems.
unique mathematical formulation available for numerical traceability. To address the curvature problem, they used programme AMPL as a modelling language and also
LOQO as a non-linear optimization solver. Because it took LOQO a few seconds to search for the solution it is the optimization solver. The findings suggested that convex optimization was more numerically traceable for an arch with an identified mass function. Furthermore, the role of proper modelling in the optimization process was emphasised. In other words, the effective arch modelling resulted in a simpler and much quicker optimization process.
Megson (2006) and Millias (2005) noted that when an arch is subjected to only a uniformly distributed load, a parabolic form shows zero bending moment, while an arch with self-weight only will have a zero bending moment if it follows a catenary form. However, in reality, both kind of loads are imposed on the structure, so the form in between might present the zero bending moment solution. By reducing the bending moment, an arch will resist loading by developing mostly compressive forces. The important engineering fact is that tensile forces cannot transfer in the case of masonry arches reliably. As bending moments are reduced in masonry arches, the internal tensile forces are decreased and it leads to have a more durable structure.