Dolf Reineman
S1864661
OPTIMIZATION OF THE FUTURE CAPACITY OF
WORKERS IN A CONSTRUCTION COMPANY
OPTIMIZATION OF THE FUTURE CAPACITY OF
WORKERS IN A CONSTRUCTION COMPANY
A RESEARCH ON THE OPTIMAL CAPACITY OF STRUKTON CIVIEL NOORD & OOST IN ORDER TO DOUBLE THEIR MARKET SHARE
12 September 2019
Industrial Engineering and Management University of Twente
Bachelor 3, bachelor thesis
Student
Dolf Reineman Studentnumber s1864661 [email protected]
Supervisor: Dr. D.M. Yazan
Company
Strukton Civiel Noord & Oost
3
Preface
In front of you is the bachelor thesis “Optimization of the future capacity of workers in a construction company”. This thesis has been written to fulfil the bachelor Industrial Engineering and Management at the University of Twente. I was engaged in writing this thesis from April to July 2019.
The study was undertaken at the request of Strukton Civiel Noord & Oost, the company where I undertook an internship. Together with my supervisors, Jan Hendrik Fischer and Roy Postma, we formulated the research question that has been central to this study. My supervisor from the University of Twente, Dr. D.M. Yazan, has also been very helpful to me. Conducting the research was sometimes hard, but by extensive investigation an answer to the question was found. It was very helpful that my supervisors were always available and willing to answer my queries.
I would like to thank my supervisors for the pleasant cooperation and the support I received from them during my graduation process. Besides, I would like to thank all the other employees of Strukton Civiel Noord & Oost that helped me and therefore enabled me to finish this research. Also, I would like to thank my parents and friends who have been very helpful during my graduation period. They helped me debating my issues together. They helped me to keep myself motivated with their wise counsel. I hope you enjoy your reading.
Dolf Reineman
Summary
Strukton Civiel Noord & Oost, a construction company, would like to be a major player in the market of concrete roads. In order to do that, the company wants to double its market share. The organization would therefore like to know what their optimal workers capacity would look like when they would do the projects that are needed in order to double their market share. This resulted in the following research question: What should the workers capacity of Strukton Civiel Noord & Oost be if they want to double their market share?
To be able to answer this central question, first the context was analyzed and a literature review has been conducted. This formed the basis to compare the current situation to the desired new situation. In order to determine what the capacity should be if the market share is doubled, two scenarios were drafted which represented a double market share. The choice for two scenarios was made in consideration with the company, these scenarios represent a possible future planning in which six different project types emerge. The main difference between the scenarios is that the second scenario includes projects with the project type airport. This project type comes with more risk, because it is more complex. Each project type needs a certain amount of workers and machines. For each project type the exact amount of workers was determined including the function of these workers and which machine was needed. With the help of this information, the daily demand of workers could be calculated. This demand was used for the optimization of the capacity of workers, in which the total costs of labour were minimised. These costs consist of the labour costs of permanent and flex workers. Flex workers can be hired per individual day. To determine the optimal capacity, a model was made. The problem was based on a linear programming model called the multiperiod work scheduling problem. The model included several constraints, of which the most binding concerned the flex layer of two workers. This means that during the scenarios only two extra external workers can be hired if necessary. This model was run in the program Lingo to determine the optimal capacity composition. This resulted in the following needs in terms of capacity. If the first scenario is realised, then in total ten workers are needed and a flex layer of two workers, which can be hired if needed. For the second scenario, the optimal capacity was determined for a total capacity of sixteen workers and a flex layer of two workers. In both scenarios, two of the total amount of workers should be foremen and two workers should be engine drivers. The rest of the workers should be hand workers.
It can be concluded that, in order to double the market share Strukton Civiel Noord & Oost has to hire more workers. This was determined by comparing the current capacity with the optimal capacities from the scenarios. If the first scenario is followed, then the company should hire one extra engine driver and one extra hand worker. If the second scenario is followed, then the company should hire one extra engine driver and seven extra hand workers. In both cases the company will often do two projects at the same moment. This means that the company has to work with two teams, which can exchange workers if needed. This will increase the occupancy rate, which means that workers are occupied more days from the total days they are hired.
Samenvatting
Strukton Civiel Noord & Oost, een constructiebedrijf, wil graag een grotere speler worden op de markt van betonwegen. Om dit te bereiken, wil het bedrijf haar marktaandeel verdubbelen. Om dit te kunnen doen wil de organisatie graag weten wat haar capaciteit van mensen moet zijn als ze de projecten wil doen om dit marktaandeel te verdubbelen. Dit resulteerde in de volgende onderzoeksvraag: Wat moet de werkers capaciteit van Strukton Civiel Noord & Oost zijn als ze haar marktaandeel wil verdubbelen?
Om deze vraag te beantwoorden, is eerst de context geanalyseerd en een literatuuronderzoek uitgevoerd. Dit vormde de basis om de huidige situatie te vergelijken met de gewenste nieuwe situatie. Om vast te stellen wat de capaciteit zou moeten zijn als het marktaandeel wordt verdubbeld, zijn er twee scenario’s opgesteld die een verdubbeld marktaandeel vertegenwoordigden. De keuze voor twee scenario’s is gemaakt in overleg met het bedrijf, deze scenario’s vertegenwoordigen een mogelijke toekomstige planning waarin zes verschillende project typen voorkomen. Het voornaamste verschil tussen het eerste en tweede scenario is dat in het tweede scenario projecten voorkomen met het project type luchthaven. Dit type project kent hogere risico’s. De verschillende project typen hebben allemaal een aantal werkers en machines nodig. Voor elk project type was het exact aantal werkers vastgesteld met daarbij de functie van de werkers en de machine die nodig is. Met behulp van deze informatie was de dagelijkse vraag naar werkers vastgesteld. Deze vraag was gebruikt voor de optimalisatie van de capaciteit van werkers, waarin de totale loonkosten werden geminimaliseerd. Deze kosten bestonden uit de loonkosten van vaste werkers en flexwerkers. Flexwerkers kunnen per dag ingehuurd worden. Om de optimale capaciteit vast te stellen, werd een model opgesteld. Dit model was gebaseerd op een lineair programeer probleem genaamd het multiperiod work scheduling problem. Dit model bevatte meerdere restricties, waarvan de meeste bepalende restrictie de flexibele laag van twee werkers betrof. Dit betekent dat tijdens de scenario’s maximaal twee flexwerkers kunnen worden ingehuurd als die nodig zijn. Dit model werd uitgerekend met het programma Lingo om zo de optimale capaciteit samenstelling vast te stellen.
Dit resulteerde in de volgende behoefte aan capaciteit. Als het eerst scenario wordt gerealiseerd, dan zijn er in totaal 10 vaste werkers nodig en daarbij een flexibele laag van twee werkers, die kunnen worden ingehuurd indien nodig. Voor het tweede scenario, was de optimale capaciteit vastgesteld op een totale capaciteit van zestien werkers en een flexibele laag van twee werkers. In beide scenario’s, moeten twee van het totaal aantal werkers voormannen zijn en twee werkers moeten machinist zijn. De rest van de werkers zouden handwerkers moeten zijn.
Het kan geconcludeerd worden dat om het marktaandeel van Strukton Civiel Noord & Oost te verdubbelen er meer werkers moeten worden aangenomen. Dit was vastgesteld door de huidige capaciteit te vergelijken met de optimale capaciteiten van de scenario’s. Als het eerste scenario wordt gevolgd, dan zou het bedrijf een extra machinist en een extra handwerker moeten aannemen. Als het tweede scenario wordt gevolgd, dan zou het bedrijf een extra machinist en zeven handwerkers moeten aannemen. In beide gevallen zal het bedrijf vaak twee projecten tegelijk/op hetzelfde moment uitvoeren. Dit betekent dat het bedrijf zal moeten gaan werken met twee teams, waarbij werkers kunnen worden uitgewisseld tussen teams als dit nodig is. Dit zal de bezettingsgraad laten stijgen, wat betekent dat de werkers meer dagen bezet zijn van de dagen dat ze zijn ingehuurd.
Table of contents
Preface ... 3
Summary ... 4
Samenvatting ... 5
1. Introduction ... 7
1.1. Strukton Civiel ... 7
1.2. Reason for starting this project ... 7
1.3. Problem identification ... 8
1.4. Research questions... 9
2. Context ... 10
2.1. The problem approach ... 10
2.2. The planning process ... 10
2.3. The current capacity ... 11
2.4. The capacity demand per project type ... 11
3. Literature review ... 13
3.1. Optimization in construction ... 13
3.2. Linear optimization ... 15
3.3. Team formation in construction ... 16
4. Methodology ... 17
4.1. Research design ... 17
4.2. Scenario drafting ... 18
4.3. Scenario analysis ... 20
4.4. Optimization model ... 21
5. Results ... 23
6. Conclusion, discussion and recommendations ... 25
References ... 28
Appendices ... 29
Appendix A ... 29
Appendix B ... 30
Appendix C... 36
Appendix D ... 42
Appendix E ... 48
Appendix F ... 55
1.
Introduction
In the introduction chapter the company and the reason for starting this project are described. In addition, the identification of the problem is presented. Finally, the research questions are explained.
1.1.
Strukton Civiel
Strukton Civiel Noord & Oost is part of the construction company Strukton Civiel. Strukton Civiel is part of the Strukton Group. Strukton Civiel Noord & Oost is focused on the design, realisation, management and maintenance of infrastructural projects. The organization has multiple departments, including road construction. Road construction consists of several services and products, for example high-quality asphalting, road maintenance, road & energy, tunnels & bridges, groundwork and concrete roads.
Concrete roads are sustainable and economically attractive quality products. Concrete roads do not suffer from material loss. Therefore, less maintenance is needed and a long lifetime of the product can be guaranteed. The concrete for these roads can be 100% recyclable concrete, which fits the idea of a circular economy. The concrete roads also save in lighting costs, because they have a high reflective power. However, the initial costs are higher for concrete roads in comparison with asphalt roads. Still, in the long-term, costs are saved because of fewer maintenance costs. Besides, the construction of concrete roads takes more time than the construction of asphalt roads. The reason for this is, that the weather conditions have a major influence on the construction of concrete roads. For example, concrete roads cannot be constructed during rain or too much sun, because this affects the quality of the end product. However, this is less a problem when constructing asphalt roads. The construction of these concrete roads will be the subject of this project.
1.2.
Reason for starting this project
The idea for starting this project is, that the company of Strukton Civiel Noord & Oostwould like to become a major player in the market. To achieve this goal, they would like to double their market share in constructing concrete roads from 5% to 10% in the coming years. At this moment they turn over approximately three to four million euros with their projects each year. Within the company they carry out six different projects of making concrete roads. This varies from making bicycle roads to constructing a runway for an airport. These projects are all quite different, but still need the same basis team of workers. To achieve their goal, they have to run more projects in order to get more revenue. But at this moment multiple problems prevent them from doing this. They do not know on which types of projects they have to focus, because every type of project delivers a different amount of revenue and also has different needs in terms of capacity. Their working capacity consists of people and machinery. In the remaining part of this project, working capacity and capacity will be considered the same.
1.3.
Problem identification
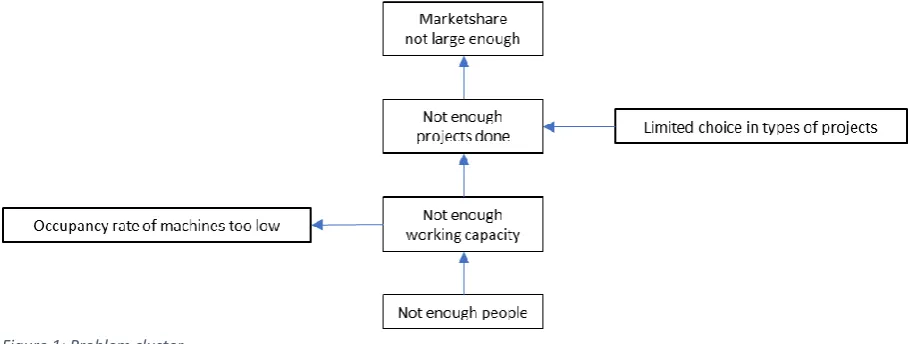
To make the situation clear and to show which problems cause each other a problem cluster was made. These problems, stated in this problem cluster, are placed in a structured way, so that is clear which problem is causing the other problems. The problem cluster helps in finding the core problem, which is the real problem that is going to be solved.
[image:8.595.70.525.168.340.2]The problems in the cluster are based on the problem list which can be found in Appendix A.
Figure 1: Problem cluster
The core problem:
The company has not enough capacity of workers.
The reason for choosing this as a core problem is, that all the problems of not achieving the market share intended, leads back to having not enough working capacity. Having not enough working capacity is mainly caused by the fact that there are not enough workers available to carry out projects. This problem does not have any causes in the problem cluster and can be influenced. That is why it could be the potential core problem.
As explained before, the company would like to increase their market share from 5% to 10%. To achieve this, the company must carry out more projects. In order to achieve this, the capacity of workers has to be increased, because that is the problem which causes that too few projects are being carried out. Therefore, it is clear that the company needs more workers to increase their market share. The efficiency of the current workers will not be taken into account in this project, because the assumption can be made that these workers already work efficiently and that this cannot be improved. This assumption was made in consultation with the company.
1.4.
Research questions
To approach this core problem, knowledge is needed to answer the following research question: What should the workers capacity of Strukton Civiel Noord & Oost be if they want to double their market share? To be able to answer this question, the following knowledge questions are made, which are shown below.
• What is the capacity demand of each type of project?
• What is the current capacity?
2.
Context
In this chapter the current situation and the problem approach are described. First the problem approach is described and next the current situation is described using the planning process in general, the current capacity and the capacity demand per project type. In addition, a description of the market is given.
2.1.
The problem approach
The problem approach is described in order to give a better explanation of the actions that are performed to solve the problem. This will help understanding the purpose of the following chapters. The problem approach consists of several steps to solve the problem. First, the capacity demands per project type was determined. This was needed to calculate the capacity demand during a period of time. Next, the current capacity had to be mapped, to understand what the capacity was.
Besides that, a scenario was needed which showed what type of projects could be carried out during a certain period in the future, aiming at a double market share. Based on that the capacity had to be determined. Together with the company, two scenarios were drafted that represented a slightly different planning with different project types. However, these scenarios represented a comparable market share of 10%.
Then the scenarios were used to determine the daily demand. This was done by joining the information from the first step and the capacity demand per project type with the project type that was planned in the scenarios. With the help of these scenarios the optimal capacity was determined for each scenario. The optimal capacity includes the minimisation of costs and taking into account the costs of workers. The optimal capacity was determined with an optimization method. Then the final step was to compare the current capacity with the optimal capacity for the scenarios. This was done to indicate what kind of extra workers was required for achieving the company’s goal in the case of the scenarios. Besides, the occupancy rate was calculated to get an insight in the amount of days that workers are occupied in comparison with the amount of days they are hired.
2.2.
The planning process
The planning process describes how the projects are selected and scheduled into a planning. The projects are offered on the open market and through private invitations by a lot of different organizations such as municipalities, provinces and contractors. All of these projects have different requirements such as the duration, the needs in terms of capacity and moment of completion. Moreover, the projects are offered at unpredictable moments.
This offer has a description of a project which explains what has to be done under what conditions. The manager of the concrete roads decides which projects are selected from the offer on the market and the private invitations, based on the project description. This selection is made while taking into account the strategy, the potential revenue, the availability of the capacity and the planning.
Then the project offer is calculated by a person named ‘‘the calculator’’. This person makes an offer for what price the project could be carried out. The project is acquired when the offer has the lowest price compared to the other offers from competing companies.
When a project is scheduled on a day with bad weather conditions like rain, the project gets delayed and this could affect the planning. Consequently, projects have to be rescheduled. Another reason for rescheduling is that sometimes projects are part of a larger main project and this project determines the moment of construction. This date is often known, but when the main project is delayed it can affect the moment that the smaller project has to be carried out. This may lead to the rescheduling of projects.
2.3.
The current capacity
The current capacity is described as the workers and machinery that the company has at their disposal currently. At this moment the company has one team who carries out projects. The composition of the team consists of two foremen, an engine driver and five hand workers.
The foreman is the person in charge at the location of the project. He can also contribute to the work in the same way as a hand worker could do. There is always one foreman at the project. The team consists of two foremen and one of them functions temporarily as a hand worker.
The engine driver controls the machinery and when there is no machinery needed for the project, he functions as a hand worker. The five hand workers carry out several tasks such as encasing, pouring concrete, digging concrete, striking pens and finishing the saw lines.
There are three different machines needed for projects are described below.
The first machine is called the “SP15”, this paving machine is used for line constructions. These line constructions are needed for projects where constructions such as roadside concrete, curbs and barriers are constructed.
The second machine that is used is the “SMGE” or the “MSP50”. This machine is used for the construction of entire roads or so-called pavement constructions. The machine is needed at the projects where bicycle roads, roads and barriers are constructed. This machine is used for pavements with a width up to 5 meters.
The third machine is the “SP1600”. This machine is used for the construction of roads at airports, highways and wide terrain pavements. This machine can only be used for pavements that are between 5 and 16 meters wide.
2.4.
The capacity demand per project type
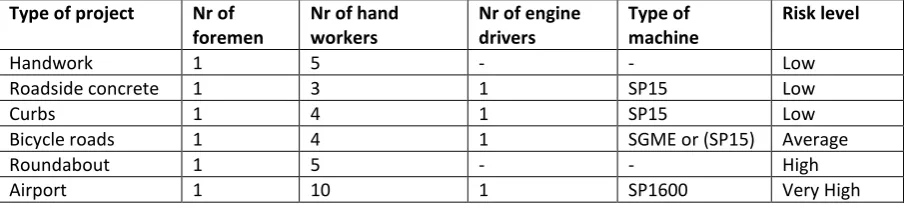
The capacity demand per project type describes the amount of workers and machinery needed for a certain project type. The projects that are carried out by the company can be classified as six different types of projects. These types are described below and also the capacity demand of these project types are described. Besides, the risk level of the project types is described. With risk level is meant that the risk to carry out a project properly and that as a consequence the financial result of that project is most likely good. If the risk is high, the potential profitability of the project is often high, but so is the chance of loss.
Handwork
Roadside concrete
The project type for roadside concrete is meant for the projects where only roadside concrete is constructed, which is a form of a line construction. The capacity demand for this type of project is one foreman, three hand workers and one engine driver. However, when constructing roadside concrete, the machine “SP15” is needed. This project type has a low risk level.
Curbs
The project type curbs is for all the projects where a line construction is constructed except roadside concrete. Not only is it a different project, it also demands a different capacity. Within the project type curbs, curbs of projects can have different shapes but the same amount of workers is needed and the machine “SP15” is needed. For this type of project one foreman, four hand workers and one engine driver are needed. This project type has a low risk level.
Bicycle roads
The project type for bicycle roads contains all the projects where bicycle roads and pavements with similar capacity demands are constructed, such as barriers and roads with a width of 2 meters or more. The roads constructed within these projects can have different widths and for this reason two types of machines can be used, the “SP15” and the “SMGE”. The choice of machine depends on the width of the road. The “SP15” is used for roads with a width up to 2 meters and from 2 meters and wider the “SMGE” is used. The workers needed for this type of project are one foreman, four hand workers and one engine driver. In the planning of the previous year, only an “SGME” machine was used. Therefore, the assumption is made in the scenarios that the capacity demand of bicycle roads includes an “SGME”. This project type has an average risk level.
Roundabout
The project type for a roundabout includes all the projects where roundabouts are constructed. This construction process consists of a lot of different tasks which are similar to the projects from different project types. During the construction of a roundabout, roads and curbs are constructed. That is why the demand for capacity changes during the project. The project type for a roundabout is the part of the project where the actual roundabout is constructed, which is done by hand. Therefore, the capacity demand for this project type is one foreman and five hand workers. The other parts of constructing a roundabout are described with the other project types. This project type has a high risk level.
Airport
The project type for an airport is for the projects where wide roads on airports are constructed. This project type requires a lot of workers in comparison to other project types. The capacity needed for this project type is one foreman, ten hand workers and an engine driver. For this construction the
“SP1600” is needed. This project type has a very high risk level.
[image:12.595.72.530.662.766.2]Below a table is provided with an overview of the capacity demand per project type. Besides, an extra column is added with the risk level.
Table 2: The capacity demand per project type
Type of project Nr of foremen
Nr of hand workers
Nr of engine drivers
Type of machine
3.
Literature review
In this chapter, three important subjects and the intention for this project will be discussed. This is done by using literature. The three subjects are optimization in construction, linear optimization and team formation.
3.1.
Optimization in construction
The construction industry is a project-based industry in which effective project scheduling is a challenging task for the construction project management. Optimization is used to effectively schedule these projects. Optimization in construction can focus on a lot of different objectives or even multiple objectives at the same time. The objective of the optimization influences the choice in optimization technique. Next to that the specific situation does also determine what kind of optimization method has to be applied for. Therefore, some examples of the most common optimization problems and commonly used techniques are described below (Kandil, El-rayes, & El-Anwar, 2010).
The first one is resource levelling. In this optimization problem the objective is to minimize the fluctuation in resource usage. This avoids that employees have to be hired or fired, which affects the morale of employees and causes that the benefits of learning and training acquired by employees over time, cannot be used. By minimizing these fluctuations, costs are saved because the productivity of employees is higher and the morale of employees is improved. The difficulty of this problem is that the resource demand of an organization has to be made as uniform as possible and that this predetermined distribution of resource utilization has to be followed in order to meet the project deadlines. Next to that there is the possibility that the resource demand can vary during a period, which makes the problem even more difficult. Another problem can be that the resource demand cannot be satisfied because there are no employees available (Senounci & Eldin, 2004).
The second one is a time-cost optimization problem. The objective is to minimize the total project costs by scheduling the activities of a project in the most optimal schedule. For example, if the duration of a project is made shorter by scheduling, then the direct costs will increase because the same work has to be done faster and consequently additional resources may be needed. But in return the indirect costs will reduce since the duration of the project will be reduced. Besides, there are often constraints that have to be taken into account. An example is that a project has to be finished in a certain amount of time (Veludurthi, Anup, & Sridevi, 2017).
The third one is resource allocation, which looks similar to resource scheduling. Resource allocation is sometimes referred to as constrained-resource scheduling. In this problem a limited amount of resources has to be assigned among several activities (Winston, 2004). Therefore, the objective of resource allocation is to schedule the project activities in a way that a constrained number of resources is used most efficiently, while keeping the duration of a project reasonable. Because using fewer resources, often results in an extension of the duration. That is why this extension has to be kept minimal (Hegazy, 1999).
There are three types of techniques which are used to solve these optimization problems, which are the heuristic method, the mathematical methods and the evolutionary methods (Veludurthi, Anup, & Sridevi, 2017).
The first technique that had been applied to solve these problems traditionally, is the critical path method (CPM) which is a heuristic method. This technique is easy to understand and to implement but it has serious limitations, for example, it assumes unlimited resources which is very difficult to optimize if a project is more complex. Next to that, this technique often finds a near optimal solution instead of finding the global optimal solution (Veludurthi, Anup, & Sridevi, 2017) (Leu, Yang, & Huang, 2000). The second techniquewhich is used, are the mathematical methods. These methods are for example linear programming, integer programming, dynamic programming. The methods can find the exact optimal solution but it has complex formulas (Veludurthi, Anup, & Sridevi, 2017). Next to that, this technique has the disadvantage that it cannot solve large and complex problems effectively (Leu, Yang, & Huang, 2000).
The third technique is the genetic algorithm (GA), which is an evolutionary method (Veludurthi, Anup, & Sridevi, 2017). It simulates the evolution process of “survival of the fittest”. The algorithm compares strings on fitness with each other. These strings represent potential solutions and consist of values for the decision variables. The fitness of a string is determined by the performance of the string on the objective function (Senounci & Eldin, 2004). The genetic algorithm consists of three operations. The first operation is the reproduction operation. In this operation the strings get a chance of survival based on their fitness, so that the best strings get reproduced for the next generation. This reproduction does not change the values of the strings, which become parent strings in the next generation. The second and third operations create offsprings from the parent strings by changing values from the parent strings. The second operation is called crossover. In this process the parent string is broken into parts and the parts are exchanged with other parts from another parent string. This leads to offsprings and so to new solutions. These strings are compared to the parent strings to check if these strings are more fit. The third operation that is performed is mutation. In this operation parent strings are randomly changed. This means that values of parent strings are changed when passed on to the offsprings in the next generation. In this way new values are created which did not exist in the parent strings. This operation explores new solution areas which potentiality could have better solutions. This process of
“survival of the fittest” is repeated multiple times to eventually find the optimal solution (Hegazy, 1999) (Senounci & Eldin, 2004).
3.2.
Linear optimization
Linear optimization is often called as linear programming and can be considered the same during the remaining part of this project. Linear programming is a technique for solving optimization problems. An optimization problem is to find the best option from all possibilities in order to maximize or minimize the value of a function (Winston, 2004).
Linear programming is applied to optimization problems which are linear, or so-called linear programming problems. A linear programming problem consist of three elements and can be described as (Winston, 2004, p. 112):
1. A linear function of the decision variables which is maximized or minimized. This function is named the objective function. The decision variables describe the decisions that can be made and is often in the form of X1, X2, …, Xn.
2. A set of constraints that restrict the values of the decision variables that can be assumed. All of the constraints have to be a linear equality or linear inequality.
3. The sign restrictions, which describes if it can only assume nonnegative values for each decision variable, what causes that a sign restriction is added, which is shown as 𝑥1≥ 0. Or that a decision variable may be positive, negative or zero which causes that it is unrestricted in sing (urs).
The objective function consists of the decision variables, which have a coefficient called the objective function coefficient. This represents for example the profit or cost for each variable.
There are many different linear programming problems which require different linear programming models in order to solve them. An important type of a linear programming problem for this project is the multiperiod work scheduling problem (Winston, 2004).
The multiperiod work scheduling is focused on scheduling employees in case a company encounters a changing demand for time. Linear programming is used to minimize the costs of labour for this changing demand. In order to draft this linear programming model some additional steps have to be made.
First the decision variables are determined. However, these decision variables have an additional aspect and that is that the time has to be taken into account. So not only the value of the decision variable is important, but also during which period this decision variable has its value. This results in the following decision variable.
𝑥𝑡 = 𝑣𝑎𝑙𝑢𝑒 𝑜𝑓 𝑑𝑒𝑐𝑖𝑠𝑖𝑜𝑛 𝑣𝑎𝑟𝑖𝑎𝑏𝑙𝑒 𝑑𝑢𝑟𝑖𝑛𝑔 𝑝𝑒𝑟𝑖𝑜𝑑 𝑡 (𝑡 = 1,2, … , 𝑛 )
Next to that stating additional constraints is needed. The decision variables have to satisfy the different demands of the periods. This has to be included in the constraints. An example of a changing demand is shown below, where the demand changes from ten to eight over a period.
𝑋1+ 𝑌1≥ 10
𝑋2+ 𝑌2≥ 8
These constraints have to connect variables of different periods, because, sometimes a choice which is made for a decision variable in a period, affects the value of a decision variable in another period. An example of this constraint is given below where a decision variable in one period stays equal in the next period.
3.3.
Team formation in construction
The construction industry is a very dynamic and complex industry according to Raiden, Dainty, and Neale (2004). The industry is project-based with almost each project being different, because the projects are custom-built and have to satisfy the specifications of the client. This results in a fluctuating workload for organizations, because projects have different needs. These fluctuations cause that the need for employees can change significantly. Not only the volume of employees needed can change, but also their skills required. Therefore, the formation of teams changes regularly when a new project is accepted. As a consequence, teams have to form, develop and disband relatively quickly. This makes that effective human resource management is hard to realise. Baiden, Price, and Dainty (2006) also suggest that the composition of teams have to be formed in a way that team members can be brought in or removed from teams if necessary. This way of efficient use of human resources, can contribute to an improved team effectiveness.
In team formation it is important to select team members on the basis of their personality and skills in order to have an effective team. However, the specific skills that are required differ per project and sometimes even within the duration of a single project. Individual employees with important skills might be needed in more than one project at the time. But one should be careful with replacing employees. Raiden, Dainty, and Neale (2004) state, that the performance of teams can be disrupted by changing the formation of teams, especially when key project members are replaced or removed from teams. Therefore, effective Human Resource Management is needed to handle this dynamic project-based context.
Currently, the complex task of human resource management and in particular team formation is often executed by senior managers, based on subjective decision-making and reactive processes. A reason for this is, that they are often not fully informed due to not having access to all the information required for making the deployment judgements.
4.
Methodology
In this chapter it is described how the research is performed in order to get an answer on the question what the capacity should be. In this research, quantitative and qualitative research is performed. The data collection, the research progress and the data analysis are described. Next to that, the scenario setting, scenario analysis and the optimization model are described.
4.1.
Research design
Data collectionThe data for this study were collected with three methods: literature research, face-to-face interviews and document analysis.
The literature research focused on the three subjects: optimization in construction, linear optimization and team formation. Information about linear optimization was obtained from the book operations research (Winston, 2004). Scientific articles had been used to collect data about the two other subjects. These articles were found by using Google Scholar. For the literature research only articles were used which are peer reviewed.
The face-to-face interviews were held among employees of the company to gather data about several topics. For these interviews only employees were interviewed who were involved in the scheduling and management of the projects, because they make the decisions about the planning and allocation of the resources.
The topics were focused on acquiring knowledge about the background of the company, the current capacity of the company, the capacity demand per project type and the scenarios for the future demand.
During the face-to-face interviews, minutes had been made, because often a lot of information was provided at the same time. Sometimes the data were too complex or simply too much to write down or could not be provided at that moment. Then a document was provided afterwards and a document analysis was performed to collect the data.
Research progress
The design of the research was to have face-to-face interviews among the Strukton Civiel Noord & Oost employees who were involved in the scheduling and management of projects. All these employees were available to be interviewed at different moments and this was done at the office. Most of the questions were answered during the interview and the answers were recorded. If the provided information was too complex, too much or could not be provided orally because it had to be looked up, the information was provided afterwards by way of a document. This was often the case when quantitative data had to be provided, which mostly occurred in data about the current capacity, the capacity demand per project type and the scenarios for the future. This data had then been retrieved by conducting a document analysis.
Data analysis
4.2.
Scenario drafting
In this chapter, two scenarios are drafted to get an overview of the capacity demand of workers in the future which can be used for the optimization. These scenarios represent a possible future planning for the company.
The scenarios are based on the face-to-face interviews and the data of the planning of the previous years. Data of the previous years are used, because these reflect the strategy of the company and moreover, there are no other data available to use. The planning of the previous year contains the projects which were chosen based on their strategy and of which the acquisition of the projects had been successful. These types of projects are more likely to be acquired in the future than other types of projects, since they already succeeded in doing this before.
The planning method of projects used by the company is complex and has, for several reasons, no clear defined system. Therefore, it is hard to use the planning method to draft the scenarios and this method will not be used. As explained in chapter 2.2, the company tries to fill the planning with projects in order to get their revenue desired. Projects are selected based on their description of the offer from the market and from private invitations, while taking into account the strategy, potential revenue, the availability of workers and the planning.
Again, as explained in chapter 2.2, the projects which are offered are very difficult to predict. Besides the content, needs in terms of capacity and moment of completion are also difficult to estimate. Moreover, projects still have to be acquired, which often depends on the involvement of other companies as well. This contributes to the fact that it is difficult to predict which projects the company will acquire. Therefore, data about the project offer from the market of previous years, are not used since this does not determine the future project offer from the market. Due to the fact that the future offer from the market is not predictable, the planning method cannot be used to draft the scenarios. The first scenario is drafted in the following way. In last year’s planning the projects are doubled, so that the same type of projects is carried out twice at the same time. The reason for this is, that last year’s planning reflects the current market share of which the company intends to double under the same strategy. But not all of the projects can be doubled, because they are limited by the fact that the company does not want to change the amount of machines. There are no other constraints which had to be taken into account, according to the company. To cope with the limited amount of the machines, the following way of scenario drafting is being used.
The first scenario is drafted by doubling last year’s planning and scheduling all of the duplicated projects two weeks later than the original projects. This is done to prevent the direct overlap of projects in need of the same machine. The two weeks’ delay is based on the project with the longest duration. Then, in order to prevent the direct overlap, all projects had to be postponed for two weeks. The projects which had been scheduled in the last two weeks of the calendar year, are placed in the first two weeks, because otherwise, these projects exceeded the period in which projects could be carried out. By delaying all projects for two weeks, the composition of projects which had been acquired during the previous year, stayed the same.
The next step was to make the planning feasible, because some projects still overlapped with their capacity demand of the same machine or were planned during holidays. For example, projects lasting two weeks and scheduled before the holidays, had been planned during holidays due to a delay of other projects. To solve this, the projects that could not be carried out at the same moment due to the fact that they required the same machine or the ones that were planned during holidays, had to be rescheduled. These are coloured in the planning.
Rescheduling of projects is used, because during the previous planning, rescheduling was already used in order to make the planning feasible for changes such as new projects or delays, as explained in chapter 2.2. Therefore, rescheduling is used again, to make the scenario feasible because it is similar to the approach that was normally used.
The rescheduling of the projects had been done in two ways: projects were swapped with projects that did not require the same machine or projects were rescheduled to moments which were open in the planning. These actions were performed in the following way. The projects were checked on the ones that overlapped or were planned during holidays, starting at the beginning and working up to the end of the planning. The first project that had to be rescheduled was immediately swapped with the closest possibility that appeared in the planning. This means that the project was swapped with the closest project in the planning that did not exceed the constraints or was moved to the closest open space in the planning. The choice for the closest possible project or open space was made to have the least influence on the execution of a project. Again, this was done while making merely slight changes in the composition of projects. Therefore, the projects were not simply replaced by projects that could fit in easily. In line with this consideration, project 8 was rescheduled before project 6 was rescheduled, since this meant that project 8 would only have to be moved for one day.
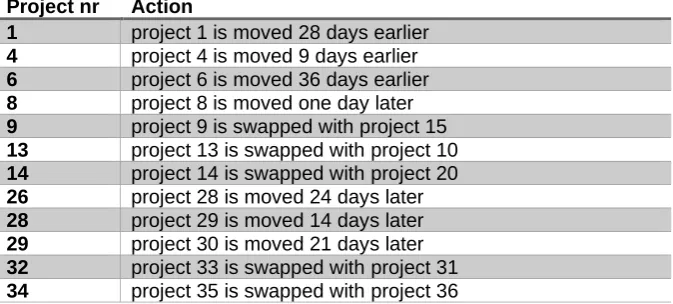
[image:19.595.73.410.547.699.2]Then the next project that had to be rescheduled was swapped or moved in order to make the planning feasible. This was repeated until the entire planning was feasible and met the constraint of one machine and holidays. All projects were swapped or moved as a whole, because in reality that would be more likely or else parts of projects would possibly be spread throughout the planning. Projects are also swapped or moved at most once, in order to limit the impact of the rescheduling. The final scenario that has been established after performing the steps described (Table 3), is shown in Appendix C.
Table 3: Rescheduling actions
Project nr Action
1 project 1 is moved 28 days earlier
4 project 4 is moved 9 days earlier
6 project 6 is moved 36 days earlier
8 project 8 is moved one day later
9 project 9 is swapped with project 15
13 project 13 is swapped with project 10
14 project 14 is swapped with project 20
26 project 28 is moved 24 days later
28 project 29 is moved 14 days later
29 project 30 is moved 21 days later
32 project 33 is swapped with project 31
The second scenario, which represents a possible future planning, includes a project with the project type airport, made in consultation with the company. This scenario was made to show the effects on the capacity demands when a project with the project type airport is acquired. In the scenario other projects also have to be carried out next to the project with the project type airport, because in reality this would also likely be the case.
The second scenario was drafted by replacing projects from the first scenario with the project type airport. This was done to maintain the composition of projects and the period when projects are planned. The projects after the construction holidays are replaced by the project of type airport. The choice for this moment is based on the current year planning, because the project of type airport is also planned in that period. The projects that are replaced are the projects with the numbers 28 to 37. The final scenario that has been drafted after the replacement of the projects can be found in Appendix D.
4.3.
Scenario analysis
The scenarios are analysed in Excel using the data of the capacity demand per project type from table 2. Each project type on every day, was coupled to its belonging capacity demand. This resulted in an overview of the capacity demand per day.
From the data it can be retrieved that often, two projects are carried out on the same day, which in reality most certainly would not take place on the same location. Therefore, two teams are needed. So, when the project is doubled, the left side of the planning is done by one team and the right side is done by another team. Moreover, the data show that on each day only one machine of each type is needed, so the rescheduling managed to solve the problem of overlap.
In the overview of the capacity demand per day, the capacity demand of both projects on the same day are added. The reason for this is, that the teams can exchange workers among each other if needed and so the composition of the teams is not fixed. Therefore, only the total capacity demand is of importance.
The only fixed thing is, that each team should have a foreman and an engine driver. Should the engine driver not be needed, he can function as a hand worker and could even be exchanged to the other team if necessary. The same applies to a foreman in case that only one project is carried out. So, if only one foreman is needed, the other foreman can function as a hand worker. Therefore, at least two foremen and two engine drivers are needed in the total capacity.
4.4.
Optimization model
The purpose of the optimization model is to calculate what the optimal composition of permanent and flex workers should be during a year while meeting the capacity demand for a certain scenario. The composition is determined by minimizing the total cost of employment of permanent and flex workers. This will describe how much workers are needed and what the ratio will be.
The optimization model was drafted using the literature about linear optimization and the multiperiod work scheduling problem from chapter 3.2. Next to that in the model, the data from the scenario analysis is used.
The model was drafted according to the same three elements as described in chapter 3.2. First the objective function was established. The objective function is the total labour costs of permanent and flex workers.
In the objective function the decision variables are the amount of permanent workers and the amount of flex workers. The decision variable of the amount of permanent workers is defined with X. The decision variables of the amount of flex workers are defined with Yt , because the day that they are hired is also of importance. This is not the case for the permanent workers because they are hired for the entire year. This leads to the following decision variables:
𝑋 = 𝑡ℎ𝑒𝑎𝑚𝑜𝑢𝑛𝑡𝑜𝑓𝑝𝑒𝑟𝑚𝑎𝑛𝑒𝑛𝑡𝑤𝑜𝑟𝑘𝑒𝑟𝑠
𝑌𝑡 = 𝑡ℎ𝑒 𝑎𝑚𝑜𝑢𝑛𝑡 𝑜𝑓 𝑓𝑙𝑒𝑥 𝑤𝑜𝑟𝑘𝑒𝑟𝑠 𝑜𝑛 𝑑𝑎𝑦 𝑡 (𝑓𝑜𝑟 𝑡 = 1,2,3 … .220)
Next to that, in this step information about the labour costs was used since this has to be optimized. The labour costs of workers are the coefficients in the objective function. The labour costs of a permanent worker are given on a yearly basis since the company hires a person for one year, so also has to pay him for one year. The labour costs for a flex worker are given on a daily basis since the company can hire a person for one day and only have to pay him for that day. This resulted in the following objective function:
𝑀𝑖𝑛 𝑧 = 125400𝑋 + 520 ∑220𝑡=1𝑌𝑡
The second step was to add the constraints to the model. These constraints are based on the scenario analysis because the information from that determines what the capacity demand of each day is. So each day the total amount of workers, which is optimized in the objective function have to meet the capacity demands of that day. The amount of workers needed on a day is described with Dt. This resulted in the following constraint:
𝑋 + 𝑌𝑡 ≥ 𝐷𝑡 (𝑓𝑜𝑟 𝑡 = 1,2,3, … ,220)
In this constraint, Dt means the demand per day. But since there are two scenarios this constraint is changed into the demands of each scenario. The demand always has to be met. So, the total capacity should be higher or equal to the demand. The value for Dt is retrieved from the data from the scenario analysis.
Besides, the amount of flex workers available during the period of the scenario is limited to two flex workers, because there are no more flex workers available at that moment. This constraint was drafted in consideration with the company. This resulted in the following constraint:
The third step was to add the sign restrictions. In this model, the decision variables can only assume nonnegative values. The reason for this is that the company cannot have a minus one worker for instance. Therefore, the following sign restriction was made:
𝑋, 𝑌𝑡 ≥ 0 (𝑓𝑜𝑟 𝑡 = 1,2,3, … ,220)
The final model in which all of the three steps are included is shown below in figure 2. This model was run by the program Lingo. The model had to be adapted to the program in order to let the model run, this Lingo model is shown in Appendix G. The Lingo model is the same for both scenarios, except the input values are different. The input values of the required capacity are different for both scenarios, so this is changed in the Lingo model. The Lingo model itself is not changed.
Figure 2: The optimization model
Besides, the occupancy rates will be determined to give an insight in the occupation of the permanent workers under the scenarios. The occupancy rate is also calculated for the previous year, so this could be compared.
This will be done by calculating the weighted average, which is the sum of the different amount of permanent workers times the days that this amount of workers is occupied. This number is then divided by the total capacity of permanent workers times the amount of days they are hired.
𝑀𝑖𝑛𝑧 = 125400𝑋 + 520 𝑌𝑡
220
𝑡=1
s.t.
𝑋+𝑌𝑡 ≥ 𝐷𝑡 (𝑓𝑜𝑟𝑡= 1,2,3,…,220) 𝑌𝑡 ≤2 (𝑓𝑜𝑟𝑡= 1,2,3,…,220)
5.
Results
The optimal capacity was determined by running the optimization model for each scenario in the program Lingo.
From the objective function could be deducted that, the preference for choosing a permanent or flex worker, was always a flex worker. The reason for this is, that a flex worker is cheaper, even when he is hired for a whole year as in the case of a permanent worker. Therefore, the use of a flex worker is always preferred if based on labour costs, since you can hire the worker only when needed. This was confirmed by the outcome of the Lingo model. This means that the constraint of the amount of flex workers available, determines the outcome of the model, thus the composition of the total capacity. The total capacity has to meet the capacity demand and therefore, the total capacity demand minus the amount flex workers, determines the amount of permanent workers. As explained before, the permanent workers are hired for the whole year. The capacity demand always has to be met, so when a permanent worker is needed for a day, he is hired a whole year. Therefore, the highest capacity demand in a year, determines the amount of permanent workers for the whole year, because on that day the demand has to be met too. The preference is a flex worker, thus the total capacity demand is met by hiring the most flex workers as possible, which is two. The rest of the demand has to be met by employing the permanent workers. These workers are then hired, which means that they are hired for the whole year.
For the first scenario the optimal capacity was determined on 10 permanent workers and a flex layer of two workers. The flex layer can be used if needed, for example, if eleven workers are needed then one flex worker can be hired. The composition of this capacity should consist of two foremen, six hand workers and two engine drivers. This is the composition with the minimal costs, but which is still able to meet the capacity demand of the projects for this scenario.
To show that the capacity demand had always been met, a graph was made. Graph 1 shows the demand on each day for a scenario and a line which represents the capacity of the company.
Graph 1: Scenario 1, Capacity demand per day
For the second scenario the optimal capacity was determined on sixteen permanent workers and a flex layer of two workers. The composition of this capacity should consist of two foremen, twelve hand workers and two engine drivers. Again here, the composition with the minimal costs is determined for this scenario.
Also, for this demand a graph was made in order to show that the capacity demand has been met. This is shown in graph 2.
0 5 10 15
1 9 17 25 33 41 49 57 65 73 81 89 97
105 113 121 129 137 145 153 161 169 177 185 193 201 209 217
Am
o
u
n
t
o
f work
ers
Day of the scenario
Scenario 1
Demand
Graph 2: Scenario 2, Capacity demand per day
Besides, the occupancy rates were calculated. The occupancy rate of the first scenario is 69.1%. The occupancy rate of the second scenario is 59,5%. The occupancy rate of the planning of the previous year was 47.0%.
0 5 10 15 20
1 9 17 25 33 41 49 57 65 73 81 89 97
105 113 121 129 137 145 153 161 169 177 185 193 201 209 217
Am
o
u
n
t
o
f worerks
Day of the scenario
Scenario 2
Demand
6.
Conclusion, discussion and recommendations
In this research, the question ‘What should the workers capacity of Strukton Civiel Noord & Oost be if they want to double their market share?’was central.The two scenarios that were drafted in this research had different outcomes on what the capacity should be. The difference between the scenarios is, that in the second scenario the project type airport is included. This results, in combination with the normal capacity demand, in that the total capacity demand is eighteen workers. This number is higher compared to the twelve workers needed in the first scenario in which the project type airport was not included. So, the project type airport causes that more workers are needed. It can be concluded that in order to double the market share, which was represented by the scenarios, twelve or eighteen workers are needed depending on the scenarios.
This means that for the scenarios, ten or sixteen permanent workers are needed, because the other two workers can be hired as flex workers if needed. In both scenarios, the composition of the capacity should consist of two foremen and two engine drivers.
At this moment their current capacity is eight workers. The current composition of this team consists of two foremen, an engine driver and five hand workers. The current capacity and the required capacity differ from each other.
To solve this, the company needs one extra engine driver and one extra hand worker in the case of the first scenario. In the case of the second scenario, the company needs one extra engine driver and seven extra hand workers. The other extra two hand workers are covered by the flex layer and can be hired if needed. This total capacity will be used to form two teams, which can exchange workers if needed. This result corresponded with the expectation that more workers are needed in order to attain the desired market share. At the same time, the expectation was, that two teams are needed, which corresponded with the result. The result also corresponded with the preference for flex workers as was described in the model. The expectation that the possibility to exchange workers between teams would lead to a more optimal solution was also right. The explanation for two teams is logical. Two projects are executed at the same moment, but at different locations. This makes that two teams are needed.
In addition, the occupancy rates were calculated to get an insight in the amount of time the hired workers actually are occupied by executing projects. To calculate this, the average was used. The occupancy rate of the second scenario is lower than the occupancy rate of the first scenario. So, by including the project type airport, the occupancy rate is lower in the case of these scenarios. Nevertheless, the occupancy rate of both scenarios is higher than the occupancy rate of the planning of the previous year, which was 47.0%.
Contribution
The theoretical contribution of this research is, that the research shows that the multiperiod work scheduling problem can also be applied in the construction sector. This sector is project based and the offer of projects is difficult to predict. However, this research showed, despite the characteristics of the sector, that the method to solve a multiperiod work scheduling problem, still can be applied to determine the optimal capacity for companies in that sector.
The practical contribution of this research is, that the amount of workers needed to achieve the doubled market share, is based on a mathematical method and not only on intuition. So, this objective research confirmed the assumptions of the company that most probably more workers were needed and two teams should be formed.
The research is also valuable in a managerial way. The results help to get insight in what is needed to double the company’s market share. It shows which decisions could be made and what possible consequences these might have. This is expressed in the occupancy rates. The increase in occupancy is favourable for the company, because the workers are working more but the company does not have to pay them more.
Shortcomings and restrictions
The methodological limitation of this research is that certain scenarios are used. The scenarios predict a possible future. However, the occurrence of this scenario is uncertain. The optimal capacity is determined based on these scenarios, thus the scenarios determine the outcome. Therefore, the scenarios are a rather large assumption. Still, the choice for this, is well considered, since the future offer of projects is very unpredictable and therefore the future planning as well.
Besides, a practical limitation is that the workers are now valued on their cost and not on their knowledge or efficiency. With knowledge is meant that workers have certain knowledge about constructing concrete roads and experience with the working methods of the company. Permanent workers are able to obtain this experience and knowledge because they are attached to the company through a permanent contract. On the opposite, flex workers do not have the same knowledge or experience with the company’s methods. It is needed to have permanent workers with specific knowledge and experience. However, these elements were not included in the model. The model is only focused on costs, which would lead to only having flex workers because they are cheaper. But the company can not carry out projects with only flex workers, because knowledge is needed and the model does not take this into account.
Future directions and recommendations
Further research could therefore include or focus on the knowledge and efficiency factors that were excluded in this research. Besides, further research could focus on exploring a way to determining a more certain scenario for the future. With a more certain scenario is meant that the scenario is based on more information and that the projects that are in the scenario are more likely to be carried out in the future.A similar research could then be carried out, to determine the optimal capacity with the same method as used in this research. The better the scenario fits the possible reality, the more the company can profit from the optimisation.
References
Baiden, B., Price, A. D., & Dainty, A. R. (2006, January). The extent of team integration within construction projects. International Journal of Project Management, 24(1), 13-23. doi:10.1016/j.ijproman.2005.05.001
Hegazy, T. (1999, June). Optimization of Resource Allocation and Leveling Using Genetic Algorithms.
Journal of Construction Engineering and Management, 125(3), 167-175. doi:10.1061/(ASCE)0733-9364(1999)125:3(167)
Kandil, A., El-rayes, K., & El-Anwar, O. (2010, January). Optimization Research: Enhancing the Robustness of Large-Scale Multiobjective Optimization in Construction. Journal of Construction Engineering and Management, 136(1), 17-25.
Leu, S.-S., Yang, C.-H., & Huang, C. (2000, November). Resource leveling in construction by genetic algorithm-based optimization and its decision support system application. Automation in Construction, 10(1), 27-41. doi:10.1016/S0926-5805(99)00011-4
Raiden, A. B., Dainty, A. R., & Neale, R. H. (2004, May). Current barriers and possible solutions to effective project team formation and deployment within a large construction organisation.
International Journal of Project Management, 22(4), 309-316. doi:10.1016/j.ijproman.2003.08.002
Senounci, A. B., & Eldin, N. N. (2004, December). Use of Genetic Algorithms in Resource Scheduling of Construction Projects. Journal of Construction Engineering and Management, 130(6), 869-877. doi:10.1061/(ASCE)0733-9364(2004)130:6(869)
Veludurthi, M. K., Anup, W. S., & Sridevi, H. (2017). Comparative Study of Time-Cost Optimization.
International Journal of Civil Engineering and Technology, 8(4), 659-663.
Appendices
Appendix A
List of problems:
• Capacity is not large enough
• Not enough workers/teams employed • How will the composition of teams look like • The “knowhow” is difficult to pass on • The type of work is not wanted • The utilization rate of machines is low • Which projects have to be selected • The planning is not optimal
Appendix B
Week Date Project Type of work Type of work Project
number Team 1 Team 2 number
8 20-Feb
21-Feb
22-Feb
23-Feb
24-Feb
9 26-Feb
27-Feb
28-Feb
1-Mar
2-Mar
10 5-Mar
6-Mar
7-Mar
8-Mar
9-Mar
11 12-Mar
13-Mar
14-Mar
15-Mar
16-Mar
12 19-Mar Print concrete 52
20-Mar Print concrete 52
21-Mar 1 Bicycle roads Print concrete 52
22-Mar 1 Bicycle roads Print concrete 52
23-Mar 1 Bicycle roads Print concrete 52
13 26-Mar 1 Bicycle roads Print concrete 52
27-Mar 1 Bicycle roads Print concrete 52
28-Mar 1 Bicycle roads Print concrete 52
29-Mar 1 Bicycle roads Print concrete 52
Good Friday 30-Mar Print concrete 52
Easter 14 2-Apr
3-Apr 1 Bicycle roads
4-Apr 1 Bicycle roads Bicycle roads 1
5-Apr 2 Curbs Bicycle roads 1
6-Apr 2 Curbs Bicycle roads 1
15 9-Apr 2 Curbs Bicycle roads 1
10-Apr 2 Curbs Bicycle roads 1
11-Apr 3 Bicycle roads Bicycle roads 1
13-Apr 4 Curbs
16 16-Apr 5 Bicycle roads
17-Apr 5 Bicycle roads Bicycle roads 1
18-Apr 5 Bicycle roads Bicycle roads 1
19-Apr 5 Bicycle roads Curbs 2
20-Apr 5 Bicycle roads Curbs 2
17 23-Apr 5 Bicycle roads Curbs 2
24-Apr 5 Bicycle roads Curbs 2
25-Apr 6 Curbs Bicycle roads 3
26-Apr 6 Curbs Curbs 4
Kingsday 27-Apr Curbs 4
18 30-Apr 6 Curbs Bicycle roads 5
1-May 6 Curbs Bicycle roads 5
2-May 7 Print concrete Bicycle roads 5
3-May 7 Print concrete Bicycle roads 5
4-May 7 Print concrete Bicycle roads 5
19 7-May 8 Curbs Bicycle roads 5
8-May 8 Curbs Bicycle roads 5
9-May 8 Curbs Curbs 6
Ascension day 10-May Curbs 6
Free 11-May
20 14-May 8 Print concrete Curbs 6
15-May 9 Print concrete Curbs 6
16-May 8 Print concrete Print concrete 7
17-May 8 Curbs Print concrete 7
18-May 8 Curbs Print concrete 7
Pentecost 21 21-May Curbs 8
22-May 8 Roundabout Curbs 8
23-May 8 Roundabout Curbs 8
24-May 8 Roundabout
25-May 8 Roundabout
22 28-May 9 Curbs Print concrete 8
29-May 9 Curbs Print concrete 9
30-May 9 Curbs Print concrete 8
31-May 10 Print concrete Curbs 8
1-Jun 11 Print concrete Curbs 8
23 4-Jun 11 Curbs
5-Jun 12 Print concrete Roundabout 8
6-Jun 11 Print concrete Roundabout 8
7-Jun 13 Roadside concrete Roundabout 8
8-Jun 14 Roadside concrete Roundabout 8
12-Jun 15 Print concrete Curbs 9
13-Jun 15 Print concrete Curbs 9
14-Jun 15 Print concrete Print concrete 10
15-Jun 16 Print concrete Print concrete 11
25 18-Jun 15 Print concrete Curbs 11
19-Jun 17 Print concrete Print concrete 12
20-Jun 17 Curbs Print concrete 11
21-Jun 17 Curbs Roadside concrete 13
22-Jun 17 Curbs Roadside concrete 14
26 25-Jun 18 Print concrete Curbs 14
26-Jun 19 Print concrete Print concrete 15
27-Jun 20 Bicycle roads Print concrete 15
28-Jun 20 Bicycle roads Print concrete 15
29-Jun Print concrete 16
27 2-Jul 21 Print concrete Print concrete 15
3-Jul 22 Print concrete Print concrete 17
4-Jul 22 Print concrete Curbs 17
5-Jul 23 Print concrete Curbs 17
6-Jul 23 Print concrete Curbs 17
28 9-Jul Print concrete 18
10-Jul 24 Curbs Print concrete 19
11-Jul 25 Print concrete Bicycle roads 20
12-Jul 25 Print concrete Bicycle roads 20
13-Jul 26 Bicycle road
29 16-Jul 26 Bicycle road Print concrete 21
17-Jul 26 Bicycle road Print concrete 22
18-Jul 26 Roadside concrete Print concrete 22
19-Jul 26 Roadside concrete Print concrete 23
20-Jul 27 Print concrete Print concrete 23
30 23-Jul 28 Bicycle road
24-Jul 28 Bicycle road Curbs 24
25-Jul 28 Roadside concrete Print concrete 25
26-Jul 28 Roadside concrete Print concrete 25
27-Jul Bicycle road 26
31 30-Jul 29 Curbs Bicycle road 26
31-Jul 29 Curbs Bicycle road 26
1-Aug 30 Print concrete Roadside concrete 26
2-Aug Roadside concrete 26
3-Aug 30 Print concrete Print concrete 27
32 6-Aug Bicycle road 28
Construction holiday 7-Aug Bicycle road 28
Construction holiday 8-Aug Roadside concrete 28