http://wrap.warwick.ac.uk/
Original citation:
Lu, Dawei and Ertek, Gurdal. (2015) Perception gap and its impact on supply chain performance. International Journal of Business and Supply Chain Modelling, Volume 7 (Number 2). pp. 122-140.
Permanent WRAP url:
http://wrap.warwick.ac.uk/68050
Copyright and reuse:
The Warwick Research Archive Portal (WRAP) makes this work of researchers of the University of Warwick available open access under the following conditions. Copyright © and all moral rights to the version of the paper presented here belong to the individual author(s) and/or other copyright owners. To the extent reasonable and practicable the material made available in WRAP has been checked for eligibility before being made available.
Copies of full items can be used for personal research or study, educational, or not-for-profit purposes without prior permission or charge. Provided that the authors, title and full bibliographic details are credited, a hyperlink and/or URL is given for the original metadata page and the content is not changed in any way.
Publisher statement: © Inderscience 2015
http://dx.doi.org/10.1504/IJBPSCM.2015.069919
A note on versions:
The version presented here may differ from the published version or, version of record, if you wish to cite this item you are advised to consult the publisher’s version. Please see the ‘permanent WRAP url’ above for details on accessing the published version and note that access may require a subscription.
Page 1
Perception Gap and Its Impact on Supply Chain Performance
Dawei Lu* WMG,
University of Warwick,
IMC Building, Coventry, CV4 7AL, UK Fax: +44 (0) 24-76524307
E-mail: [email protected] *Corresponding author
Gürdal Ertek
Faculty of Engineering and Natural Sciences, Sabancı University
Orhanlı, Tuzla, 34956, Istanbul, Turkey Fax: +90 (216) 483-9550
E-mail: [email protected]
Abstract
The main purpose of this paper is to frame the perception differences between the buyer and supplier on the supply chain’s operational delivery, and to investigate their causal relation to the overall supply chain performance. A conceptual 3-Level Model is developed to theorise the structural existence of the perception gaps in primarily a dyadic buyer-supplier setting. Using the primary data gathered through a major survey exercise, confirmative factor analysis and structural equation modelling were conducted to test the hypotheses on the significance and relevance of the perception gaps in supply chain management. This study provides a better conceptual understanding of the perception differences on the required as well as achieved operational deliveries within the supplier-buyer dyad, and reveals their significant and negative causal impact on the overall supply chain performance.
Keywords: perception gaps, supply chain performance management, supply chain integration.
Classification: Research paper
1. Introduction
Page 2
tactical, and operational levels (Lu, 2011a; Jayaram, et al., 2010). Such alignment requires inter-organisational collaboration and integration to achieve optimised balance between cost and benefits, efforts and reward, investment and returns across the entire supply chain (Flynn and et al., 2010; Fawcett and Magnan, 2002). It also calls for strategic alliance, high level of trust, and a culture of close partnership (Böhme and et al., 2008; Swink and et al., 2007). Despite the extensive literature coverage on a whole range of factors that might affect the supply chain performance and ultimately supply chain success (Lu, 2011b), one stone, which appears to have been left unturned, is the impact of perception gap in terms of the differences that the supplier and buyer are expecting from each other on whole range of the operational performance measures. To further clarify the notion of the term and to distinguish it from other similar meanings in other research fields such as psychology and philosophical (Strawson,1988; Yaniv and Shatz,1988; Brewer,1996), we define a narrow notion of perception gap as:
The discrepancies between buyers’ and suppliers’ perceptions on each other’s operational
delivery standards and performances within any pair of supplier-buyer dyad of a supply
chain.
However, the definition can also be generalised into a more useful wider notion of perception gap as:
The discrepancies between any participating members’ perceptions on what’s need to be or
have been delivered, performed or achieved in the part of the supply chain.
Thus, in this research, the perception gap is focused on the wider differences of opinion towards the operational performance that the other parties in the supply chain are supposed to deliver or have been delivering. Such a wider notion surely not only covers the narrow notion, but also more importantly extends it from the dyadic fulfilment difference to a more general cognitive difference. Two suppliers of the same buyer may have different
perceptions on the buyer’s strategic intention for a newly developed product; even two divisions in the same supplier may show discrepancies on the perceptions of the intended quality standards by the buyer.
Page 3
perception gaps may have impacted upon the supply chain performance. However, the lack of literature in the area is only part of the motif for the research. The more important motif lies in the largely ignored theoretical relevance and causal relationship with overall supply chain performance. This theoretical shortfall could impede supply chain performance and obscure managers’ thorough understanding of the root-cause of many supply chain
management problems. It is, therefore, the authors’ primary aim to fill this apparent research gap and to provoke more in-depth and exploratory discussion of the topic.
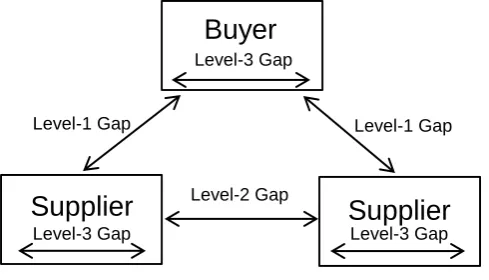
[image:4.595.167.412.495.635.2]The premise of this research is largely based on the authors' hypothesized conceptual model in Lu et al. (2013) that the perception gap, in terms of wider definition, exists in three different levels. Considering any dyadic link between two tiers – the supplier tier and the buyer tier, the perception gap can be illustrated and framed by a 3-Level Gaps model as shown in Figure 1. The model shows the different components of perception gaps within a dyadic pair. As one of the research findings, the analysis in the sequel has positively verified the significant existence of such perception gaps at all three different levels, albeit testifying the mere existence of the perception gap only fulfils a small part of the research objectives. What’s more important is to explore and verify that the perception gaps at different levels may or may not impact upon the different aspects of supply chain behaviour. Supply chain performances are likely to be causally related to the different types of perception gaps. This leads to another set of hypotheses to be discussed in the later sections.
Figure 13-Level Perception Gaps Model
The Level-1 perception gap represents the perception difference in between suppliers and buyer on mainly what needs to be delivered to the buyer; the Level-2 perception gap
represents the discrepancies in between the different suppliers’ perceptions on the intended quality standard and service level from the same buyer; and the Level-3 perception gap
Level-3 Gap
Buyer
Supplier
Supplier
Level-3 Gap
Level-1 Gap Level-1 Gap
Page 4
represents the differencesin between the different functions’ or even different peoples’ perceptions within the same supplier or buyer on what was required and how they are performing in order to satisfy the external parties’ demand (Lu et al., 2013).
The model basically defines the three categorised sources of perception gaps and maps them to their corresponding supply chain management problems, namely: Level-1gap is linked to the buyer-supplier coordination; Level-2 gap is linked to the rationalisation within the supply base to achieve the consistency and harmony in between suppliers horizontally; Level-3 gap links to the participating organisation’s internal congruence and communication
effectiveness. As such, arguably the model suggests a theoretical point that the supply chain behaviours in coordination and relationship are intricately related to a psychological
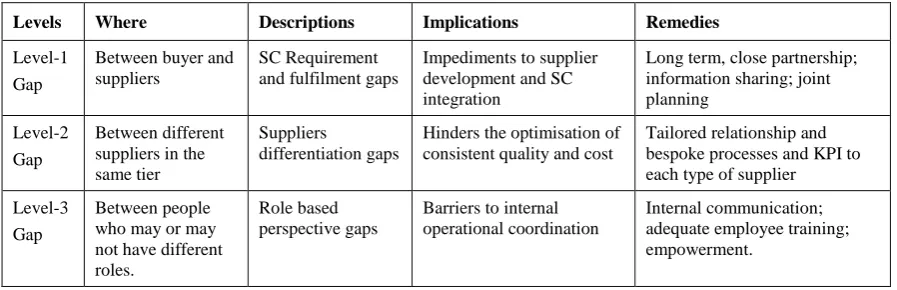
[image:5.595.71.520.583.728.2]dimensional measure called perception. Based on the Comprehensive Theory of Perception proposed by David Huron (2006), perceptions do directly evoke behavioural consequences in various forms of psychological phenomena. According to the theory, accurate expectations are adaptive mental functions that allow organisms to prepare for appropriate actions and perceptions; the emotions accompanying expectations are intended to reinforce accurate prediction, promote appropriate event-readiness, and increase the likelihood of future positive outcomes. (Hurun, 2006, page 4). Thus it is fair to say when the perceptions are not formed from the accurate anticipation; they may evoke poor event-readiness and negative outcomes. The model could also provide guidance on linking from practical managerial problems to the possible root causes arising from the perception gaps. Avoiding extensive elaboration, the characteristics of the perception gaps and their implications in supply chain management can be described in Table 1 (Lu et al., 2013).
Table 1. The 3-Level Gaps Model and its implications
Levels Where Descriptions Implications Remedies
Level-1 Gap
Between buyer and suppliers
SC Requirement and fulfilment gaps
Impediments to supplier development and SC integration
Long term, close partnership; information sharing; joint planning
Level-2 Gap
Between different suppliers in the same tier
Suppliers
differentiation gaps
Hinders the optimisation of consistent quality and cost
Tailored relationship and bespoke processes and KPI to each type of supplier Level-3
Gap
Between people who may or may not have different roles.
Role based perspective gaps
Barriers to internal operational coordination
Page 5
In spite of the relatively simple form of the definition intuitively understandable concepts, the implication of the perception gap and its possible causal relation with the supply chain
performance remain unclear and un-investigated. Thus the following critical research questions need to be addressed:
Is there any causal link between the perception gap and the key supply chain performance measures? Or is the perception gap a latent factor that affects the performance shortfalls significantly?
How substantive is the impact of perception gap on the measured or observed supply chain performance?
Is the perception gap an independent, unique and non-captive factor that needs to be recognised on a theoretical basis?
Hence, the objectives of this paper are as follows:
a) to examine the significant existence of the latent factor called perception gap as defined above through observed indicators;
b) to test the causal connection between the perception gaps as a model construct and the observed supply chain performances;
c) to develop a better understanding on how perception gap plays its role in supply chain performances.
Furthermore, an unintended objective could be to explore a new research dimension where the established psychological and emotional behaviour theories such as ‘A Comprehensive Theory of Expectation’ (Huron, 2006) can be applied into the domain of organisations and supply chains instead of organisms. It is therefore anticipated that the limited contribution of the article would be on constructing a psychological component into the underpinning theory of supply chain performance of integration. The methodological design taken to achieve these objectives is first, to construct empirical conceptual model based on the past collective knowledge and literature reviews, arguing the research gap and its deservedness for attention; second, to design the measurement instruments and collect first-hand data to form the
Page 6
the validity of the model constructs, analyse their relationship such as regression loadings, and try to come to terms of the causality from perception gap to supply chain performance. The remainder of the paper is organised as follows. Section 2 provides a brief review of the relevant literature as the conceptual background, along with some critical discussions leading to hypotheses propositions. Section 3 discusses the methodological issues including the survey, the data collection, and the choices of analysis methods. Section 4 is devoted to the data analysis by using CFA and SEM. Section 5 summarises the findings from a theoretical perspective and discusses their managerial implications. Section 6 draws conclusive remarks from the research, outlines the limitations and foresees further works.
2. Literature review
The topic of perception gap and its impact on supply chain performance appear to have not yet formed a recognisable body of knowledge, nor have the researchers developed
fundamental theorised models. Notwithstanding that perception gap and supply chain performance separately have already been widely discussed and researched in several different contexts. However focused research specifically investigating the significance and relevance of perception gap as defined in this research remains uncommon. For instance, a test-run of Google Scholar search on the combined terms of ‘perception gap and
performances gap’ returns no directly applicable result. Nevertheless, indirect studies in the related areas appear to have no shortage of literature evidences. Many of such research outputs were largely in the field of psychology and philosophy. Liggio (1974) applied the term “expectations gap” to auditing and how it might be live up to the public expectations to the business. Porter (1993) also ascribed to the expectation gaps in the context of increased litigation and the threat of lost governance. Sporadic research studies on perception gaps and their impacts on some specific business areas have brought some encouraging development in theory as well as tangible values in practice. For example, research conducted for the
Page 7
In a very different research area of manufacturing, Silver and Vegholm (2009) discussed the issues of providing service to customers in order to meet their “expectations”. The desired outcome of such dyadic relationship is the high standard of product and service quality that leads to customer satisfaction (Kessler, 1995; Betts, et al., 2011). As a result of this
interaction, the buyer will make evaluations based on its judgment of the product or service received from the suppliers, and will compare the performance with its initial expectations. The customers’ perception is the behavioural outcome of their experience on the overall capability of the suppliers (Gagliano and Hathcote, 1994). Thus one can understand that the buyer’s perception is based on its evaluation of the service received. When the perceived performances are lower than the expectations, it is a sign of poor service or product quality by the suppliers; and the reverse indicates good quality and service standard. The perception or the perceived quality is the overall judgment on the supplied products or services.
However, prior to their experience, buyers create expectations, against which the supplier’s performance is evaluated (Coye, 2004). Consequently, perceptions involve the subjective response of people and are therefore highly likely to be inconsistent with the reality or that of the supply chain partners (Parasuraman et al., 1985). All these observations from the
literature serve as the empirical evidence for the possible existence and close relevance of the perception gaps with supply chain performance.
Looking further beyond, according to the disconfirmation theory, which is most widely used and accepted theory to explain satisfaction and service quality (Johnston, 1995, 2008), the customer’s feeling of satisfaction/dissatisfaction with his service encounter is related to the magnitude and direction of the disconfirmation experience. The disconfirmation is related to the person’s initial perceptions (Walker, 1995) formed prior to the purchasing/consumption. When the supplier’s performance is better than the expectation (which is not necessarily uniform across buyers) it yields a positive disconfirmation. Conversely, when the supplier’s performance is poorer than the expectation, it yields a negative disconfirmation. Our research links this disconfirmation, which we refer to as “performance gap”, to the gap in the initial expectations, which we refer to as “perception gap”.
Page 8
discrepancy between perception and reality results in a contrast effect. According to the assimilation theory, people tend to respond according to their expectations because they are reluctant to admit wide discrepancies (Bridges, 1993; Lu and Betts, 2011). Perception and expectation also have a direct effect on the emotions of the parties participating in the supply chain relationship. People involved in the relationship experience pleasant or unpleasant emotional state depending on their expected levels of satisfaction (Vinagre and Neves, 2007). While framing the issues around perceptions and experiences, the above mentioned research studies appear to have fallen short of illustrating the linkage between the contrast in
expectations (perception gaps), and the contrast in experiences (performance gaps). From another angle, it can be observed that supply chain integration is becoming an
increasingly critical factor in today’s pursuit of business excellence (Kannan and Tan, 2010; Margetta, 1998; Lu, et al., 2011). The magnitude of the perception gaps, or in other words the level of harmonised expectations in between the supply chain members, reflects how well the supply chain is integrated (Akkermans et al., 1999; Rosenzweig et al., 2003; Sun, et al., 2009). On the other hand, a well-integrated supply chain can only be so verified if and only if it delivers the desired performance that satisfies the customer expectation (Gimenez and Ventura, 2003; Frolich and Westbrook, 2001). The factors associated with perception gap, integration, and performance gap are part of the same system and are inextricably interwoven together. Thus, they must be treated together systematically. However, studies with such a system approach appear to be few and far in between.
The brief review above indicates that the research on how the perceptions of both customers and suppliers and their differences can affect the supply chain performance is clearly
underexplored; and its relevance to the evolving theories on supply chain performance management is even more important Thus, this paper aims at a better understanding that may lead to narrowing the gap through theoretical analysis and modelling between the perception gaps and performance gaps. The anticipated unique research contribution is to create an alternative and complementary approach, in both concept and practice, to address the critical issues of supply chain performance shortfalls.
Page 9 3.1 Choices of methodologies
To verify the three main perception gaps in the supply chain context (Figure 1), the
confirmatory factor analysis (CFA) was chosen. Essentially the CFA is a type of structural equation modelling (SEM) that deals specifically with measurement models (rather than structural models), which covers the relationships between observed measures or indicators from the surveyed data and the latent variables or factors from the conceptual modelling (Brown, et al. 1998; Floyd and Widaman, 1995). A fundamental feature and the most common application of CFA is its hypothesis-driven nature (Cox, et al. 2002; Thurston, 1947), which fits precisely to the needs of this research.
For the exploration of the possible causal relationship between the perception gaps and supply chain performance, we used structural equation modelling (SEM) (Spearman, 1904). Typically, SEM is an effective modelling tool, which could be very helpful in exploring causal relationship and structures of multiple factors (Bentler, 1988). The explicit distinction between factors and indicator in SEM allows one to test a wide range of hypotheses. Thus, in this research SEM is used to test the hypotheses that the perception gaps do have significant but negative impact on the supply chain performance.
3.2 Survey and data collection
The survey was carried out to a sampled population of 232 individual respondents from 14 client companies as part of a global supply chain performance improvement project from June to November 2011. A key component of the project was examining the causal link between the perception difference and the collective supply chain performance.
Page 10
Every respondent was asked to complete an on-line questionnaire which consists of nine statements to be evaluated in a Likert Scale of 1 to 9. The respondent population was a mixture of managers in different levels, such as team leaders, line-managers, and senior managers and so on. The questionnaire is shown in the Appendix where each statement (or question) constitutes a measurement instrument that delivers an observed measure. Although the data are collected from 14 different companies, the research makes no distinction between companies, simply because the hypotheses to be tested are not specific to any individual companies.
[image:11.595.65.535.377.497.2]The data has then been screened to ensure that there are no significant missing data and the independent observable variables are normally distributed (normality tests) by using Skewness & Kurtosis test and Shapiro-Wilk test. The resultant characteristics of the nine observable variables are as given in Table 2.
Table 2. Results of the Skewness & Kurtosis and Shapiro-Wilk tests
LV1_a LV1_b LV1_c LV2_a LV2_b LV3_a LV3_b PF_a PF_b
Skewness Statistics
0.374 0.257 0.298 -0.212 -0.466 0.314 0.210 -0.501 0.337
Std. Error 0.363 0.235 0.302 0.321 0.487 0.299 0.233 0.493 0.389 Z - value 1.03 1.09 0.98 -0.66 -0.95 1.05 0.90 -1.01 0.86
Kurtosis Statistics
-0.112 0.265 0.611 -0.426 0.635 -0.534 0.245 -0.424 0.323 Std. Error 0.125 0.289 0.578 0.454 0.553 0.564 0.217 0.409 0.291 Z - value -0.89 0.92 1.06 -0.94 1.15 -0.95 1.13 -1.04 1.11
As shown in the table all the Skewness & Kurtosis z-value for the variables are within the span of -1.96 to 1.96 (Cramer, 1998; Cramer & Howitt, 2004). And the follow-up Shapiro-Wilk test shows all the p>0.05 (Shapiro and Shapiro-Wilk, 1965; Razali & Wah, 2011). These test result show that our observed data are a little skewed and kurtotic for the 9 independent variables, but they do not differ significantly from normality. The consistency reliability of the data, which measures the degree to which responses are consistent across the items within a measure, has been checked by using Cronbach’s alpha. For the four constructs, the four Cronbach’s alpha results are: 0.72; 0.81, 0.74. 0.77 (against the criteria of >0.70).
Page 11 4.1 CFA Analysis
With the already conceptualised 3-Levels Gaps Model, we first consider a first-order
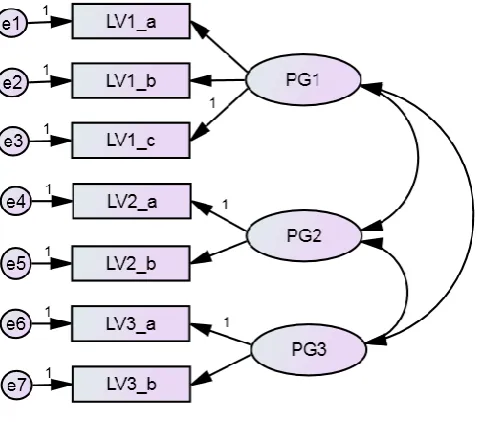
[image:12.595.118.357.237.449.2]confirmatory factor analysis model as shown in Figure 2. The purpose of the CFA is used to verify the structure of the measurement model. A precondition of CFA is the multivariate normality of the indicators’ data. In the model, all the rectangles represent the indicators and ovals represent the latent factors, and the rounds for unique variables such as errors.
Figure 2. First-order CFA model for perception gaps
This model asserts that the three observed measures (indicators) LV1_a, LV1_b and LV1_c depend on an unobserved variable or latent factor PG1, which represents the Level-1 perception gap in the 3-Levels Gaps Model. And similarly:
The two observed measures LV2_a and LV2_b depend on the PG2. The two observed measures LV3_a and LV3_b depend on the PG3.
Page 12
research. According to the model, every observation measure is determined by a relevant latent factor as an underlying variable that determines at least partially the outcomes of those observation measures. The model also postulates that the measures may also depend on something other than the latent factors. In the case of LV1_a, for example, the unique variable e1 is also involved. e1 represents any and all influences on the LV1_a , which are not shown elsewhere in the path diagram. It also, very importantly, represents the
measurement error that is likely to arise during the data gathering processes. The three latent variables are called the common factors because each of them is common to a number of observed indicators, whilst the seven ‘error’ variables are the unique factors since they only affect one observation test. The model also assumes that the unique factors are not
significantly correlated with each other or with the latent factors.
The path diagram model in Figure 2 is created by using IBM SPSS Amos 20 software. The parameter estimation was based on the maximum likelihood (MI) procedure. The fit of the model was measured using Goodness-fit Index (GFI), Adjusted Goodness-of-fit Index (AGFI), and Comparative Fit Index (CFI). The regression coefficients are
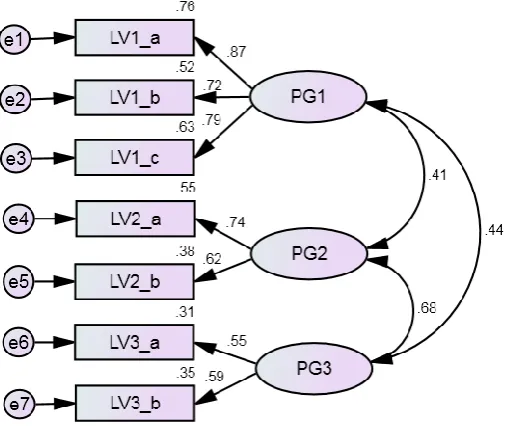
Page 13 Figure 3. CFA standardised results
The computation of the positive degree of freedom makes the model identifiable as the unit scaling has been assigned already. Number of distinct sample moments is 28, number of distinct parameters to be estimated is 17, and the degrees of freedom is (28 - 17) =11.
Here the ‘sample moments’ means the number of known parameters, such as the total number of variance and covariance of the variables. The GFI = 0.953; CFI = 0.940; have exceeded the 0.90 level indicating a good model fit (Bentler and Bonett, 1980). However, the Tucker-Lewis Index TLI = 0.93, which is just slightly below the threshold at > 0.95 (Hu and Bentler, 1999). The discrepancy degree of freedom ratio χ2 /df = 27.89/11=2.54 is not much higher
Page 14
The Squared multiple correlations can be interpreted as the estimated reliability of each of the observed variables. To take LV1_a as an example, 76% of its variance is accounted for by PG1 – the Level-1 perception gap. The remaining 24% of its variance is accounted for by the unique factor e1. If e1 represented measurement error only, we could say that the estimated reliability of LV1_a is 0.76. The resultant regression weights on the single directional paths show how much proportionally the latent factor affects the observed factor. For example, a regression rate of 0.65 means that a change in magnitude of 1 will result in 0.65 magnitude of change in the observed factor.
To summarise, the CFA analysis has positively tested with a high degree of confidence that the three factors of perception gap fit to the observed indicators well; the model-based ‘common factor’ hypotheses generally tested positive. We can state with confidence that there do exist the three latent factors that represent the perception gaps in the buyer - supplier dyad.
4.2 SEM Analysis
The question of how does the perception gap impact upon the supply chain performance is better to be analysed through the structural equation modelling (Anderson and Gerbing, 1988). Based on the literature review discussed above and the authors’ priori knowledge in supply chain management, it is convincingly evident that the perception gap represents a negative factor to the supply chain performances. In other words, where there are more perception gaps between members of the supply chain on all types of performance delivery matters, there are poorer standards of performance. However, this argument can only be a hypothesis at this point unless it is tested otherwise. The structural part of our model is precisely designed for such a test and SEM appears to be the only suitable methodology in this context.
Page 15
shortfall surely will also be affected by other systematic and unique factors that are not specified in the model. We use ‘e8’ to represent them (see Figure 4). It is important to notice that in the key structure of the model the single-headed arrows are pointed from the
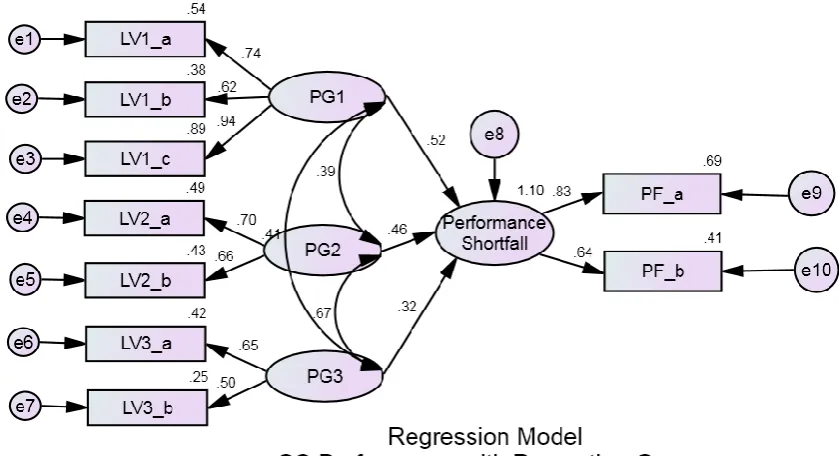
perception gap factors and towards the performance shortfall, indicating that the ‘perception shortfall’ is the ‘Formative Second-Order construct’ with the three ‘Reflective First-Order constructs’ representing the three perception gaps. . In the meantime, the ‘Performance Shortfall’ is also a reflective measurement model on itself with two measurement indicators. It is clear that all the latent factors are built on a reflective model with arrow-heads pointing from the indicators towards the factors. However the structural model, which represents the relations between the latent factors, is a second-order formative model. The SEM model constructed here is basically to test the significance or validity that the performance shortfall is causally associated with the perception gaps.
Statistically, as shown in Figure 4, what the SEM trying to achieve is a regression model of the performance shortfall with the unobserved factors of performance gaps at the three different levels. The coefficients of the regression indicate how much of the performance is negatively influenced by the perception gaps (a negative influence on the performance is interpreted as a positive influence on the performance shortfall). The answer to this question will surely reveal a better understanding of the causal factors to the supply chain
performance.
Again, like CFA, we use IBM SPSS AMOS 20 software to analyse this relationship part of the model (Figure 4). SME is appropriate for complex multivariate data and testing
hypotheses regarding relationships among observed and latent variables (Hoyle 1995). In testing the formative constructs, as partly in our model, there are two general causal
Page 16
Figure 4. SEM modelling for relationship between performance gaps and performance shortfall.
The result of the SEM analysis shows an acceptable overall fit statistics: χ2 of 55.28 and the
Page 17
1995). The most convincing test for the appropriateness of such theoretical consideration is the goodness of the model fit. The above analysis shows an adequate level of model fit.
5. Discussion of Implications
The above analysis has led to a number of interesting theoretical issues that can be compared or debated with the existing body of knowledge.
The first issue is about the significant role that psychological theory played in influencing the supply chain performance or performance shortfalls as defined in the model. Established theories about supply chain performance are largely based on their relationships with multiple dimensional constructs such operational design, networking structure, technical and finance resources, strategic fitness/effectiveness, and market positioning and so on. None of them, however, have factored-in the psychological effects such as perception differences and what they may evoke as a result. The result of the above analysis has at least served as strong evidence that supply chain performance depends on how the psychological perimeter is managed. It further raises the further theoretical question on whether an organisation or a supply chain can be modelled as an organism that has psychological emotions that in turn determines its performances.
Page 18
How relevant is the issue of perception gaps in managerial practices? The above research analysis supports that it is critical to the supply chain performance. Its impact on customer satisfaction and overall supply chain achievement appears to be far more important than we originally thought. We have now a lot more ground to argue that perception gap focused approach towards supply chain performance is a new way to understand and manage supply chain performance; not to replace but to complement existing theories and practices.
However, it is conceivable that such renewed understanding may have the implications on the shift of focal area for supply chain performance improvement. Notwithstanding the
importance of many existing performance improvement approaches and tools such as total quality initiatives, six sigma, agile supply chain, demand management, lean process, partnering and alliances, and etc., perception gap centred approach offers a fresh
psychological behaviour dimension whereby one can addresses one of the root-causes of why performances are often fall short of customer expectation.
There may be direct strategy and policy implications for supply chain performance
management too. Perception gaps and their identification must be taken into account when high-standard supply chain performance is to be achieved. The magnitude on narrowing or closing the perception gaps ought to be seen as a key performance indicator in supplier development. Cross-communication amongst the supply chain partners to establish systems for objective performance measurement should be used as a policy instrument to improve supply chain performance.
Cascaded from the points above, more widely associated managerial implications may also be explored. Although the data tested and analysed in this research were sourced from limited industrial sectors, the nature of the findings and their managerial implications appear to be generic and likely to transcend the specific domain. The logic of validity of this
research follows a typical inductive research approach whereby general inferences are induced from particular instances, and a theory is developed from the observation of empirical reality. The following extended implications from the research all appear to be significantly and directly relevant to the practice of supply chain performance management.
1. Whilst there is a plethora of literatures talking about information sharing,
Page 19
expectations could serve as the key indicators to the effectiveness of information sharing and supply chain wide integration.
2. It can also be argued that the overall goal attainment of a supply chain is only
logically possible if and only if when everyone in the supply chain have converged to a consistent understanding of the required performances and the harmonised
expectations of the goals and targets. In other words, perception gaps as the major hindering factor in the SCM must be eradicated first or kept at minimum at a priority before even it is possible to address other improvement issues.
3. Perception gaps, as a result of different expectations on the performance targets and/or assumed capabilities arguably will create a raft of conflicting views on how the operational processes should be designed and managed. This will consequently
engender some undesirable relationship issues, and over time lead to much lowered level of mutual trust in between the partners. Thus, instead of generally promoting the importance of relationship and trust in between the partners, managers now have more tangible measures to get started.
4. If the perception differences are about the suppliers’ and buyer’s business capacities in terms of product design, manufacturing capacity, quality and service, then there could be a serious consequence on the resource planning. In other words, the alignment and optimisation of the supply chain structural configuration can be seriously compromised by the presence of the perception gaps. A poorly optimised supply chain alignment will only deliver lower-than-standard performance. It may also affect resource allocation and cost-to-serve delivery. Perception gaps can
therefore be the underlying hampering factor for developing deeper understanding of how supply chain should be integrated.
7. Conclusions
It can be concluded that the supply chain perception gaps have some significant causal relation to the performance shortfalls experienced in the supply chain management – a quite definitive answer to the first research question in section 1. The significance of causality may differ from one performance to another. However, this research demonstrates a
Page 20
statistical confidences – a clear answer to the second research question. Both CFA and SEA analyses verified that the perception gaps are the latent factors that are independent, unique and non-captive in its role of influencing the supply chain performance. Thus the answer to the third question. This finding implies a new theoretical dimension whereby supply chain performance improvement could be better achieved in a more effective way. This dimension is the supply chain’s psychological behavioural dimension where human perceptions, and the conflict of them, could evoke emotionally charged judgement and adversarial undertaking. So far, no theoretical attention in supply chain performance appears to have been drawn towards that dimension yet. Admittedly, working on the perception gaps dimension is only complementary not mutually exclusive to other established theories and practices.
There are also some limitations to the current research. The research data consists only of the organisations that we have prior relationship with and is not specifically coherent in terms of the type of business. It would be interesting to apply the similar research to a group of businesses in a specific business segment and specific channel positions to reveal more specific nature of the perception gap and their influences to the supply chain performance. Also, more sophisticated test and goodness of fit test could be applied in the model analysis to make the research more rigorous.
References
Akkermans, H., Bogerd, P. and Vos, B. (1999) ‘Virtuous and vicious cycles on the road towards international supply chain management’, International Journal of Operations & Production Management, Vol. 19 Nos. 5/6, pp. 565-581.
Anderson, J. C. and Gerbing, D. W. (1988) ‘Structural equation modelling in practice: A review and recommended two-step approach’, Psychological Bulletin, Vol. 103, No. 3, pp. 411-423.
Page 21
Andreassen, T.W. (2000) ‘Antecedents to satisfaction with complaint resolution’, European Journal of Marketing, Vol. 34, No. 2, pp. 156-175.
Bentler, P.M. (1988) ‘Causal modelling via structural equation systems’. In J.R. Nesselroade & R.B. Cattell (Eds.), Handbook of multivariate experimental psychology (2nd ed., pp.317-335). New York: Plenum.
Bentler, P.M. and Bonett, D.G. (1980) ‘Significance tests and goodness of fit in the analysis of covariance structure’, Psychological Bulletin, Vol. 88, pp.588-606.
Betts, A., Croom, S. and Lu, D (2011) ‘Benchmark to escape from Lake Wobegon’, Benchmarking: An International Journal, Vol. 18, No. 5, pp.733-744.
Böhme, T., Childerhouse, P., Deakins, E. and Corner, J. (2008) ‘Balancing power and dependency in buyer-supplier relationships’, International Journal of Electronic Customer Relationship Management, Vol. 2, No. 3, pp. 195-214.
Brewer, B. (1996) ‘Internalism and Perceptual Knowledge’, European Journal of Philosophy, Vol. 4, pp. 259-275.
Bridges, E. (1993) ‘Services attributes: expectations in SERVQUAL?’ Working paper No. 294, University of Manchester, Manchester.
Brown, T.A., Chorpita, B.F. and Barlow, D.H. (1998) ‘Structural relationships among dimensions of the DSM-IV anxiety and mood disorders and dimensions of negative affect, positive affect, and automatic arousal’, Journal of Abnormal Psychology, Vol.107, pp.179-192.
Cox, B.J., Walker, J.R., Enns, W.M., and Karpinski, D. (2002) ‘Self-criticism in generalized social phobia and response to cognitive-behavioural treatment’, Behavior Therapy, Vol. 33, pp. 479-491.
Coye, R.W. (2004) ‘Managing customer expectations in the service encounter’, International Journal of Service Industry Management, Vol. 15, No. 1, pp. 54-71.
Cramer, D. (1998) Fundamental statistics for social research. London: Routledge. Cramer, D. and Howitt, D. (2004) The SAGE dictionary of statistics. London: SAGE.
Page 22
Razali, N. M. and Wah, Y. B. (2011) ‘Power comparisons of Shapiro-Wilk, Kolmogorov-Smirnov, Lilliefors and Anderson-Darling tests’, Journal of Statistical Modeling and Analysis, Vol. 2, No. 1, pp. 21-33.
Fawcett, S.E. and Magnan, G.M. (2002) ‘The rhetoric and reality of supply chain
integration’, International Journal of Physical Distribution & Logistics Management, Vol. 32, No. 5, pp. 339-361.
Floyd, F.J., and Widaman, K.F. (1995) ‘Factor Analysis in the development and refinement of clinical assessment instruments’, Psychological Assessment, Vol.7, pp.286-299. Flynn, B.B., Huo, B. and Zhao, X. (2010) ‘The impact of supply chain integration on
performance: a contingency and configuration approach’, Journal of Operations Management, Vol. 28, pp. 58-71.
Gagliano, K.B. and Hathcote, J. (1994) ‘Customer expectations and perceptions of service quality in retail apparel specialty stores’, Journal of Services Marketing, Vol. 8, No. 1, pp. 60-69.
Gimenez, C. and Venura, E. (2003) ‘Supply chain management as a competitive advantage in the Spanish grocery sector’, International Journal of Logistics Management, Vol. 14, No. 1, pp. 77-88.
Hu, L. and Bentler, P. M. (1999) ‘Cutoff criteria for fit indexes in covariance structure
analysis: Conventional criteria versus new alternatives’, Structural Equation Modelling, Vol. 6, pp. 1-55.
Huron, D. (2006) Sweet Anticipation – Music and the Psychology of Expectation, A Bradford Book, The MIT Press, London.
Jayaram, J., Tan, K. and Nachiappan, S.P. (2010) ‘Examining the interrelationships between supply chain integration scope and supply chain management efforts’, International Journal of Production Research, Vol. 48, No. 22, pp. 6837-6857.
Page 23
Johnston, R. and Clark, G. (2008) Service Operations Management, 3rd ed., Financial Times/Prentice-Hall, London.
Kannan, V.R. and Tan, K.C. (2010) ‘Supply chain integration: cluster analysis of the impact of span of integration’, Supply Chain Management: An International Journal, Vol. 15, No. 3, pp. 207-15.
Kessler, S. (1995) Total Quality Service: A Simplified Approach to Using the Baldrige Award Criteria, ASQC Quality Press, Milwaukee, WI.
Kim, S.K. (2009) ‘An investigation on the direct and indirect effect of supply chain
integration on firm performance’, International Journal of Production Economics, Vol. 119, No. 2, pp. 328-346.
Lee, H. (2000) ‘Creating value through supply chain integration’, Supply Chain Management Review, September, pp. 30-36.
Liggio, C. D. (1974) ‘The expectation gap: The accountant’s Waterloo’, Journal of Contemporary Business, Vol. 3, No. 22, pp. 27-44.
Lowe, D. J. (1994) ‘The expectation gap in the legal system: Perception differences between auditors and judges’, Journal of Applied Business Research, Vol. 10, No. 3, pp. 39-44. Lu, D. (2011a) Fundamentals of Supply Chain Management, Ventus Publishing Aps,
Frederikesberg, Denmark.
Lu, D. (2011b) In Pursuit of World Class Excellence, Ventus Publishing Aps, Frederikesberg, Denmark.
Lu, D., Betts, A. and Croom, S. (2011) ‘Re-investigating business excellence: values, measures and a framework’, Total Quality Management and Business Excellence, Vol.22, No. 12, pp. 1263-1276.
Page 24
Lu, D., Ertek, G., Betts, A. (2013) ‘Modelling the supply chain perception gaps’, International Journal of Advanced Manufacturing Technology, in press, DOI 10.1007/s00170-013-5504-x.
Margetta, J. (1998) ‘Fast, global and entrepreneurial: supply chain management Hong Kong style: an interview with Victor Fung’, Harvard Business Review, September/October, pp. 103-14.
Miller, J. R. Reed, S. A. and Strawser, R. H. (1991) ‘The new author’s report: Will it close the expectation gap in communication?’, CPA Journal, Vol. 60, No. 5, pp. 68-72.
Oliver, R.L. and DeSarbo, W.S. (1988) ‘Response determinants in satisfaction judgments’, Journal of Consumer Research, Vol. 14, pp. 495-507.
Parasuraman, A., Zeithaml, V.A. and Berry, L.L. (1985) ‘A conceptual model of service quality and its implications for future research’, Journal of Marketing, Vol. 4, No. 4, pp. 41-50.
Porter, B. (1993) ‘An empirical study of the audit-expectation-performance gap’, Accounting and Business Research, Vol. 24, No. 93, pp. 49-68.
Rosenzweig, E.D., Roth, A.V. and Dean, J.W. Jr (2003) ‘Influence of an integration strategy on competitive capabilities and business performance’, Journal of Operations
Management, Vol. 21 No. 4, pp. 437-56.
Silver, L. and Vegholm, F. (2009) ‘The dyadic bank-SME relationship: Customer adaptation in interaction, role and organization’, Journal of Small Business and Enterprise
Development, Vol. 16, No. 4, pp. 615-627.
Slack, N., Chambers, S., Johnston, R. and Betts A. (2009) Operations and Process Management 2nd edition Pearson Education Harlow.
Spearman, C. (1904) ‘The proof and measurement of association between two things’, The American Journal of Psychology, Vol. 15, No. 1, pp. 72–101.
Page 25
Sun, S., Hsu, M. and Hwang, W. (2009) ‘The impact of alignment between supply chain strategy and environmental uncertainty on SCM performance’, Supply Chain Management: International Journal, Vol. 14, No. 3, pp. 201-212.
Swink, M., Narasimham, R. and Wang, C. (2007) ‘Managing beyond the factory walls: effects of four types of strategic integration on manufacturing plant performance’, Journal of Operations Management, Vol. 25, No. 1, pp. 148-64.
Vinagre, M.H. and Neves, J. (2007) ‘The influence of service quality and patients’ emotions on satisfaction’, International Journal of Health Care Quality Assurance, Vol. 21, No. 1, pp. 87-103.
Walker, J.L. (1995) ‘Service encounter satisfaction: conceptualized’, Journal of Services Marketing, Vol. 9, No. 1, pp. 5-14.
Wothke, L.M. (2003) ‘The introduction of path analysis to the social sciences and some emergent themes: An annotated bibliography’, Structural Equation Modelling, Vol. 10, pp.1-34.
Page 26
Appendix 1.
Survey Questionnaire
Category Label Statement Not True---Very True
Level-1 Gap LV1_a What your suppliers’ understanding on the detailed quality requirement from you is exactly what you understand that they ought to be.
1 , 2 , 3 , 4 , 5 , 6 , 7 , 8 , 9
LV1_b What you expected from your suppliers on the delivery service standard is exactly what your suppliers perceive and understood on what to be expected.
1 , 2 , 3 , 4 , 5 , 6 , 7 , 8 , 9
LV1_c What your suppliers’ understanding on their own performance and capability to deliver long term performance is exactly the same as what you always perceive them to be.
1 , 2 , 3 , 4 , 5 , 6 , 7 , 8 , 9
Level-2 Gap LV2_a For the same categories of goods and services, different suppliers appears to understand all your technical requirements precisely the same way and have exactly the same understanding on cost efficiency and pricing structure
1 , 2 , 3 , 4 , 5 , 6 , 7 , 8 , 9
LV2_b The communication and collaboration within the same supply tier appears to show that there are no discrepancies in between them on the range of supply requirements from you.
1 , 2 , 3 , 4 , 5 , 6 , 7 , 8 , 9
Level-3 Gap LV3_a It is evident to you as a buyer that everyone in the same supplier company appears to know precisely what their buyer expect from them and in precisely the same details.
1 , 2 , 3 , 4 , 5 , 6 , 7 , 8 , 9
LV3_b Any new development in the B2B market is most effectively communicated throughout the organisation to everyone, and difference in understanding of the supply requirements within the company never occurred.
1 , 2 , 3 , 4 , 5 , 6 , 7 , 8 , 9
SC
Performance shortfalls
PF_a Your supply chain has been unable to deliver what the end-customer wants in terms of the value of goods and service, suffering largely from the lack of communication in the B2B market.
1 , 2 , 3 , 4 , 5 , 6 , 7 , 8 , 9
PF_b Your supply chain has been competing ineffectively in the market place, largely due the low standard of delivery efficiency and effectiveness in the B2B channel.