Munich Personal RePEc Archive
Divisia monetary aggregates for the GCC
countries
Alkhareif, Ryadh and Barnett, William A.
University of Kansas
18 May 2012
Online at
https://mpra.ub.uni-muenchen.de/40749/
DIVISIA MONETARY AGGREGATES FOR THE GCC COUNTRIES
1Ryadh M. Alkhareif William A. Barnett
University of Kansas University of Kansas
and
Center for Financial Stability
Abstract
This paper builds monthly time-series of Divisia monetary aggregates for the Gulf area
for the period of June 2004 to December 2011, using area-wide data. We also offer an "economic
stability" indicator for the GCC area by analyzing the dynamics pertaining to certain variables
such as the dual price aggregates, aggregate interest rates, and the Divisia aggregate user cost
growth rates. Our findings unfold the superiority of the Divisia indexes over the officially
published simple-sum monetary aggregates in monitoring the business cycles. There is also direct
evidence on higher economic harmonization between GCC countries-- especially in terms of their
financial markets and the monetary policy. Monetary policy often uses interest rate rules, when
the economy is subject only to technology shocks. In that case, money is nevertheless relevant as
an endogenous indicator (Woodford, 2003). Properly weighted monetary aggregates provide
critical information to policy makers regarding inside liquidity created by financial
intermediaries. In addition, policy rules should include money as well as interest rates, when the
economy is subject to monetary shocks as well as technology shocks. The data show narrow
aggregates growing while broad aggregates collapsed following the financial crises. This
information clearly signals problems with the financial system's ability to create liquidity during
the crises.
1 Introduction
Monetary authorities and economic agencies worldwide find it challenging yet
imperative simultaneously to understand and remedy the recent financial crisis. From the
1
perspective of monetary aggregation and index number theory, the increased frequency and
severity of financial crises are imputed in part to the misperceptions among economists, financial
analysts, and policy makers about the state of the economy. Particularly, evaluating the economy
by means of simple-sum monetary aggregates, having no theoretical foundations whatsoever, can
lead to erroneous judgments. Instead, economic decisions must be made based upon solid
theoretical foundations, using microeconomic theory and statistical index number theory as
proposed by Barnett (1978; 1980a,b; and 1981a )2. One such index number is the Divisia index.
Barnett (1978; 1980a,b; and 1981a) created Divisia monetary aggregates by linking
microeconomic theory with index number theory. The Divisia monetary index is a money supply
measure, which weights the monetary components (e.g., currency, demand deposits, and savings
and time deposits) according to their usefulness in transactions. The Divisia index accounts for
the variability of the share weights among monetary assets within an aggregate, when measuring
the monetary service flows of the economy. The index depends upon prices and quantities of
monetary assets, where the price of a monetary asset is called its user cost (rental price).
The foundations of the Divisia monetary index are manifested in its solidarity with
microeconomics theory. The index also abides by the classification of superlative index numbers
defined by Diewert (1976), since the discrete time Divisia index is exact for the quadratic
translog specification of the exact aggregator function.3 Thus, the index is a superlative index
endowed with a solid theoretical foundation capable of tracking the exact theoretical monetary
aggregate of aggregation theory.4
The primary purpose of money is threefold: it is a unit of account, a store of value, and a
medium of exchange. A key property of Divisia indexes is their ability to remove the investment
motive and measure all other monetary services associated with economic liquidity, by allowing
the weights of monetary assets to vary depending on their monetary services at the margin [see
Hancock (2005) for a more complete discussion]. The Divisia index, unlike its simple-sum
counterpart, accounts for the variability of the share weights among monetary assets within an
aggregate, when measuring the monetary service flows of the economy. The investment motive is
2
See also Barnett's (2012) latest book.
3
Superlative index numbers are exactly correct for a quadratic approximation to the aggregator function. See
Barnett (1982)for more details.
4
Although it is true that the Divisia aggregate exactly tracks the true monetary aggregate in continuous time, the
removed, since otherwise the entire capital stock of the economy would have to be included in
the definition of money.
In finance higher returns are often associated with riskier investments, given the rational
behavior of investors. Based upon information available at their disposal, investors may choose to
invest inlow risk assets (e.g., Treasury bills and government bonds) or in riskier assets, such as
stocks, options, and other risk-bearing financial instruments. The higher the quality of
information and data the investors have, the better qualified they are in making investment
decisions. In this regard, Barnett (2012) suggested that inadequate regulations and supervision
were not the only factors that caused the subprime financial crisis, but also the low quality of the
Federal Reserve published monetary data. Barnett argued that "greed" is an undefined concept in
economic theory and instead he points to the defective information provided to the economy by
the officially produced simple-sum monetary aggregates, misinforming investors---both
individuals and financial institutions---as well as the central bank itself.5
The primary pitfall of the simple-sum is its lack of a theoretical foundations. It is a naive
index in a sense that it rules out the differences in liquidation and interest-yielding properties of
all monetary components (i.e., it implicitly assumes perfect substitutability among monetary
assets). The simple-sum is a special case of the Divisia monetary aggregates under the unrealistic
assumption that monetary assets are perfectly substitutable for one another. However, money
currently encompasses monetary assets with different positive rates of returns. As a result, perfect
substitutability among assets within an aggregate is no longer a valid assessment. Simple-sum
indexes, as pointed out by Barnett (1980b), provide invalid structural economic variables. This
assessment advocates for using indexes which measure structural economic variables, as is the
subject of index number theory and its associated aggregation theory.
Barnett (1981b, p. 488) comments on the unsatisfactory simple-sum and advocates a
formally derivable monetary index:
“Simple-sum aggregates do not and cannot accurately indicate the quantity of monetary services being provided to the economy. Properly
constructed quantity index numbers can. Monetary aggregates should be
no less competently constructed than aggregates long available for other
5
economic variables, such as commodity quantities or prices.”
The remainder of this paper is organized as follows: section 1.2 provides a summary of
the seminal theoretical considerations relating to the Divisia monetary aggregates; section 1.3
constructs Divisia monetary aggregates for the GCC countries; section 1.4 builds a common
Divisia index for the GCC area; section 1.5 comprises the conclusion.
2 The Theory of Divisia Monetary Aggregation
While aggregation and index number theory are highly developed in the fields of
consumer demand theory and production theory, they were not applied to monetary theory until
Barnett (1978, 1980a,b) derived the correct formula of the price (user cost) of monetary assets
and thereby produced a connection between monetary economics and index number theory. User
cost is the interest return forgone by holding a monetary asset rather than holding highest return
(usually less-liquid) asset. The user cost of money is its opportunity cost and thereby the price of
a monetary asset. The seminal work of Barnett (1978; 1980a,b; and 1987) derived the
Jorgensonian user cost of monetary assets from a rigorous Fisherine intertemporal consumption
expenditure allocation model. His findings have inaugurated the use of index number theory into
monetary economics.
The current period nominal user cost of monetary asset i , having quantitymit during
period t, is6
= ,
1
t it it t
t
R r
p R
(1)
where
Rt is the benchmark rate at time t.
rit is the rate of return on asset i during t.
t
p is the true cost-of-living index price at time t.
The user cost nets out the investment motive of holding money, so that the quantity index
6
The real and nominal user cost prices are related to one another by the following direct relationship: it = pt it
measures all other serves of the monetary assets. The vector of user cost prices is πt and the vector of corresponding nominal monetary asset quantities is mt, while is the vector of real
quantities is m*t mt / pt*.
The Divisia price and quantity indexes solve the following dual differential equations for
the price aggregate, t =( )πt , and the monetary quantity aggregate, Mt M(mt) , respectively:
1
log log log
= = ( )
t it it it it
it N
i i
kt kt k
d d m d
s
dt dt dt
m
(2)1
log log log
= = ( )
t it it it it
it N
i i
kt kt k
d M d m m d m
s
dt dt dt
m
(3)where sit =
1
i t i t N
k t k t k
m
m
is the expenditure share for theth
i monetary asset during period .t
The Discrete time representation of the Divisia index is needed for empirical applications,
since economic data are measured in discrete time. Törnqvist (1936) and Theil (1967) proved that
the Törnqvist-Theil approximation is a second order approximation to the continuous time
Divisia index. At time t, the discrete time representation of the Divisia price index, t, over user cost prices and the Divisia quantity index, Mt, over the monetary components respectively
are7:
1 , 1
=1
log log = (log log )
N
t t it it i t
i
s
(4)
7
1 , 1 =1
log log = (log log ),
N
t t it it i t
i
M M
s m m (5)where sit = (1/2)( sit+si,t1), is the average of the current and lagged expenditure shares sit
and si,t1.
Equations (4) and (5) are the weighted averages of the growth rate of user cost prices, πt, and monetary components, mt, at time t, respectively. In levels, the Divisia monetary index
t
M can be written as:
1 =1 , 1
= ( ) ,
n s
t it it
t i i t
M m
M m
which is known as the Törnqvist-Theil Divisia monetary quantity index.
Dual to the quantity index, Mt, there is the aggregate price index t, which equals the total expenditue on monetary components divided over the quantity monetary aggregate.8 More
formally,
=1
= ,
N it it i
t
t
m
M
(6)where equation (6) satisfies Fisher's factor reversal test:
=1
=
N t t it it
i
M m
(7)The Divisia, Paasche, and Laspeyres indexes are not self-dual. As a result, equations (4)
and (6) do not produce exactly the same price aggregate. But the remainder term between them is
third order in the changes, and typically less than the roundoff error in the component data.9
3 Constructing a GCC Area Divisia Monetary Aggregate
A large number of countries maintain Divisia monetary aggregates. While some central
banks make these indexes available to the public, many central banks provide and use them only
8
The quantity indexMt and price indext result from the duality theory under linear homogeneity. Barnett
(1987) extended the derivation of the quantity index and price index to the nonhomogeneous case.
9
internally. Monetary authorities supplying Divisia monetary aggregates internally or publicly
include the Federal Reserve Bank of St. Louis, the European Central Bank, the Bank of England,
the Bank of Japan, the Bank of Israel, the National Bank of Poland, and the International
Monetary Fund (IMF) 10. While many studies have produced Divisia monetary aggregates data
for countries worldwide, there are no Divisia data available for the complete GCC area.11
The scarcity of GCC monetary data has limited researchers from exploring and
investigating the influence of Divisia aggregation on GCC monetary policy analyses. This
paper reports on the first Divisia monetary aggregates for the complete GCC area and focuses on
economic measurement. Issues related to utility function specifications, parameter estimation,
and other econometric applications were avoided12. Hence, our reesults are unbiased in the sense
that they involve no estimations or inferences at all. We let the data speak for themselves.
Further research can make use of techniques used by the literature on the European
Monetary Union (EMU). This literature, highly relevant to the GCC area, includes: Barnett
(2003, 2007), Binner, Bissoondeeal, Elger, Gazely, and Mullineux (2005), Binner, Bissoondeeal,
Elger, Jones, and Mullineux (2009), Binner, Gazely, and Kendall (2008), Reimers (2002), Stracca
(2001), and Beyer, Doornik and Hendry (2000).
Our Divisia monetary indexes for the Gulf States can not only provide the Gulf central
banks with a wider range of tools, but also can serve as a vehicle for researchers to improve
studies on Gulf monetary policy. Our findings are in line with the those in Barnett (2012) and
Barnett and Chauvet (2011a,b), in which the discrepancy between Divisia and simple-sum
growth rates widened during times of high uncertainty and periods of economic disruptions, such
as the financial turmoil. Interestingly, the narrow aggregates were growing while broad
aggregates collapsed following the financial crises. This information clearly signals problems
with the financial system's ability to create liquidity during the crises.
3.1 Data Descriptions And Sources
10
The Center for Financial Stability (CFS) in New York City provides a directory on the literature pertaining to Divisia monetary aggregations for over 40 countries throughout the world. For more information on Divisia monetary aggregates, visit the CFS website at www.centerforfinancialstability.org/amfm.php.
11
To date, Alsahafi (2009) is the only paper producing Divisia indexes for a GCC country, and that paper’s results
are limited to Saudi Arabia.
12
The six GCC countries---Bahrain, Kuwait, Oman, Qatar, Saudi Arabia, and United Arab
Emirates--are the sample countries of this chapter. Variables taken into consideration in the
calculation of the Divisia monetary aggregates include: currency in circulation, overnight
deposits, demand deposits, saving and time deposits, quasi-money, overnight deposit rates, rate of
return on demand deposits, interest rate on saving and time deposits, Treasury bills rates of
return, and interest rates on short-term loans. The domestic short-term loan rate is usually the
highest and hence used as the benchmark rate for most periods.
The analysis in this study is based on monthly data starting as far as the data were
available and ending in December 2011. The GCC central banks are the main sources of
monetary data. Interest rates and other monetary data were extracted from the International
Financial Statistics (IFS), Federal Reserve Economic Data (FRED), The Bloomberg database,
and the GCC Secretariat General.
All quantities have been seasonally adjusted using X11 procedure. There were not many
missing data in our study. We applied moving average interpolation, whenever data were
missing. Conversion from total to per capita values requires population data, which are only
available with annual frequency. To acquire monthly population series, we use linear
interpolation.
When used with simple-sum monetary quantity aggregation, the inflation rates for the
aggregated Gulf area could be computed as the arithmetic averages of the GCC countries'
corresponding inflation rates, to be consistent with the implicit assumption of perfect
substitutability embeded in simple-sum quantity aggregation. If willing to make the unreasonable
assumption of perfect substitutability among monetary asset quantities, why not be
philosophically consistent and make the same unreasonable assumption about consumer goods?
But when used with the Divisia monetary quantity indexes, we use Divisia price aggregation over
countries.
3.2 Benchmark Rate of Return for the GCC Countries
Within the field of aggregation and index number theory, the benchmark rate plays a
pivotal role in constructing the Divisia index, since the benchmark rate appears in the user cost
formula for all monetary assets. Barnett (1987) defined the benchmark rate, Rt, to be the yield
on a pure investment asset, held solely to accumulate wealth and providing no other services,
transfer wealth over multiperiod planning horizons. During each period, our proxy for the
theoretical benchmark rate is the highest rate attained among all relevant assets on which we have
data, such as the interest rates on demand deposits, saving and time deposits, loans, government
bonds, and Treasury bills. In other words, the benchmark rate, in each period of time, is the
maximum rate attained over a set of rates pertaining to monetary assets and other monetary
instruments, such as Treasury bills and short-term loans.13
In mathematical representation, our benchmark rate takes the following form:
, , , ,
= { , , , },
t
i t bills t loan t interbank t
R Max r r r r
where,
it
r is the rate of return on asset i during period t,
t bills
r
, is the interest rates on Treasury bills at time t,
t loan
r
, is the loan interest rate at time t,
t interbank
r
, is the interbank interest rate at time t.
3.3 Divisia Monetary Aggregates Within GCC Countries
Within country Divisia monetary indexes are computed for the GCC countries. We
follow the theory provided by Theil (1967) and Barnett (1979a,b; 1980b) and extended in Barnett
(2003, 2007) to multilateral aggregation permitting aggregation within and then over countries.
The approach uses economic index number theory and assumes the existence of a representative
agent within each country. We begin by presenting the theory in continuous time, before
converting to discrete time.
Let K be the number of countries in the Gulf Monetary Union. For each country },
{1,...,K
k define the true cost-of-living index as Pk =Pk(Pk), where Pk =Pk(t) represents the vector of prices of consumer goods at time t.14 Let xk =xk(t) be the vector of per-capita real rates of consumption of those goods in country k at time t. Let mkjiand rkjibe,
13
This is called the “envelope approach.” See Barnett, Offenbacher, and Spindt (1984) for a complete discussion of this methodology.
14
respectively, the nominal per capita holdings and the yields on asset type i, { }
purchased in country j and owned by individual(s) in country k. We enable economic agents within the Gulf area to hold assets in Z outside countries. Moreover, let Nj be the number of different asset types that can be held in country j and let N be the total number of asset types available within all of the relevant countries, j{1,...,KZ}15
.
Finally, let Rk =Rk(t) and) (
=H t
Hk k be the benchmark rate of return and the population of country k at time t,
respectively
.
Hence, the real user cost price of asset i purchased in country j and owned by economic agent(s) of country k at time t is16) ( ) ( = )
(t Rk t rkji t
kji
π
In line with the economic approach proposed by Barnett (1980a,b; 1987), we assume
weak separability and linearly homogeneity of the representative agent's utility function. ut.17
We use the following formal notations:
Let
kj
m =(mkj1,...,mkji ,...,mkjN )'
kj
m =(mkj1,...,mkji,...,mkjN)'
kj
π '
kjN kji
kj ,..., ,..., )
(
= 1
kj
π '
kjN kji
kj ,..., ,..., )
(
= 1
kj
r =(rkj1,...,rkji,...,rkjN)'
and let
k
m =(mk1,...,mkj,...,mk,KZ)'
k
m =(mk1,...,mkj,...,mk,KZ)' k π ' Z K k kj
k ,...,π ,...,π )
(π
= 1 ,
k π ' Z K k kj
k ,...,π ,...,π )
(π
= 1 ,
15
Clearly N Nj for all j {1,...,KZ}.
16
The real and nominal user cost prices are related to one another as follows: πkji(t)= Pk(t) πkji (t).
17
Barnett (1987) incorporated the nonhomothetic case to aggregation and index number theory. Under the
nonhomogeneous case, the Divisia index is uniquely considered to be the best element of Diewert's superlative class.
k
r =(rk1,...,rkj,...,rk,KZ)'.
Our computations are restricted, whenever applicable, to the index set:
0, > : ) , {( = kji
k j i m
S j{1,...,KZ},i{1,...,N} } for all k{1,...,K}.
Following Barnett (2003), our Divisia indexes for the Gulf countries can be defined as
follows: within each country, k{1,...,K}, the real per-capita monetary services aggregate,
k
M , the nominal per-capita monetary services aggregate, Mk, the real user cost price aggregate,
k, and the nominal user cost price aggregate, k, respectively are:
kji kji k S i jk w d m
M
dlog = log
) , ( kji kji k S i j
k w d m
M
dlog = log
) , (
( , )
log k = kji log kji
j i S k
d w d
( , )
log k = kji log kji
j i S k
d w d
where, ( , ) ( , ) ( ) ( ) = = = = . ( ) ( )kji kji kji kji k kji kji k kji kji
kji ' '
k kji kji k kji kji
k k k k
j i S
j i S k
k
m m R r m R r m
w
R r m
R r m
π m π m
Notice that 0wkji 1 for all k{1,...,K}, j{1,...,KZ}, and i{1,...,N}.
Moreover, =1
) , ( kji k S i j w
for all k{1,...,K} implies that the shares, wkji, possess the
properties of a probability distribution for each country k{1,...,K}. Consequently, the above
Divisia indexes could be interpreted as Divisia growth rate means.18
The equivalent discrete time representation of the above continues time Divisia indexes
are, respectively:
18
, 1 , 1 ( , )
log kt log k t = kjit(log kjit log kji t )
j i S k
M M w m m
, 1 , 1
( , )
log kt log k t = kjit(log kjit log kji t )
j i S k
M M w m m
, 1 , 1
( , )
log kt log k t = kjit(log kjit log kji t )
j i S k w
, 1 , 1
( , )
log kt log k t = kjit(log kjit log kji t ),
j i S k
w
where = ( , 1)
2
kjit kji t kjit
w w
w .
In levels, the real and nominal per-capita Divisia monetary indexes, respectively, are
, 1 ( , ) , 1
= ( kjit )wkjit
kt
k t j i S kji t k m M M m
and, 1 ( , ) , 1
= ( kjit )wkjit
kt
k t j i S kji t k m M M m
.By Fisher's factor reversal test, there exists a user cost price aggregate dual to the exact
service quantity aggregate such that their product equals the total expenditure on the components.
More formally,
( , )
= ,
kt kt kjit kjit j i S
k
M m
The exact user cost aggregate price dual to the exact quantity aggregate is thereby obtained by
dividing actual expenditure on the components by the quantity aggregate, as follows:
( , )
= .
kjit kjit j i S
k kt kt m M
Let ̃ be country k’s aggregate interest rate at time t. A portfolio of of monetary assets { : (i,j) Sk} with interest rates { : (i,j) Sk} has investment yield ∑ . Hence, the
following accounting identity must hold, in order for ̃ to be the rate of return on the portfolio :
( , ) ( , )
.
k k
kt kjit kjit kjit j i S j i S
R m r m
Solving for ̃ , we acquire
( , )
( , )
.
k k
kjit kjit j i S
kt
kjit j i S
r m
R
m
This paper defines Divisia monetary aggregates in GCC countries as following: the
narrowed Divisia monetary aggregate, D1, will contain both currency in circulation and demand
deposit. As in M2, the broader Divisia monetary aggregate, D2, will include D1 plus saving and
time deposits. The central bank of Qatar, in turn, incorporates quasi-money within the broader
monetary aggregates. Consequently, the Divisia monetary aggregates will be slightly different for
Qatar relative to the others.19
Figure 1 contains plots of the year-over-year growth rates of the narrow Divisia and
simple-sum monetary aggregates for the GCC countries. The two approaches to aggregation
produce identical results, since all assets within the monetary aggregates bear zero-interest rates
and therefore have the same user cost prices. Specifically, currency in circulation and demand
deposits are zero-interest assets, and hence the theory implies that consumers are indifferent
between those two assets.20
19
The inclusion of the quasi-money in the broader monetary aggregate is based solely on data availability.
20
Figure 1: Year-Over-Year Growth Rates of the Divisia and Simple-Sum Monetary Aggregates,
M1. (percent annual rate)
-10 -5 0 5 10 15 20 25 30 35 40
2000 2001 2002 2003 2004 2005 2006 2007 2008 2009 2010 2011
P
er
ce
n
t
Monthly, 2000 - 2011 Bahrain Simple-Sum Divisia -30 -20 -10 0 10 20 30 40
1995 1996 1998 1998 1999 2000 2001 2002 2003 2004 2005 2006 2007 2008 2009 2010 2011
P e rc e n t
Monthly, 1995 - 2011
Kuwait Simple-Sum Divisia -20 -10 0 10 20 30 40 50 60
1991 1992 1993 1994 1995 1996 1998 1998 1999 2000 2001 2002 2003 2004 2005 2006 2007 2008 2009 2010 2011
P e rc e n t
Monthly, 1991 - 2011
Oman Simple-Sum Divisia -40 -20 0 20 40 60 80
2005 2006 2007 2008 2009 2010 2011
Pe
rc
en
t
Monthly, 2005 - 2011
Qatar
Simple-Sum
By construction, broad monetary aggregates contain assets with positive interest rates.
Assuming perfect substitutability among assets yielding different interest rates is not
permissible.21 For most countries (and the GCC as a whole) the imperfect substitutability among
those assets leads to distinct results between Divisia and simple-sum aggregates – suggesting that
policy makers may reach different conclusions based on the different aggregation procedures.
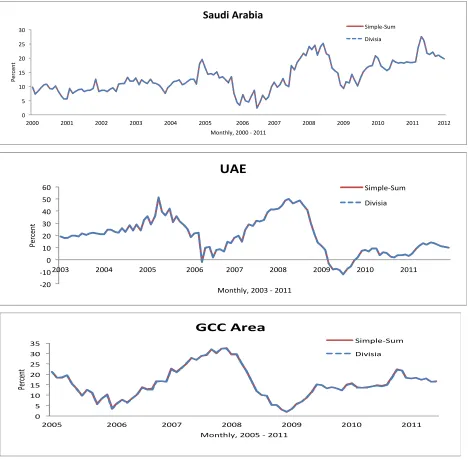
Figure 2 displays the year-over-year growth rates of the broad Divisia and simple-sum
monetary aggregates for the GCC countries. The most interesting charts are reported for Kuwait
21
Perfect substitutability among assets exists, if and only if, all assets within an aggregate offer the same rate of return.
0 5 10 15 20 25 30
2000 2001 2002 2003 2004 2005 2006 2007 2008 2009 2010 2011 2012
P
e
rc
e
n
t
Monthly, 2000 - 2011
Saudi Arabia
Simple-Sum
Divisia
-20 -10 0 10 20 30 40 50 60
2003 2004 2005 2006 2007 2008 2009 2010 2011
P
e
rc
e
n
t
Monthly, 2003 - 2011
UAE
Simple-Sum
Divisia
0 5 10 15 20 25 30 35
2005 2006 2007 2008 2009 2010 2011
Pe
rc
en
t
Monthly, 2005 - 2011
GCC Area
Simple-Sum
[image:16.612.72.540.70.534.2]and Saudi Arabia, where the year-over-year growth rates for the broad Divisia and simple-sum
aggregates interchangeably shift over time. For instance, in Kuwait there has been a rotation
between the year-over-year growth rates of the broad Divisia and simple-sum. Divisia growth
rates fluctuate from being above simple-sum during mid 2000 to mid 2004 and to being below
from early 2006 to late 2007. The broad Divisia growth rates diverge from simple-sum as a result
of the high variation in the user cost of the monetary components. This variation suggests that
monetary assets in Kuwait are less substitutable. The Divisia indexes fall sharply as the demand
deposits (called sight deposits) in Kuwait spiked in mid-1995 from being 823.4 million in May
up to 1081.5 and then fell back to 810.3 in July. Divisia indexes were able to signal such
Figure 2: Year-Over-Year Growth Rates of the Divisia and Simple-Sum Monetary Aggregates,
M2 (percent annual rate)
-5 0 5 10 15 20 25 30 35 40
2000 2001 2002 2003 2004 2005 2006 2007 2008 2009 2010 2011
P
e
rc
e
n
t
Monthly, 2000 - 2011
Bahrain
Simple-Sum
Divisia
-20 -10 0 10 20 30
1995 1996 1998 1998 1999 2000 2001 2002 2003 2004 2005 2006 2007 2008 2009 2010 2011
P
e
r
c
e
n
t
Monthly, 1995 - 2011
Kuwait
Simple-Sum
Divisia
-5 0 5 10 15 20 25 30 35 40
1991 1992 1993 1994 1995 1996 1998 1998 1999 2000 2001 2002 2003 2004 2005 2006 2007 2008 2009 2010 2011
P
e
r
c
e
n
t
Monthly, 1991 - 2011 Oman
Simple-Sum
0 10 20 30 40 50 60
2005 2006 2007 2008 2009 2010 2011
Pe
rc
en
t
Monthly, 2005 - 2011
Qatar
Simple-Sum
Divisia
0 5 10 15 20 25 30
2000 2001 2002 2003 2004 2005 2006 2007 2008 2009 2010 2011
Pe
rc
en
t
Monthly, 2000 - 2011
Saudi Arabia
Simple-Sum Divisia
0 10 20 30 40 50 60
2003 2004 2005 2006 2007 2008 2009 2010 2011
Pe
rce
nt
Monthly, 2003 - 2011 UAE
Simple-Sum Divisia
5 10 15 20 25 30 35
2005 2006 2007 2008 2009 2010 2011
Pe
rc
en
t
Monthly, 2005 - 2011
GCC Area
Simple-Sum
The Saudi capital market plunged in 2006. Specifically, the Saudi stock market meltdown
in 2006 was accurately captured by the Divisia monetary indexes, in which the year-over-year
growth rates for Divisia fell sharply during the first six months of 2006 to almost zero percent
and bounced up to reach its maximum in early 2008 (figure 2) .22 During the recent financial
crisis, the Divisia growth rate fluctuated from being above simple-sum in late 2008 to being
below in early 2009. This result indicates that the monetary policy was more contractionary than
likely intended during the financial crisis, when the Divisia monetary aggregates growth rates
were lower than their simple-sum counterparts.
In 1998, when the price of oil dropped and reached minimum levels (approximately $10
per barrel) for more than two decades, thereby adversely affecting the domestic economy, the
Omani monetary policy endeavored to stabilize the economy23. This led to a one-year hiatus
between the year-over-year growth rates of Divisia and simple-sum (figure 2).
In Bahrain, steady growth prevailed from 2000 to 2005, but the year-over-year monetary
growth accelerated afterwards to attain its peak in early 2008, in response to the boom of oil
prices (figure 2). However, the growth fell sharply in mid-2008, as a result of the sudden drop of
energy prices. The recently erupted demonstrations and civil uprisings, called the "Arab Spring" ,
during which the Bahraini government has declared a three-month state of emergency, have
hindered economic reintegration.
In Qatar, the growth rates of the narrow monetary aggregate are fairly stable except in late
2008 when demand for deposits witnessed a transitory decline (more that 20%). The
year-over-year growth rates reveal a downward trend from mid-2008 to 2009, during which the
Qatari central bank aimed to subdue staggering inflation (figure 1). Similarly, the growth rates for
the broader aggregates illustrate the central banks effort in deflating the economy as plotted in
figure 2.
The openness of the UAE economy has made the country more vulnerable to the financial
crisis. During the crisis, Abu Dhabi Investment Authority (one of the world's larger investment
funds) declared losses of $125 billion. Moreover, Dubai was bailed out after the property bust
22
The spike of the Divisia growth rate was likely driven by high oil prices in early to mid-2008.
23
degraded the country's economic position.24 In addition to these factors, high inflation rates
(above 12%) have further imposed economic challenges upon the UAE monetary authorities. The
most notable difference between Divisia and simple-sum indexes took place during 2006-2007
and 2009-2010. Those periods include the toughest economic challenges the UAE has faced
(figure 2). However, the year-over-year growth rates for both indexes dropped sharply from 50%
in 2008 to around 5% in 2009. The rise in the monetary aggregates corresponds to the boom in oil
prices during early 2008. Meanwhile, the following collapse of the aggregates’ growth rates
corresponds with the financial crises, which lowered global demand for oil, driving down the
prices.
The behavioral patterns of the user cost prices, aggregate interest rates, dual prices, and
growth rates of the Divisia aggregate user-cost prices could be used as an "economic stability"
indicator. User-cost prices often tend to go in different directions during periods of higher
economic uncertainty [see Barnett, Fisher, and Serletis (1992)]. Our data seem to support this
claim. Plots of the user-cost prices reveal that the user-cost prices of non-liquid monetary assets
(e.g., savings and time deposits, and quasi-money) tend to be more volatile and unstable during
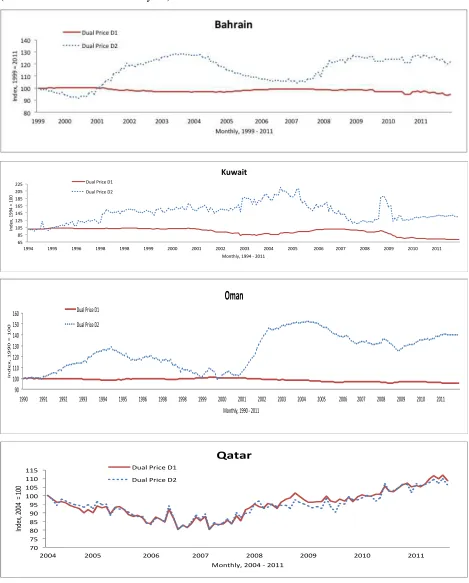
financial crises as opposed to milder economic periods (figure 3). Moreover, the dual prices and
growth rates of the broader Divisia aggregates are more volatile during times of economic
uncertainty (figures 4 and 5). The aggregate interest rate of the narrow monetary aggregate, M1,
is equal to zero for all GCC countries, except for Qatar, in which demand deposits yield positive
interest rates. The aggregate interest rates corresponding to the broader monetary aggregate, M2,
fluctuated the most during the recent financial crisis (figure 6). In 2011, aggregate interest rates
remained below one percent as the GCC central banks set expansionary monetary policy to
mitigate the effects of the recent financial crisis on Gulf economies.
24
Figure 3: User Cost (Rental) Prices of Monetary Assets
0.4 0.5 0.6 0.7 0.8 0.9 1
1999 2000 2001 2002 2003 2004 2005 2006 2007 2008 2009 2010 2011
Monthly, 1999 - 2011
Bahrain
Currency and Demand Deposits
Savings and Time Deposits
0 0.2 0.4 0.6 0.8 1
1994 1995 1996 1998 1998 1999 2000 2001 2002 2003 2004 2005 2006 2007 2008 2009 2010 2011
Monthly, 1994 - 2011
Kuwait
Currency and Demand DepositsSavings and Time Deposits
0.2 0.3 0.4 0.5 0.6 0.7 0.8 0.9 1
1990 1991 1992 1993 1994 1995 1996 1998 1998 1999 2000 2001 2002 2003 2004 2005 2006 2007 2008 2009 2010 2011
P
e
r
c
e
n
t
Monthly, 1990 - 2011
Oman
Currency and Demand Deposits
0 0.1 0.2 0.3 0.4 0.5 0.6 0.7 0.8 0.9 1
2004 2005 2006 2007 2008 2009 2010 2011
P
e
rc
e
n
t
Monthly, 2004 - 2011
Qatar
Currency
Demand Deposits
Savings and Time Deposits
0 0.1 0.2 0.3 0.4 0.5 0.6 0.7 0.8 0.9 1
1999 2000 2001 2002 2003 2004 2005 2006 2007 2008 2009 2010 2011
Monthly, 1999 - 2011
Saudi Arabia
Currency and Demand Deposits Savings and Time Deposits
0.5 0.55 0.6 0.65 0.7 0.75 0.8 0.85 0.9 0.95
2002 2003 2004 2005 2006 2007 2008 2009 2010 2011
Monthly, 2002 - 2011
UAE
Currency and Demand Deposits Savings Deposits
Figure 4: The Growth Rates of the Divisia Aggregate User-Cost Prices for D1 and D2
-6 -4 -2 0 2 4 6 8
1999 2000 2001 2002 2003 2004 2005 2006 2007 2008 2009 2010 2011
P
e
rc
e
n
t
Monthly, 1999 - 2011
Bahrain
User-Cost D1
User-Cost D2
-40 -30 -20 -10 0 10 20 30 40 50
1994 1995 1996 1998 1998 1999 2000 2001 2002 2003 2004 2005 2006 2007 2008 2009 2010 2011
P
e
r
c
e
n
t
Monthly, 1994 - 2011
Kuwait
User-Cost D1
User-Cost D2
-5.00 -4.00 -3.00 -2.00 -1.00 0.00 1.00 2.00 3.00 4.00 5.00
1990 1991 1992 1993 1994 1995 1996 1998 1998 1999 2000 2001 2002 2003 2004 2005 2006 2007 2008 2009 2010 2011
P
e
r
c
e
n
t
Monthly, 1990 - 2011
Oman
User-Cost D1
-15 -10 -5 0 5 10 15
2004 2005 2006 2007 2008 2009 2010 2011
Pe
rc
en
t
Monthly, 2004 - 2011 Qatar User-Cost D1 User-Cost D2 -25 -20 -15 -10 -5 0 5 10 15
1999 2000 2001 2002 2003 2004 2005 2006 2007 2008 2009 2010 2011
P e rc e n t
Monthly, 1999 - 2011
Saudi Arabia User-Cost D1 User-Cost D2 -10 -8 -6 -4 -2 0 2 4 6 8
2002 2003 2004 2005 2006 2007 2008 2009 2010 2011
P e rc e n t
Monthly, 2002 - 2011
UAE User-Cost D1 User-Cost D2 -14 -12 -10 -8 -6 -4 -2 0 2 4 6 8
2004 2005 2006 2007 2008 2009 2010 2011
Pe
rc
en
t
Monthly, 2004 -2011
GCC Area
User-Cost D1
Figure 5: Dual Aggregate User-Cost Prices of the Divisia Monetary Aggregates, D1 and D2
(normalized to 100 in the first year)
65 85 105 125 145 165 185 205 225
1994 1995 1996 1998 1998 1999 2000 2001 2002 2003 2004 2005 2006 2007 2008 2009 2010 2011
In d e x , 1 9 9 4 = 1 0 0
Monthly, 1994 - 2011
Kuwait
Dual Price D1 Dual Price D2
90 100 110 120 130 140 150 160
1990 1991 1992 1993 1994 1995 1996 1998 1998 1999 2000 2001 2002 2003 2004 2005 2006 2007 2008 2009 2010 2011
I n d e x , 1 9 9 0 = 1 0 0
Monthly, 1990 - 2011
Oman
Dual Price D1
Dual Price D2
70 75 80 85 90 95 100 105 110 115
2004 2005 2006 2007 2008 2009 2010 2011
In de x, 20 04 = 10 0
Monthly, 2004 - 2011
Qatar
Dual Price D1
70 80 90 100 110 120 130 140
1999 2000 2001 2002 2003 2004 2005 2006 2007 2008 2009 2010 2011
In
d
e
x
,
1
9
9
9
=
1
0
0
Monthly, 1999 - 2011
Saudi Arabia
Dual Price D1
Dual Price D2
85 90 95 100 105 110 115
2002 2003 2004 2005 2006 2007 2008 2009 2010 2011
In
d
e
x
,
2
0
0
2
=
1
0
0
Monthly, 2002 - 2011 UAE Dual Price D2
Dual Price D2
70 75 80 85 90 95 100 105 110 115
2004 2005 2006 2007 2008 2009 2010 2011
In
d
ex
,2
00
4
=
1
00
Monthly, 2004 - 2011
GCC Area
Dual Price D1
Figure 6: Aggregate Interest Rate Dual to M1and M2 (percent per year)
0 0.5 1 1.5 2 2.5 3 3.5 4
1999 2000 2001 2002 2003 2004 2005 2006 2007 2008 2009 2010 2011
P
e
rc
e
n
t
Monthly, 1999 - 2011 Bahrain
Interest Rate Dual to M2
0 1 2 3 4 5 6
1994 1995 1996 1998 1998 1999 2000 2001 2002 2003 2004 2005 2006 2007 2008 2009 2010 2011
P
e
r
c
e
n
t
Monthly, 1994 - 2011 Kuwait
Interest Rate Dual to M2
0 0.5 1 1.5 2 2.5 3 3.5 4 4.5 5
1990 1991 1992 1993 1994 1995 1996 1998 1998 1999 2000 2001 2002 2003 2004 2005 2006 2007 2008 2009 2010 2011
P
e
rc
e
n
t
Monthly, 1990 - 2011 Oman
Interest Rate Dual to M2
0 0.5 1 1.5 2 2.5 3
2004 2005 2006 2007 2008 2009 2010 2011
P
e
rc
e
n
t
Monthly, 2004 - 2011
Qatar
0 0.5 1 1.5 2 2.5 3
1999 2000 2001 2002 2003 2004 2005 2006 2007 2008 2009 2010 2011
P
e
rc
e
n
t
Monthly, 1999 - 2011
Saudi Arabia
Interest Rate Dual to M2
0 0.5 1 1.5 2 2.5 3
2002 2003 2004 2005 2006 2007 2008 2009 2010 2011
P
e
rc
e
n
t
Monthly, 2002 - 2011
UAE
Interest Rate Dual to M2
0 0.5 1 1.5 2 2.5 3
2004 2005 2006 2007 2008 2009 2010 2011
P
er
ce
n
t
Monthly, 2004 - 2011
GCC Area
Interest Rate Dual to M1
3.4 Divisia Monetary Aggregates Over GCC Countries: A
Heterogeneous Agents Approach
There has been a recurring tendency toward higher economic integration among Gulf
countries. Fueled by the increasing multilateral trade in the region, the Gulf Cooperation Council
(GCC) has proposed its sentiment about launching a single monetary union, where indivisible
monetary policies will be implemented simultaneously for all member states. Hence, the Gulf
Monetary Council (GMC) was established in March 2010. Oman and UAE have opted out of the
GMC for different reasons. In 2006, Oman withdrew from the monetary union, for which it has
not met the convergence criteria required for joining the GMC. In 2009, UAE had a dispute over
the location of the GMC being headquartered in Riyadh, the capital of Saudi Arabia.25 While
negotiations are still ongoing, these factors have hindered the debut of the common currency for
the Gulf area. In addition to these factors, the growing uncertainty about the world economy, and
specifically the intensifying fears of the European sovereign debt crisis, have led the GMC to
postpone its commencement of a common currency towards 2015.
Upon the completion of the common monetary policy in the Euro area, a large number of
the studies in the monetary aggregation literature have used the following two approaches for
measuring monetary service flows aggregated over the euro-zone: (i) the direct approach and (ii)
the indirect approach. The former approach aggregates assets of a specific type over all countries
by simply adding them up and then using the techniques provided by the Divisia index to obtain
the overall monetary aggregate. The latter approach constructs Divisia aggregates across
countries but uses ad hoc weighted averages (e.g., GDP weights) for the over-countries' aggregates. Barnett (2003) explained the drawbacks of these approaches: the direct approach
requires very restrictive assumptions, whereas the indirect approach violates aggregation theory
and does not produce nesting of the multilateral or unilateral representative agent approaches.
Using ad hoc weighted averages of inflation rates over countries to produce a single inflation rate for the euro area is unsatisfactory and inconsistent with index number theory.
Barnett (1982) describes the phases that lead into optimal monetary aggregation in the
25
following manner:
Stage 1: carefully determine the sets of monetary assets, such that the assets to be consolidated within an aggregate pass a separability test validating the grouping. This criterion
implies that the sets of monetary assets are well-defined, based upon the statistical properties as
well as the monetary services pertaining to these assets.26
Stage 2: Construct an index number formula from the superlative index number class for
each admissible set of monetary assets acquired in stage 1. The Divisia index is not the only
obtainable superlative index, but all index numbers in that class move closely together.27
Stage 3: Examine the interaction among the relevant macro-economic variables and the
index numbers. This assessment can be carried out by means of empirical studies. The findings
will determine optimal monetary aggregation.
Three increasingly restrictive approaches were developed by Barnett (2003, 2007) to
capture the economic convergence dynamics evolving in the Euro zone. These approaches,
starting from least restrictive approach, are: the heterogeneous agents approach, the multilateral
representative agent approach, and the unilateral representative agent approach. The European Central Bank has benefited the most from this research in enhancing its Divisia monetary
aggregates database provided to the ECB’s Governing Council at its meetings.
In the following section, the Divisia monetary indexes are constructed over the GCC
area. The findings suggest that while narrow monetary indexes are closely alike, the broad
Divisia index outperforms its simple-sum counterpart. For the growth rates of the Divisia and
simple-sum over the GCC countries, Divisia growth rates display business cycle patterns that are
consistent with monetary policy.
A large portion of the present paper is based upon the seminal work done by Barnett
(1979a;1979b;1980a,b), developed further by Barnett (2003,2007). In line with the heterogeneous
agents approach proposed by Barnett (2003,2007), we assume the existence of a representative
consumer within countries in the Gulf union and treat the union's representative consumers as
heterogeneous agents. This introduces us to a heterogeneous countries approach to aggregation
26
Weak-separability of the utility function is assumed in this chapter. Many empirical studies provide tests for weak-separability. See, for example, Barnett and de Peretti (2009), Barnett and Choi (1989), Blackorby, Russell, and Primont (1998), de Peretti (2005, 2007), Fleissig and Whitney (2003, 2005), Swofford and Whitney (1987, 1994), and Varian (1982, 1983, and 1985). To our knowledge, Barnett and de Peretti (2009) offer the most promising test.
27
over countries. Let K be the number of countries in the Gulf monetary union.
In continuous time, let
sk(t) = Hk (t)/
K
k=1
Hk (t) = country k's share of total GCC population at time t.28
Ik = Ik(t) = country k's total expenditure at time .t
,
k t
e = country k'scurrency exchange rate against a market basket of currencies at .t
Define
* * * * *
* * * * *
=1 =1 =1
= k k k k k k k k k k k k k
k K K K
k k k k k k k k k k k k k
k k k
M p s e M s e M s e
W
M p s e M s e M s e
to be the th
k country's expenditure share of the Gulf union's monetary service flow at time t.
Similar to the share weight for single country, notice that 0Wk 1 and =1 k =1
K
k W
aresatisfied for the union's expenditure shares, so that we can treat {W1,...,Wk} as a probability
distribution for our Divisia indexes.
Consider a representative agent h who lives in country k{1,...,K} with the utility
function:
= [ ( , ( )] = [ ( , ), ( , ), ]
h h h h h h h h h h h
U U u m g x U u m g x
for all tastes , h, in the Gulf area.29 While U, u, and g are fixed functions, the corresponding functions Uh, uh, and gh are random functions drawn from a theoretical population [see Barnett
(2003) for more details]. Furthermore, assume that the representative agent, h, within country
k {1,...,K} solves the following maximization problem for (m x*h, h) during period t: 30
*
maximize [ (U u mh,h), (g xk, k), k] Subject to
* = .
h h h h Ih
m π x p
28
k
s is used to convert to per capita values and we basically drop it to obtain total values.
29
Barnett (2003, 2007) rigorously explained the properties of these functions and their nested variables.
30
See Barnett (2003, 2007) for additional assumptions for the joint distribution of the random variables
The Gulf area's nominal per-capita monetary services flow, M , real per-capita monetary services flow, M, nominal monetary user cost price, , real monetary user cost price, , and the Gulf area's Divisia Consumer Price Index, p= p t( ), are defined as:31
dt M dlog =1 log( ) = K
k k k k
k
d M s e
W
dt
dt M dlog
=
K
k=1 k
W dlog(M sk k)
dt log d dt =
Kk=1 k
W dlog( k ke )
dt log d dt =
Kk=1 k
W dlog( k)
dt
dt p dlog
=
K
k=1 k W
dt e dlog(pk k)
.
The corresponding discrete time Divisia growth indexes for the GCC monetary union are:
log Mt– log Mt-1 =
Kk=1
*
kt
W (log Mkt skt ekt– log Mk,t-1sk,t-1ek,t-1)
logMt - logMt1 =
K
k=1
*
kt
W (log Mkt sk, – log Mk t, 1 sk,t-1)
log Πt - log Πt-1 =
Kk=1
*
kt
W (log Π kt ekt - log Π k,t-1 ek,t-1 )
log Πt* - log Πt1 =
Kk=1
*
kt
W (log Πkt - log Πk t, 1 )
log Pt- logPt1=
K
k=1
*
kt
W (log Pkt ekt– log Pk t, 1 ek,t-1),
where Wkt= (1/ 2)(WktWk t, 1).
31
Barnett (2003) proved the relationship between the nominal versusreal variables hold, so that = p and
p M
In levels, the nominal and real per-capita Divisia monetary indexes, respectively, are
1 =1 , 1 , 1 , 1
= ( )
K W
t kt kt kt kt
t k k t k t k t
M M s e
M M s e
and
1 =1 , 1 , 1
= ( )
K
W
t kt kt kt
t k k t k t
M M s
M M s
.Observe that Fisher's factor reversal property holds for the monetary quantity and user
cost aggregates over countries. The total expenditure on monetary services aggregated over
countries would be the same, whether obtained by multiplying the monetary union's quantity by
its user cost aggregates or by the sum of the products within countries [see Barnett (2003) for a
complete proof]. This result leads to Fisher's factor reversal test for the Gulf area:
*
=1
= ( ).
K
t t kt kt kt kt k
M
M s eGiven the above relation, the price dual to the Gulf area Divisia monetary aggregates
could be easily computed by dividing expendure by the Gulf monetary aggregate, M, so that
=1
*
( )
=
K
kt kt kt kt k
t
t
M s e
M
Analogously to the within country case, the aggregate interest rate for the GCC
monetary union is:
1 , 1 ,
1 , 1 ,
( ) ( ) . ( ) ( ) k k k k K K
kjit kt kt kt kjit kjit kt kt
k i j S k i j S
t K K
kjit kt kt kjit kt kt
k i j S k i j S
m R s e r m s e
R
m s e m s e
Figures 1 and 2 depict the year-over-year growth rates of the Divisia and simple-sum
aggregated over the GCC countries. The narrow monetary Divisia growth rates for the GCC
union are equivalent to their counterpart simple-sum indexes --- as is the case for each single
country (figure 1). The Divisia growth rates of the broad monetary aggregates differ from the
business cycles, during which the growth rates are high in the economic boom -- fueled by
large oil revenues and massive government spending on infrastructure projects --- and low
afterwards, in periods when oil prices dropped sharply as a consequence of the distress over the
global economy. Figure 2 shows that the hump-shaped Divisia year-over-year growth rates are
more evident than the simple-sum’s. Specifically, Divisia year-over-year growth rates have
outreached the simple-sum’s. Divisia growth was below simple sum’s during recessions, while
above throughout expansionary phases. The findings suggest that the Gulf monetary council, if
guided by the simple sum, may overreact by implementing an excessive
contractionary/expansionary policy, when it is not needed.
Figure 7 depicts the year-over-year Divisia inflation rate versus the arithmetic average
inflation rate. At the beginning of the recent financial crises, the Divisia inflation rate diverged
from its counterpart and remained relatively higher than the arithmetic average inflation rate.
Since the inflation rate would be underestimated under the arithmetic average inflation rate, the
GMC monetary policy would be based upon misleading data, if the GMC were to use the
arithmetic average price index, as would be philosophically consistent with the simple-sum
[image:35.612.80.506.425.577.2]approach to aggregation over imperfect substitutes.
Figure 7: Year-over-Year Inflation Rates
Growth rates of dual prices, aggregate interest rates, and the Divisia aggregate user cost
may serve as an "economic stability" indicator for the GCC area. A high (low) variation of these
growths over time is associated with high (low) economic uncertainty. Figures 4,5, and 6 indicate
that the growth rates of the aggregate interest rates, dual prices, and Divisia aggregate user cost
prices of the broader Divisia aggregates for the GCC area are more volatile than the narrow
broad monetary aggregates and the world economy. Moreover, Divisia monetary aggregates
provide critical information about inside liquidity created by financial intermediaries. In the
aftermath of financial crises, the narrow aggregates were growing, while simultaneously the
broad aggregates plunged, indicating the shortfall of financial intermediaries in creating inside
money (figures 1 and 2).
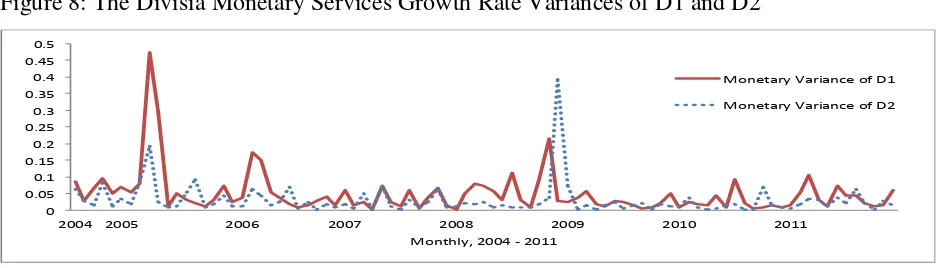
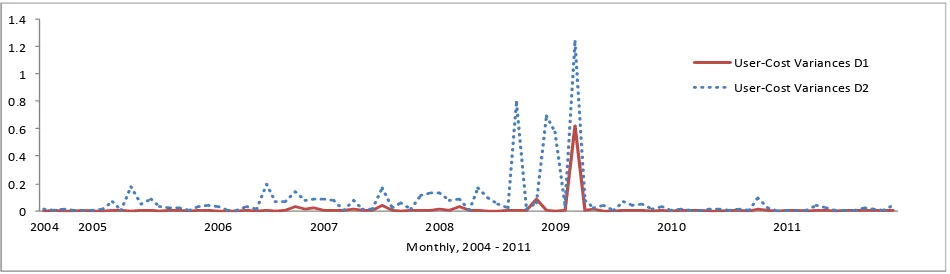
3.5 Divisia Second Moments and the Distribution Effects
We have seen the major role Divisia growth means in constructing the Divisia monetary
aggregates. We extend our analyses further to the Divisia second moments. Divisia variances
measure the degree to which monetary policy affects countries differently within a union.
Exploiting the Divisia second moments is of particular importance, especially to the GMC [see
Barnett (2003)]. Our GCC Divisia variances capture the distribution effects within Gulf countries
and simultaneously measure the progress made towards monetary and financial convergence.
Providing the Divisia second moments can not only help to identify the distribution effects of the
single monetary policy, but can also supply the GMC with additional tools to gauge the dynamics
of monetary policy.32 The Divisia growth rate variances computed about their means, across the
Gulf countries, are defined as:
32
By connecting user cost and monetary service growth rates, Barnett (2003) provided an additional measure of the effectiveness of transmission mechanisms that operate through interest rates. Since the GMC monetary policy is
committed to the de facto pegging of its exchange rate to the US dollar, rather than operating through interest rates,