ISSN Online: 2331-4249 ISSN Print: 2331-4222
Study on Sesame Export for Sudan Based on
Gravity Model
Mansour Yousif Ahmed Adam
1,2, Shiwei Xu
1,2*, Wen Yu
1,2, Shengwei Wang
1,2, Siek Darith
1,21Agricultural Information Institute, Chinese Academy of Agricultural Sciences, Beijing, China
2Key Laboratory of Digital Agricultural Early-Warning Technology, Ministry of Agriculture, Beijing, China
Abstract
This study aimed to investigate the effect of social and economic differences between importer and exporter countries on trade flows of Sesame seed product. The analysis was carried out by estimating the gravity model. The sample covered a total of 14 countries for the period from 1997 to 2009. The results showed that the social and economic differences between countries have a significant and positive or negative effect on Sesame seeds trade. Fur-thermore, we found that the same language, distance and sesame production in export country have positive effect for the sesame export from Sudan.
Keywords
Sesame, Trade, Gravity Model, Sudan, Partner Countries, Policy
1. Introduction
International trade allows many gains to countries linked to it. Efficiency gains, economies of scale, increasing competition and consequent reduction of prices, besides the increase in the variety of products at consumers’ disposal, can be cited as main benefits of commercial insertion [1] [2]. The republic of the Sudan is considering as the third largest nation, with 1,861,484 square kilometers in area, which is located in northeastern Africa, and its capital is Khartoum, and the population (2012 est.; excludes the population of South Sudan): 34,206,710 [3]. Sudan latitude and longitude coordinates position it on the northern side of the African continent beside the Red Sea. Further, Sudan’s latitude coordinates give it a position just in between Egypt and Eritrea the latitude and longitude denominations of Sudan are 15˚00N and 30˚00E respectively. Sudan’s economy relies mainly on rain-fed agriculture. Key cereal crops are sorghum, millet, se-same and wheat [4]. The authors choose this topic due to the follow reasons.
How to cite this paper: Adam, M.Y.A., Xu, S.W., Yu, W., Wang, S.W. and Darith, S. (2017) Study on Sesame Export for Su-dan Based on Gravity Model. World Jour-nal of Engineering and Technology, 5, 31- 39.
https://doi.org/10.4236/wjet.2017.52B004
Firstly, in today’s world, no nation exists in economic isolation. All aspects of a nation’s economy of its industries, service sectors levels of income and employ-ment, and living standard are linked to the economies of its trading partners. Secondly, from international movements of agricultural production trade busi-ness enterprise, this has high comparative advantage, and over the past 50 years the world’s market economies have become increasingly interdependent and good facilities and agriculture resources for sesame in Sudan. Recently, many scholars use gravity model to study trade. For example, agriculture trade gravity model was mentioned by scholars [5] [6] [7] [8] published paper but not used in Sudan Sesame trade.
In this study, the structure is listed in the following: after the introduction, the data source and method are introduced, and then the results from the gravity model are analyzed; in the end, the conclusions are supplied.
2. Methodology
2.1. Data Source
All data about Sudan in this study originates from Food and Agricultural Or-ganization (FAO) of United Nation [9]. Categorically the data concentrates on 5 staple crops including their cultivated area, the total output and yield. At first, the crop structure and their production are introduced, in the following, cassava, maize, rice, millet, beans, cowpeas, plusses, Bambara, peanut, oil palm, sesame, soybeans, bananas, root tuber, vegetable, sweet potatoes, coffee, tea, cotton, su-garcane [10]. The GDP data for the partner countries is form Country Economy website. The data for distance between Sudan and partner Countries is from distance between two countries website.
2.2. Data Description
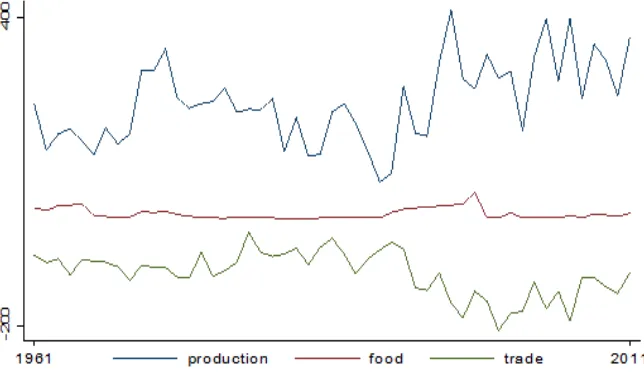
[image:2.595.211.533.529.717.2]Figure 1 shows that production line moving between increasing and decreasing since 1961 with high rate but in 2006 it record high level and continue up and
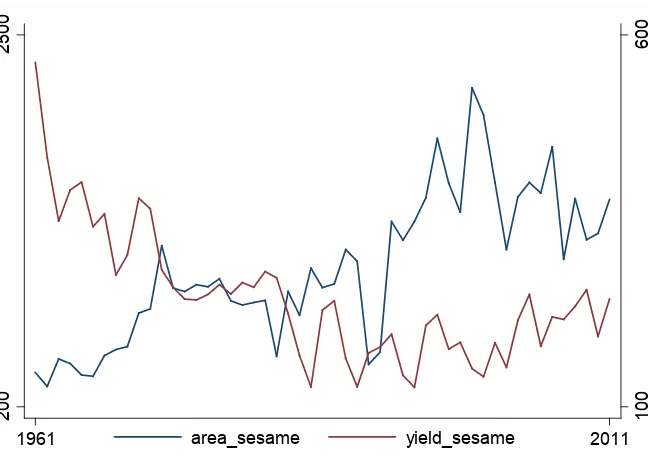
Figure 2. Sesame area and yield balance in Sudan during 1961-2011 (Unit: ha·kg).
down till 2011, supply curve also start moving in fixed way, from 1970 to 1973 where was high increase happened then the curve rise and low for the hole pe-riod of time, food consumption line was flat moving with little increase in 1998 reach 60,000 ton, and then continue decreasing in the rest of next years, the trade curve show that the export is take progress moving with fixed a way accept in 1969, 1973, 1974 those three year decreased that mean 80%of sesame is for export. Similarly, Figure 2 illustrates the sesame area and yield balance in Sudan during the period of (1961-2011) as seeing below.
3. Modeling
Based on the purpose of this work and in the theoretical considerations, it is in-tended to describe the situation approach to be used. Reference is made to speci-fications and methods of estimation to be employed to obtain empirical gravity equations. In the following, the gravity model is given.
, 2 j,t 3 jt 4 ij
5 ij 7 j
ln(
)
ln(consum )
ln(dist)
border
lang
GDP
jt t i s
Y
β
prod
β
β
β
β
β
µ
=
+
+
+
+
+
+
Y: denotes agricultural import quantity from Sudan;
t: denotes year;
j: denotes importer country;
prod: denotes sesame production in exporter country;
consum: denotes consumption (seed, waste, processing, and food) in importer
country;
dist: denotes the distance between the countries;
border: denotes variable value one if the two border countries and zero in
op-posite;
lang: denotes the two countries speak same languages
100
600
200
25
00
GDP: denotes Gross Domestic production
This study is focus in one agriculture product export of sesame from Sudan with 14 countries around the world.
The gravity model is based on the idea that trade flows are proportional to the product of economic masses of the importing and exporting country and in-versely proportional to their geographical distance. Since its first development the gravity model has been a “work horse” for economic analyses of trade. Al-though not founded in economic theory, the model is particularly successful in representing trade flows.
High values are recorded in the case of applications to general sectorial trade while lower values of 0.3 - 0.5 are normally expected in sectorial trade models. Apart from its empirical success, an important merit of the gravity model was to show the still important role of geographical distance as a source of trade friction and to support the development of the “New trade theory”. Recent methodolog-ical developments provided stronger theoretmethodolog-ical micro-foundation to the model and model and increased its acceptance among economists.
In the model, we found the same language may be easy to communicate be-tween partner countries, and the tendency (denoted as “t”) might respect the time tend; and border could influence the trade cost. So the model covers many factors.
4. Results
[image:4.595.55.541.481.746.2]The model results are listed in Table 1 and Table 2 which generally depict the suitable of the sesame situation by using Gravity Model results in the partner countries separately.
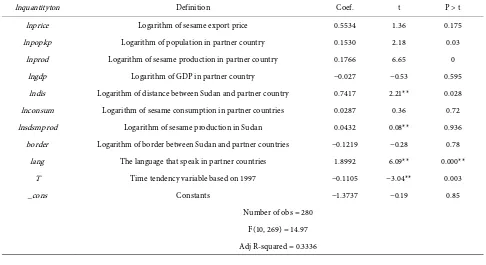
Table 1. Estimation of the gravity model for different countries of the sesame important from Sudan.
lnquantityton Definition Coef. t P > t
lnprice Logarithm of sesame export price 0.5534 1.36 0.175
lnpopkp Logarithm of population in partner country 0.1530 2.18 0.03 lnprod Logarithm of sesame production in partner country 0.1766 6.65 0
lngdp Logarithm of GDP in partner country −0.027 −0.53 0.595
lndis Logarithm of distance between Sudan and partner country 0.7417 2.21** 0.028 lnconsum Logarithm of sesame consumption in partner countries 0.0287 0.36 0.72 lnsdsmprod Logarithm of sesame production in Sudan 0.0432 0.08** 0.936
border Logarithm of border between Sudan and partner countries −0.1219 −0.28 0.78 lang The language that speak in partner countries 1.8992 6.09** 0.000**
T Time tendency variable based on 1997 −0.1105 −3.04** 0.003
_cons Constants −1.3737 −0.19 0.85
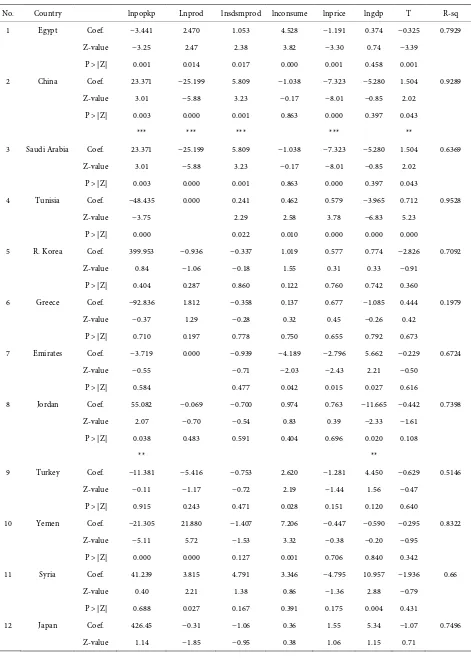
Table 2. Estimation of the gravity model by countries.
No. Country lnpopkp Lnprod lnsdsmprod lnconsume lnprice lngdp T R-sq 1 Egypt Coef. −3.441 2.470 1.053 4.528 −1.191 0.374 −0.325 0.7929
Z-value −3.25 2.47 2.38 3.82 −3.30 0.74 −3.39 P > |Z| 0.001 0.014 0.017 0.000 0.001 0.458 0.001
2 China Coef. 23.371 −25.199 5.809 −1.038 −7.323 −5.280 1.504 0.9289 Z-value 3.01 −5.88 3.23 −0.17 −8.01 −0.85 2.02
P > |Z| 0.003 0.000 0.001 0.863 0.000 0.397 0.043
*** *** *** *** **
3 Saudi Arabia Coef. 23.371 −25.199 5.809 −1.038 −7.323 −5.280 1.504 0.6369 Z-value 3.01 −5.88 3.23 −0.17 −8.01 −0.85 2.02
P > |Z| 0.003 0.000 0.001 0.863 0.000 0.397 0.043
4 Tunisia Coef. −48.435 0.000 0.241 0.462 0.579 −3.965 0.712 0.9528
Z-value −3.75 2.29 2.58 3.78 −6.83 5.23
P > |Z| 0.000 0.022 0.010 0.000 0.000 0.000
5 R. Korea Coef. 399.953 −0.936 −0.337 1.019 0.577 0.774 −2.826 0.7092 Z-value 0.84 −1.06 −0.18 1.55 0.31 0.33 −0.91
P > |Z| 0.404 0.287 0.860 0.122 0.760 0.742 0.360
6 Greece Coef. −92.836 1.812 −0.358 0.137 0.677 −1.085 0.444 0.1979 Z-value −0.37 1.29 −0.28 0.32 0.45 −0.26 0.42
P > |Z| 0.710 0.197 0.778 0.750 0.655 0.792 0.673
7 Emirates Coef. −3.719 0.000 −0.939 −4.189 −2.796 5.662 −0.229 0.6724
Z-value −0.55 −0.71 −2.03 −2.43 2.21 −0.50
P > |Z| 0.584 0.477 0.042 0.015 0.027 0.616
8 Jordan Coef. 55.082 −0.069 −0.700 0.974 0.763 −11.665 −0.442 0.7398 Z-value 2.07 −0.70 −0.54 0.83 0.39 −2.33 −1.61
P > |Z| 0.038 0.483 0.591 0.404 0.696 0.020 0.108
** **
9 Turkey Coef. −11.381 −5.416 −0.753 2.620 −1.281 4.450 −0.629 0.5146 Z-value −0.11 −1.17 −0.72 2.19 −1.44 1.56 −0.47
P > |Z| 0.915 0.243 0.471 0.028 0.151 0.120 0.640
10 Yemen Coef. −21.305 21.880 −1.407 7.206 −0.447 −0.590 −0.295 0.8322 Z-value −5.11 5.72 −1.53 3.32 −0.38 −0.20 −0.95
P > |Z| 0.000 0.000 0.127 0.001 0.706 0.840 0.342
11 Syria Coef. 41.239 3.815 4.791 3.346 −4.795 10.957 −1.936 0.66 Z-value 0.40 2.21 1.38 0.86 −1.36 2.88 −0.79
P > |Z| 0.688 0.027 0.167 0.391 0.175 0.004 0.431
Continued
P > |Z| 0.26 0.07 0.34 0.71 0.29 0.25 −1.50
13 Algeria Coef. −391.833 0.000 −0.884 0.665 −0.042 155.313 4.236 0.7888
Z-value −1.91 −0.73 1.25 −0.04 0.69 3.16
P > |Z| 0.057 0.468 0.211 0.969 0.489 0.002
14 Poland Coef. 325.861 0.000 −0.362 0.740 1.868 −3.451 0.445 0.6287
Z-value 1.39 −0.36 2.68 1.54 −1.87 2.22
P > |Z| 0.166 0.721 0.007 0.124 0.061 0.026 Note: (*p < 0.05, **p < 0.01, ***p < 0.001).
Sesame export price increases 1%, sesame export quantity increases 0.5534%, but the price impact is not significant. When the population increases 1%, the sesame export quantity increases also by 0.1530%, and it is significant obviously. When sesame production on partner countries increases 1%, its import quantity increases 0.1766% absolutely. When the GDP increase 1%, the import sesame quantity increase by 0.0269, and it enable the country to use budget for import product, but it is not significant. When the distance between Sudan and partner countries is 1%, the sesame export quantity increase 0.7417%, possible reason is that agricultural structure is deferent from each other, as benefit sesame trade between them. When the sesame consumption increased by 1%, the sesame ex-ports production decreased by 0.0431, and this influence exex-ports quantity. When two partner countries speak same language the sesame export quantity increase by 1.899% than other countries, and it is easy for communicate trade and busi-ness. In the following, we ran the gravity model to 14 countries with Sudan, and got the relative results in the following, respectively.
Egypt: Overall the values of the coefficients for sesame indicate that trade is hindered by the population the trading partners (−3.44) and, when the price rise also effected (−1.19) and favored by the production volume of the exporter (1.05) and importer (2.46), and attract by large GDP of the importer
China: From the values of the coefficients for sesame indicate that sesame trade is hindered by the Sesame Production in China (−25.20) and trade price (−7.32); and favored by the population volume (23.37), as is rigid demand, the sesame production of the export country-Sudan (5.81), and time tendency (1.50).
Syria: Overall the values of the coefficients for sesame indicate that trade is hindered by the price (−4.79) and time tendency (−1.93) and favored by the production volume of the exporter (4.79) and importer (3.81), by large GDP of the importer (10.95) capita consumption of the importer (3.34) and by regional trade agreements .As for agricultural commodities.
(5.81.), and population (23.37), and by regional agricultural commodities trade agreements.
Tunisia: From the values of the coefficients for seafood indicate that trade is hindered by the population (−48.43) add of the importer (−0.3) the production volume of the importer favored by the production volume of the exporter (0.46), and price (0.57) capita consumption of the importer (0.46) and time tendency (0.71) by regional trade agreements as for agricultural commodities, trade.
Republic of Korea: From the values of the coefficients for sesame indicate that trade is hindered by the geographical distance between the trading partners (−464.2), production volume of the importer (0.93) and exporter (−0.33), time tendency (−2.82), and low GDP of the importer (0.77) favored by the consump-tion volume of the importer (1.01).
Greece: From the values of the coefficients for seafood indicate that trade is hindered by the geographical distance between the trading partners (108.75), and by the production volume of the exporter (−0.35), low of GDP of the im-porter and favored by the production volume of the exim-porter (1.81).
Jordan: Overall the values of the coefficients for sesame indicate that sesame trade is hindered by the GDP of Jordan (−11.67), maybe the added GDP is used to import other things; and favored by the population volume (55.09), as is Rigid demand, and by regional trade agreements for agricultural commodities trade.
Emirates: Overall the values of the coefficients for seafood indicate that trade is hindered by the population from the importer (−3.71), by the production vo-lume of the exporter (−0.93), price from importer country (−2.76), and time tendency (−0.22), and favored and attracted by large GDP of the importer (5.66), and by regional trade agreements for agricultural commodities trade.
Turkey: Overall the values of the coefficients for sesame indicate that trade is hindered by the population of the importer (−11.38), rather than being hindered by production of importer (−5.45) and exporter (−0.75), time tendency (−0.62), and favored by the consumption value of importer (2.61), rather than being fa-vored by the GDP of the importer (4.44).
Yemen: From the values of the coefficients for seafood indicate that trade is hindered by the population of the importer (−21.30), production volume of the exporter (−1.40), low GDP of importer (−0.29), favored by the, production vo-lume of the importer (21.88), capita consumption of the importer (7.21) and by regional trade agreements as for agricultural commodities trade.
Japan: From the values of the coefficients for sesame indicate that trade is hindered by the production volume of the exporter (−1.05) and importer (−0.31), time tendency also has effect (−1.06), geographical distance between the trading partners (−541.48) and favored by the population (426.45), capita con-sumption of the importer (0.35) and by large GDP of the importer (5.34).
by large GDP of importer (1.55), and by regional trade agreements as agricultur-al commodities trade.
Poland: Overall the values of the coefficients for sesame indicate that trade is hindered by the capita consumption of the importer (−0.36) geographical dis-tance between the trading partners (3.41) and low by GDP of importer (−3.45), and favored by the time tendency volume of the (0.44), per capita consumption of the importer (0.73).
5. Conclusion
This study provided an estimate of sesame trade determinants through an appli-cation of the gravity model between importer and exporter countries. Through our experience and this research study, we can say it seems we need different technology to enhance framer skills associated with some technical of new se-same seeds and expiate the trade partner by increase more importer countries. The application of the model to the different groupings within the sesame gives a highly variegated picture of trade determinants. Anyway, there are two factors that should pay more attention: one is the same language; another is the popula-tion. The export countries could have a good trade with the countries with the two characteristics.
Acknowledgements
This paper was supported by the CAAS Science and Technology Innovation Project (number: CAAS-ASTIP-2017-AII), founded by Chinese Academy of Agricultural Sciences.
References
[1] Abdel, S.M.I., Xu, S.W. and Yu, W. (2013) Food Accessibility, a Viability and Stabil-ity in Rural White Nile State of Sudan. International Journal of Agricultural Science and Research (IJASR), 3, 43-56.
[2] Robert, J.C. (2011) International Trade (13th ed.). China Renmin University Press, Beijing.
[3] Fact Monster (2017) Sudan, Sandbox Networks, Inc., Publishing as Fact Monster. (Accessed April, 2017). https://www.factmonster.com/country/sudan
[4] Abdel, S.M.I., Xu, S.W. and Yu, W. (2013) The Impact of Social Factors of Rural Households on Livestock Production and Rural Household Income in White Nile State of Sudan. International Journal of Agricultural and Food Research, 2, 1-13. https://www.sciencetarget.com/Journal/index.php/IJAFR/article/view/343 [5] Luyolo, D.M. (2016) South Africa’s Citrus Trade Flows among the BRIC Countries:
Brazil, Russia, India and China. PHD Thesis, CAAS, Beijing.
[6] Loyolo, M., Li, Z.M., Yu, W. and Wu, P. (2016) South Africa’s Citrus Trade Flows among the BRIC Countries: Brazil, Russia, India and China. International Journal of Agricultural Science and Research (IJASR), 6, 179-188.
[7] Vin, S. (2015) The Study on Rice Trade between Cambodia and the Great Mekong Subregion: China, Thailand and Vietnam. PHD Thesis, CAAS, Beijing.
Mekong Subregion: Vietnam, Thailand and China. International Journal of Agri-cultural Science and Research (IJASR), 4, 147-154.
[9] FAOSTAT (2016) Data for Production and Trade. http://www.fao.org/faostat [10] Cataluña, C.V., Andalucía, P.V. and Extremadura A. (2017) Sudan GDP, Gross
Domestic Product. http://countryeconomy.com/gdp/sudan
Submit or recommend next manuscript to SCIRP and we will provide best service for you:
Accepting pre-submission inquiries through Email, Facebook, LinkedIn, Twitter, etc. A wide selection of journals (inclusive of 9 subjects, more than 200 journals)
Providing 24-hour high-quality service User-friendly online submission system Fair and swift peer-review system
Efficient typesetting and proofreading procedure
Display of the result of downloads and visits, as well as the number of cited articles Maximum dissemination of your research work
Submit your manuscript at: http://papersubmission.scirp.org/