Developing a Thermodynamical Method for Prediction of
Activity Coefficient of TBP Dissolved in Kerosene
Eskandar Keshavarz Alamdari1,2, Sayed Khatiboleslam Sadrnezhaad3 1Department of Mining and Metallurgical Engineering, Amirkabir University of Technology, Tehran, Iran 2Research Center for Materials and Mining Industries Technology, Amirkabir University of Technology, Tehran, Iran
3Department of Materials Science and Engineering, Sharif University of Technology, Tehran, Iran
Email: [email protected], [email protected]
Received December 31, 2012; revised February 13, 2013; accepted February 20, 2013
Copyright © 2013 Eskandar Keshavarz Alamdari, Sayed Khatiboleslam Sadrnezhaad. This is an open access article distributed under the Creative Commons Attribution License, which permits unrestricted use, distribution, and reproduction in any medium, provided the original work is properly cited.
ABSTRACT
Results of the experimental measurements on the partial molar volume of kerosene used as a medium for dissolving TBP are utilized to determine the activity of TBP in the binary kerosene-TBP solution through the application of Gibbs-Duhem equation. The treatment is based on combination of the experimental data with the thermodynamic values available on the compressibility factor of pure kerosene at room temperature. It is shown that the activity of TBP in kerosene has a positive deviation from ideality with an activity coefficient derived as follows: 1) at XTBP0.01:
TBP 42.530
, 2) at the 0.01XTBP0.2: TBP kerosene2 kerosene kerosene 0.2913 0.2843
ln
1 1.8674 0.8687 X
X X
3) at higher TBP concen-
trations 0.2XTBP0.97: ln TBP kerosene 1 1.55
2
kerosene kerosene 0.0146 1.2826
95 1.9594
X
X X
and 4) at TBP Raoultian concentrations
TBP
0.97 X :TBP 1. These quantities can be utilized at temperature closed to 298 K.
Keywords: Thermodynamics; Activity; Activity Coefficient; Kerosene; TBP; Organic Solution
1. Introduction
Activities of the spices dissolved in organic aromatic solutions are of the important information required for understanding of the thermodynamics of the solvent ex- traction regimes usually utilized in production of the nonferrous metals. It has been reported that the activity coefficients of involved components in the extraction reaction of metals during extraction processes are usually equal to one [1-10]. However, the activities in the real component values are significantly different from the ideal state. The activity coefficient of components (espe- cially components in aqueous media) was estimated by using some conventional thermodynamic models such as Debye-Hückel or Pitzr Equation [11]. On the other hand, due to the physicochemical interaction of organic com- ponents, the mathematical models could be used in some special cases. By applying the correct value of the activ- ity coefficients in the extraction equations, a correct ma- thematical model can predict an acceptable value for extracted metals.
The thermodynamic evaluation of the distribution ratio of metals, for instance, becomes much easier if the activ- ity of coefficient tri-n-butyl phosphate (TBP) dissolved in kerosene becomes precisely known. There is, however, no data available in the literature on the activity coeffi- cient of different spices dissolved in such aromatic or ali- phatic solutions as kerosene.
TBP is a common organic material which uses as ex- tractant and/or modifier in the presence of some aliphatic diluents such as kerosene. Therefore, developing an ana- lytical method for the prediction of the activity coeffi- cients of organic component could be useful for future investigations. In this paper, an analytical method for determination of the activity and the activity coefficient of TBP dissolved in kerosene is developed and presented.
2. Thermodynamical Parameters and
Prediction of the Activity and the Activity
Coefficients
energy of the spices i depends on the composition of the
solution. The difference between the partial molar Gibbs free energy of the spices i and the molar Gibbs free en-
ergy of pure i is the change in the Gibbs free energy ac-
companying the formation of one mole of i dissolved in
the solution; S i G
[12-15]. Thus:
ln ln ln ln
S
i i i i i
G RT a RT X RT X
i
(1)on the other hand:
d S Sd S
i i i
G S T V
dP (2)
where S i S
and S
i V
are the partial molar entropy and the partial volume change of the dissolution reaction, respectively. In the isothermal condition, Equation (2) is rewritten as:
d S S
i i
G V
dP (3)
The molar volume of a multi component solution is defined by: 1 n S i i i
V X V
S
(4)
The molar volume of the mechanical mixture can simi- larly be defined by:
1
n i i i V X V
(5)The volume change due to the formation of the solu- tion is, thus, given by:
1n
S S S
i i i i
V V V X V V
(6)The value of for a binary solution, which ex- hibits negative deviation from ideality, is less than zero. Based on known thermodynamic relationships available [12-15], the volume change of the species A in a binary A-B system can be obtained from:
S V
, S S S A B A T P VV V X
X (7)
Also, the isothermal compressibility of a substance, or a system, is defined as:
1 T V V P
(8)
This is the fractional decrease in the volume of the system for unit increase in pressure at constant tempera- ture. For pure A, the isothermal compressibility is de- fined as:
1 A A A T V P V
(9)
and for species A of the binary solution:
1 A A A T V V P
(10)
if we assume that:
A A
(11)
then from Equations (9) and (10):
1 1 A
A
A T T
V
P V P
V A V (12)
hence at a constant temperature, we have:
A A A V V V V A (13) or: A A A V V V V
A (14)
and also:
A
A A A
V V
V V V V
A A
(15)
or:
A
S S A A V V V V
A (16)
then:
1 A 1 AS
S
A T A
T V V P P V V
(17)
hence:
1 AS
A S A T V P V
(18)
At a constant temperature, Equation (18) can be rear- ranged as:
d d S A S A A V P V (19) by substituting the value of (dP) from Equation (19) into
Equation (3), we have:
d
d S A S A A V G
(20)
and from Equation (1), we obtain:
d
d ln S A A A V a RT
(21)
Integrating Equation (21) from the initial condition where XA= 1 and 0
S A V
ln at at
ln at 1 at 1
d
d ln S
A A A A
S
A A A A
S
a X V X A
A
a X V X
A
V a
RT
(22)or:
0 d ln AS
A
S
V A
A
V a
RT
(23)The value of the right hand side at Equation (23) can graphically be obtained by plotting the quantity of
1
A
RT vs
S A
V
, and determining the area under the
curve. The activity coefficient of the species A of binary
solution can thus be obtained from:
A A
A
a X
(24)
The activity coefficient of the second component of the solution can be determined by integration the Gibbs- Duhem equation [12-15]:
ln at ln at
ln at 1d ln ln at 1 d ln
B B A B
B B A B
X X
A
B A
X X
B
X X
(25)At the boundary condition where XB and B are equal to one, A equals to A
, thus:
ln ln
ln A d ln
A
A
B A
B
X X
(26)The activity of species B is, thus, determined from:
B B B
a X (27)
3. Material and Methods
Both TBP and kerosene, which were used, were of ana- lytical grade from Fluka AB., Switzerland. Small quan-tity of TBP weighted with a mettler 240 balance system was added to a calibrated 100-ml. Kerosene was instilled to the 100-ml flask and the solution was mixed thor- oughly. The solution was then retained for five to ten minutes to absorb the required heat for reaching to che- mical equilibrium. The total weight of the solution was then measured.
The experiments were carried out at constant room temperature (298 K). The molecular weight of the pure TBP was equal to 263.32 gr/mole. The molecular weight of the used kerosene was determined by the gas chroma- tography and the change of the melting point methods. In the latter, the melting temperature change was measured by analytical grade phenol with a molecular weight of 94.11 gr/mole .The molecular weight of kerosene was the determined from [16,17]:
,phenol phenol
phenol ,phenol 1000
ln f
m
H T X
M RT m
(28)
where phenol is mole fraction of phenol in dilute phe- nol-kerosene solution, f,phenol is the latent heat of melting of phenol in its melting point Tm,phenol,
X
H
T
is
the change of melting point of solution when the molality of kerosene in dilute solution is m and phenol is the molecular weight of phenol. The result was equal to 173.3 gr/mole.
M
With the experimental data, the integral molar volume of the solution
SV and the integral molar volume
change of the solution
S
V
were determined from Equations (4) and (6). akerosene (Equation (23)), kerosene (Equation (24)), TBP (Equation (26)) and (Equa- tion (27)) were then evaluated. TBP
a
4. Results and Discussion
[image:3.595.312.533.518.690.2]There is not much known of the physical properties of TBP. Determination of the activity and the activity coef- ficient of TBP is, therefore, derived from the corre- sponding quantities for kerosene. The isothermal com- pressibility of kerosene at 298 K and 1 atm pressure is known to be 1.45 10−4 atm−1 [18]. Applying this value to Equation (23), the activity of kerosene is, therefore, being determined.
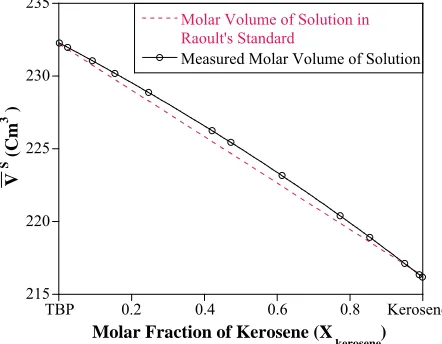
Figure 1 shows the integral molar volume of the bi-
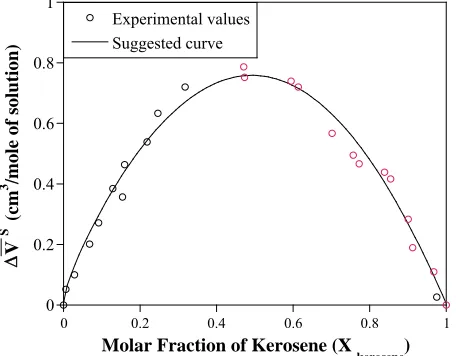
nary kerosene-TBP solution as a function of the kerosene mole fraction; Xkerosene. As shown in this figure, the inte- gral molar volume of the solution has a positive deviation from the ideal behavior (dashed line). This quantity is defined by Equation (4). Figure 2 illustrates the relative
molar volume of the binary solution
SV
versus kerosene mole fraction. It is seen from this figure that, the molar volume of the formation of the binary solution has a positive deviation from ideality and has a maxi- mum near Xkerosene0.45. The predicted value of the215 220 225 230 235
TBP 0.2 0.4 0.6 0.8 Kerosene
Molar Volume of Solution in Raoult's Standard
Measured Molar Volume of Solution
Molar Fraction of Kerosene (X
kerosene)
V
S (C
m
3 )
Figure 1. The integral molar volume of TBP-kerosene bi- nary solution as a function of measured at room temperature.
kerosene
volume change has a correlation with the experimental data:
2.5 3 0.5
kerosene kerosene kerosene kerosene
1.75 3.49 1.24 0.46
S
V
X X X X
(29) The molar volume change of the kerosene dissolved in the binary solution is determined from Equation (7) as a function of kerosene. Figure 3 illustrated the partial mo- lar volume change of kerosene
X
kerosene SV
as a function of kerosene. The partial molar volume changes of the kerosene in the pure TBP and in the pure kerosene are equal to infinity and zero, respectively.
X
Xkerosene0
Xkerosene1Based on Equation (14), the activity of kerosene can be determined by using a graphical method. Figure 4
0 0.2 0.4 0.6 0.8 1
0 0.2 0.4 0.6 0.8 1
Experimental values Suggested curve
V
S (cm 3 /mole of solution)
Molar Fraction of Kerosene (X
[image:4.595.310.537.290.479.2]kerosene)
Figure 2. The relative integral molar volume of the kero- sene-TBP solution versus the solution composition.
0 2 4 6 8 10
0 0.2 0.4 0.6 0.8 1
V
S kerosene
(cm
3 /mole)
Molar Fraction of Kerosene (X
[image:4.595.59.287.302.480.2]kerosene)
Figure 3. The relative partial molar volume of kerosene as a function of composition.
illustrates that the change of 1RTkerosene vs
kerosene
M
V
at the constant temperature 298˚K. We have assumed that the isothermal compressibility constant of the kerosene at every composition of binary solution is constant and that the compositional change has no sig- nificant effect on its value. So the activity of the kerosene is determined from the area under the curve plotted in
Figure 4, as was stated by Equation (23). The results are
given in Figure 5 (solid line). As shown in this figure,
the activity of the kerosene indicates a very positive de- viation from ideality, especially at low concentrations. A curve fitting method can be used to determine the activity of the kerosene at
kerosene
kerosene TBP kerosene
0.03
213.045 213.045 213.045
X
a X
X (30)
0.25 0.26 0.27 0.28 0.29 0.3
0 2 4 6 8
10
RT
-1
( VS
kerosene)
Figure 4. The value of 1 RTkerosene vs molar volume change of kerosene in binary kerosene-TBP solution.
0 0.2 0.4 0.6 0.8 1
0 0.2 0.4 0.6 0.8 1
Raoult's Line
Molar Fraction of Kerosene (X
kerosene)
Kerosene Activity (a
keros
ene
)
[image:4.595.308.536.520.704.2] [image:4.595.63.285.522.705.2]and at the higher kerosene concentration, the activity of kerosene is determined by:
kerosene
2 3
TBP TBP TBP
2 3
TBP TBP TBP
0.993 1.210 0.23087 0.002 1 1.169 1.068 0.870 a
X X
X X X
X (31)
The activity coefficient of kerosene is determined from Equation (24). Figure 6 shows the change of kerosene as a function of kerosene. With the method of curve fitting, the activity coefficient of the kerosene at
is determined by: X
ne0.2 kerose 0.03X
kerosene
2
TBP TBP
2 2
TBP TBP TBP
ln
0.2796 0.5576 0.2784 1 2.9145 2.8292 0.9146
X X
X X
X
(32)
at the higher kerosene concentrations
, the activity coefficient of kero- sene is determined by:
kerosene0.2X 0.99
TBP
kerosene 2
TBP TBP
0.0006 0.1858 ln
1 1.8296 1.1551 X
X X
(33)
The Henry’s constant for the kerosene is
determined by:
kerosene
kerosene kerosene
kerosene
kerosene 0 kerosene 0
kerosene
lim lim 214.35
X X
a X
(34) The Gibbs-Duhem Equation and its results (Equations (23) and (26)) help to determine the activity coefficient of the TBP with a graphical method. Figure 7 shows the
value of kerosene TBP X
X vs lnkerosene. The results of the calculations are shown in Figure 8. With the curve fit-
ting method, the activity coefficient of the TBP at
0 50 100 150 200 250
0 0.2 0.4 0.6 0.8 1
Molar Fraction of Kerosene (X
kerosene)
Activ
ity
Co
efficient o
f Kero
sene (
kero
sene
)
Figure 6. Activity coefficient of kerosene as a function of concentration.
0 2 4 6 8 10
0 0.5 1 1.5 2 2.5 3 3.5 4
X
kerosene
ln
kerosene
X
TBP
[image:5.595.310.535.87.488.2]
Figure 7. The value of kerosene TBP
X
[image:5.595.64.284.529.705.2]X vs lnkerosene.
Figure 8. The activity coefficient of TBP as a function of the molar fraction of the kerosene.
TBP 0.01
X is determined by:
TBP 42.530
, (35) at 0.01XTBP0.2 is given by:
kerosene
TBP 2
kerosene kerosene 0.2913 0.2843
ln
1 1.8674 0.8687 X
X X
(36)
and at the higher TBPconcentrations
0.2XTBP0.97
, the activity coefficient of TBP is evaluated by:kerosene
TBP 2
kerosene kerosene 0.0146 1.2826
ln
1 1.5595 1.9594 X
X X
(37)
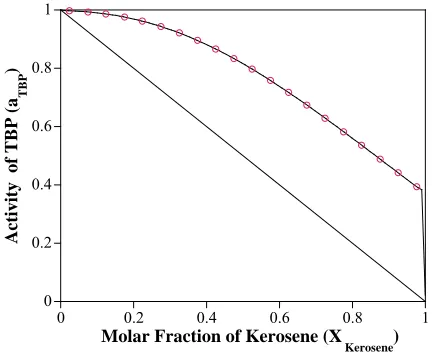
So the Henry’s constant for the TBP is equal to 42.530. The values of the activity of the TBP evaluated from an equation similar to Equation (24) are shown in Figure 9.
0 0.2 0.4 0.6 0.8 1
0 0.2 0.4 0.6 0.8 1
Molar Fraction of Kerosene (X
Kerosene)
Activity of TBP (a
TBP
[image:6.595.65.281.86.268.2])
Figure 9. The activity of TBP vs Xkerosene.
from ideality. With the curve fitting method, the activity of the TBP at XTBP0.01 is determined by:
TBP 42.35 42.35 kerosene 42.35 TBP
a X X , (38)
at 0.01 XTBP0.2. It is evaluated by:
kerosene
TBP 2
kerosene kerosene 0.1013 0.0134
ln
1 1.5101 0.6266 X a
X X
(39)
at the higher TBP concentration , the activity of TBP is determined by:
0.2 TBP 0.97X
kerosene
TBP 2
kerosene kerosene 0.0031 0.1264
ln
1 2.0240 1.2479 X a
X X
(40)
and at Raoultian range
0.97XTBP
: aTBPXTBP.5. Summary
An analytical method is presented in this paper for de- termination of the activity of the TBP dissolved in the kerosene through a simple physical property measure- ment. The results show that the binary solution of the kerosene with the TBP has a positive deviation from the Raoult’s law behavior. The Henry’s constant of very di- lute TBP in kerosene is equal to 42.350. This constant for very dilute kerosene in TBP is equal to 214.35. The ac- tivity coefficient of the TBP at is
deter-mined by: TBP
0.01 X TBP 42.530
, at is
given by: TBP
0.01X 0.2
kerosene
TBP 2
kerosene kerosene 0.2913 0.2843
ln
1 1.8674 0.8687 X
X X
and at the higher TBP concentrations the activity coeffi-
cient of the TBP is determined by:
kerosene
TBP 2
kerosene kerosene 0.0146 1.2826
ln .
1 1.5595 1.9594 X
X X
Also the activity of TBP at is deter-
mined by:
TBP 0.05 X
TBP 42.35 42.35 kerosene 42.35 TBP
a X X
at 0.01XTBP0.2 is given by:
kerosene
TBP 2
kerosene kerosene 0.1013 0.0134
ln
1 1.5101 0.6266 X a
X X
and at the higher TBP concentrations the activity of TBP is determined by:
kerosene
TBP 2
kerosene kerosene 0.0031 0.1264
ln
1 2.0240 1.2479 X a
X X
.
REFERENCES
[1] E. Keshavarz Alamdari, D. Darvishi, D. F. Haghshenas, N. Yousefi and S. K. Sadrnezhaad, “Separation of Re and Mo from Roasting-Dust Leach-Liquor Using Solvent Ex- traction Technique by TBP,” Separation and Purification Technology, Vol. 86, 2012, pp. 143-148.
doi:10.1016/j.seppur.2011.10.038
[2] D. Darvishi, D. F. Haghshenas, E. Keshavarz Alamdari and S. K. Sadrnezhaad, “Extraction of ZN, MN and CO from ZN-MN-CO-CD-NI Containing Solution Using D2EHPA, Cyanex® 272 and Cyanex® 302,” International Journal of Engineering, Transactions B: Applications,
Vol. 24, No. 2, 2011, pp. 183-192.
[3] D. F. Haghshenas, D. Darvishi, S. Etemadi, A. R. Eivazi Hollagh, E. Keshavarz Alamdari and A. A. Salardini, “In- teraction between TBP and D2EHPA during Zn, Cd, Mn, Cu, Co and Ni Solvent Extraction: A Thermodynamic and Empirical Approach,” Hydrometallurgy, Vol. 98, No. 1-2, 2009, pp. 143-147.
[4] D. F. Haghshenas, D. Darvishi, H. Rafieipour, E. Kesha- varz Alamdari and A. A. Salardini, “A Comparison be- tween TEHA and Cyanex 923 on the Separation and the Recovery of Sulfuric Acid from Aqueous Solutions,”
Hydrometallurgy, Vol. 97, No. 3-4, 2009, pp. 173-179. doi:10.1016/j.hydromet.2009.02.006
[5] D. Darvishi, D. F. Haghshenas, S. Etemadi, E. Keshavarz Alamdari and S. K. Sadrnezhaad, “Water Adsorption in the Organic Phase for the D2EHPA-Kerosene/Water and Aqueous Zn2+, Co2+, Ni2+ Sulphate Systems,” Hydro- metallurgy, Vol. 88, No. 1-4, 2007, pp. 92-97.
doi:10.1016/j.hydromet.2007.02.010
[6] D. Darvishi, D. F. Haghshenas, E. Keshavarz Alamdari, S. K. Sadrnezhaad and M. Halali, “Synergistic Effect of Cyanex 272 and Cyanex 302 on Separation of Cobalt and Nickel by D2EHPA,” Hydrometallurgy, Vol. 77, No. 3-4,
2005, pp. 227-238. doi:10.1016/j.hydromet.2005.02.002
[7] E. Keshavarz Alamdari, D. Moradkhani, D. Darvishi, M. Askari and D. Behnian, “Synergistic Effect of MEHPA on Co-Extraction of Zinc and Cadmium with DEHPA,”
Minerals Engineering, Vol. 17, No. 1, 2004, pp. 89-92. doi:10.1016/j.mineng.2003.10.003
[8] S. K. Sadrnezhaad and E. Keshavarz Alamdari, “Ther- modynamics of Extraction of Zn2+ from Sulfuric Acid
tional Journal of Engineering, Transactions B: Applica- tions, Vol. 17, No. 2, 2004, pp. 191-200.
[9] R. E. Blanco, C. A. Blake Jr., W. Davis Jr. and R. H. Rainey, “Survey of Recent Developments in Solvent Ex- traction with Tri-Butyl-Phosphate,” Oak Ridge National Laboratory (ORNL), 1963.
www.ornl.gov/info/reports/1963/3445605494266.pdf [10] W. Davis Jr., “Thermodynamics of Extraction of Nitric
Acid by Tri-N-Butyl Phosphate—Hydrocarbon Diluent Solutions I. Distribution Studies with Tbp in Amsco 125-82 at Intermediate and Low Acidities,” Oak Ridge National Laboratory (ORNL), 1961.
www.ornl.gov/info/reports/1963/3445605700033.pdf [11] X. Liu, D. Fang, J. Li, J. Yang and S. Zang, “Thermody-
namics of Solvent Extraction of Thallium(I),” Journal of Phase Equilibria and Diffusion, Section I: Basic and Ap- plied Research, Vol. 26, 2005, pp. 342-346.
doi:10.1361/154770305X56791
[12] D. R. Gaskell, “Introduction to the Thermodynamics of Materials,” 5th Edition, Taylor & Francis Publisher, New York, 2008.
[13] D. V. Ragon, “Thermodynamics of Materials,” John Wi- ley & Sons Inc., New York, 1995.
[14] R. T. Dehoff, “Thermodynamics in Materials Science,” 2nd Edition, Mc Graw-Hill, New York, 1993.
[15] J. B. Hudson, “Thermodynamics of Materials,” John Wi- ley & Sons Inc., New York, 1996.
[16] F. Daniels, J. W. Williams, P. Bender, R. A. Alberty and C. D. Cornwell, “Experimental Physical Chemistry,” 7th Edition, McGraw Hill, New York, 1970.
[17] G. W. Castellan, “Physical Chemistry,” 3rd Edition, Ad- dison-Wesley, Menlo Park, 2004.