Munich Personal RePEc Archive
Foreign Aid and Aid Policy effectiveness
on Economic Growth of Ghana.
Obu-Cann, Ernest and Fosu, Gabriel Obed and Bondzie,
Eric Amoo
University of Bradford, UK, Kwame Nkrumah University of Science
and Technology, Kumasi, Ghana, Universià Cattolica del sacro
Cuore-Milan
November 2013
1 | Page
FOREIGN AID AND AID POLICY EFFECTIVENESS ON ECONOMIC
GROWTH OF GHANA.
Ernest Obu-Cann, Gabriel Obed Fosu, Eric Amoo Bondzie
ABSTRACT : The concept of foreign aid became a fundamental component of international affairs and an essential instrument to rebuild the world after the World War II. Many developing countries including Ghana depend on it in order to support their budget or finance economic projects and programmes in their countries. The study examines the impact of foreign aid inflow on economic growth for the Ghanaian economy for the period 1975 to 2010 by adopting the Burnside and Dollars model. We indicated that foreign aid has a positive but insignificant effect on economic growth of Ghana. The study concludes by examining and recommending important policy issues that must be given thorough attention in order to achieve significant impact of aid on Ghana’s economic growth.
Keywords- Economic growth, Foreign Aid, Foreign Direct Investment, Human Capital
I.INTRODUCTION
The eradication of abject poverty and reduction of income inequality in the world has been a topical issue for quite some time now. This was evident when leaders all around the world gathered in New York, 2000 to agree on concrete strategies and actions to meet human needs and basic rights. This resulted in the Millennium declaration in 2000. The declaration increased the contribution commitment of development aid donors that was reduced in the early 90s due to financial hardship [1].
Due to the ‘perceived’ role aid plays in achieving the Millennium Development Goal (MDGs) of eradicating extreme poverty by 2015, the impact of aid on economic growth has received great debate among economic researchers. According to OECD (2009), in 2008 alone, the total net bilateral official development assistance (ODA) Development Assistant Committee (DAC) donated to Africa was estimated at US$26billion in real terms. Again, it is perceived that Africa, has received by far the largest proportion of foreign aid in the world (estimated at about 600 billion dollars) on a per capita basis and yet it is still classified as the poorest continent in the world [2].
2 | Page
In 1983, Ghana began it economic and Structural Adjustment Programme (SAP), there was a sharp rise in the aid inflow from developed countries and donor agencies to support the programme. It is estimated that Ghana’s net aid as a ratio of gross national income of 13% far exceeded the 4% average for the sub- Sahara region [4]. Therefore, development aid is becoming a dictator of pace in Ghana’s economic growth and development, since a change in the inflow to Ghana could have a significant impact on its growth. Regardless of the countries good economic policies, it lacks cohesion with the policy conditionalities outlined by donor to fully achieve it intended purpose. This has therefore raised the question as to whether, aid inflows to Ghana is a blessing or a curse in disguise. This study therefore intends to establish whether there is relationship between aid inflows and growth.
II.METHODOLOGY
This study employs the Burnside and Dollar [5] regression model, which is given as: Y=βo+β1(A/GDP) + β2(A/GDP)2+ β3P+ β4(A/GDP*P)+ β5X+U This can be simplified as:
g=bo+b1a+ b2a2+ b3p+ b4ap+ b5x+u ... (1)
where g (Y) is real per capita GDP growth, a= (A/GDP) is aid as a share of GDP, p=(P) is the policy index, ap=(A/GDP*P) is the interaction between foreign aid as a share of GDP and policy index, x=(X) is the other determining factors of economic growth which were considered for this study. These factors are stock of capital human (h), stock of physical capital (k) and foreign direct investment (FDI). The error term is represented as u=(U). The policy index is exogenously determined and it is given as the weighted average of budget surplus (as a proxy for fiscal policy), inflation (as a proxy for monetary policy) and import and export as a share of GDP (as a proxy for index of trade).
A policy variable is constructed by using these three macroeconomic policy variables: budget surpluses relative to GDP as a measure of government fiscal policy (B) by Levine and Renelt [6], a measure of trade openness (TO) by Sachs and Warner [7] and inflation (N) as a measure of government monetary policy. Thus policy variable is exogenously determined in equation (1). To first model the policy index; budget surplus, trade openness and inflation is regress on growth using OLS method to examine their impact on growth as shown in (2).
z=zo+z1B+ z2TA+ z3N+u...(2)
The impact of the independent variables on growth are measured by z1, z2 and z3. These indexes are used to construct the policy index using the following expression:
3 | Page
III.
ANALYSIS AND DISCUSSION [image:4.595.75.524.320.463.2]Secondary data source was used for this research. The annual data was for the period of 1980 to 2010. These data were sourced from the World Development Indicators (WDI) and International Monetary Fund (IMF) statistics. The study uses Excel and Microfit (5.0 version), computer packages for the data analysis.
Table 1 shows the correlation matrix of all the variables used in the study with much emphasis on the independent variables. It is evident that growth has a positive relationship with all the variables. However, there seems to be a more positive correlation (0.88416) between growth and human capital for the case of Ghana. Similarly, growth is modestly positively correlated (0.80368) with FDI. There is however interaction among some of the independent variables. For instance, aid and physical capital stock are highly correlated. This may be as a result of the component of aid in sub-Sahara countries particularly Ghana.
Table 1
Correlation Matrix of all the variables
Variable g a p FDI h k g a p FDI h k 1.0000 0.66529 0.56957 0.80368 0.88416 0.59748 0.66529 1.0000 0.68017 0.61094 0.65353 0.71645 0.56957 0.68017 1.0000 0.47227 0.34173 0.93719 0.80368 0.61094 0.47227 1.0000 0.77840 0.58076 0.88416 0.65353 0.34173 0.77840 1.0000 0.41589 0.59748 0.71645 0.93719 0.58076 0.41589 1.0000
Also, economic policy is highly correlated with physical capital stock which may also occur as a result of the proxies of policy index. There is an interaction between government expenditure and physical stock of capital. FDI and human capital are also highly correlated (0.77840). We therefore conduct a regression test to either confirm the multicollinearity problem suggested by the pair-wise correlation or otherwise. A policy model is used to find evidence to support Burnside and Dollars [5] assertion that, aid works better in countries with good economic policies using the policy index and other factors that affect growth.
Table 2
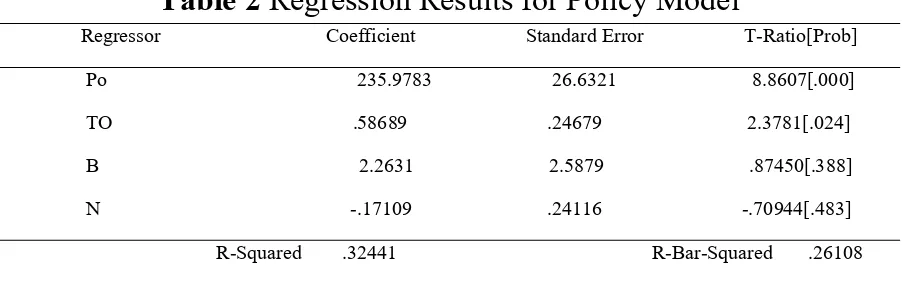
Regression Results for Policy Model
Regressor Coefficient Standard Error T-Ratio[Prob]
Po 235.9783 26.6321 8.8607[.000] TO .58689 .24679 2.3781[.024] B 2.2631 2.5879 .87450[.388] N -.17109 .24116 -.70944[.483]
[image:4.595.73.524.608.758.2]4 | Page
The dependent variable is Po. Trade openness and budget surplus/deficit have a positive relationship on economic growth while inflation suggest otherwise. This is illustrated in Table 2 Thus, a percentage change in trade openness for instance increases Ghana’s growth by 0.58689 percent. Also, growth increases by 2.2631 percent as budget surplus/deficit increases by one (1) percent. However, an increase in inflation decreases growth by 0.17109 percent. The policy index for Ghana is therefore modelled as follows:
Po=2.2631B – 0.17109N + 0.58689TO
However, with the exception of trade openness, all the t-ratios of the independent variables are insignificant at 5% level of significance. Thus, the p-values of budget surplus/deficit and inflation (0.388 and 0.483) are less than the α-value of 0.050. In terms of the R2, the independent variables (trade openness, budget surplus/deficit and inflation) are able
[image:5.595.69.527.343.534.2]to explain only about 32% of the explanation in the dependent variable (economic growth). This means that, growth is influenced by other factors which are not explained by the regression result in Table 2.
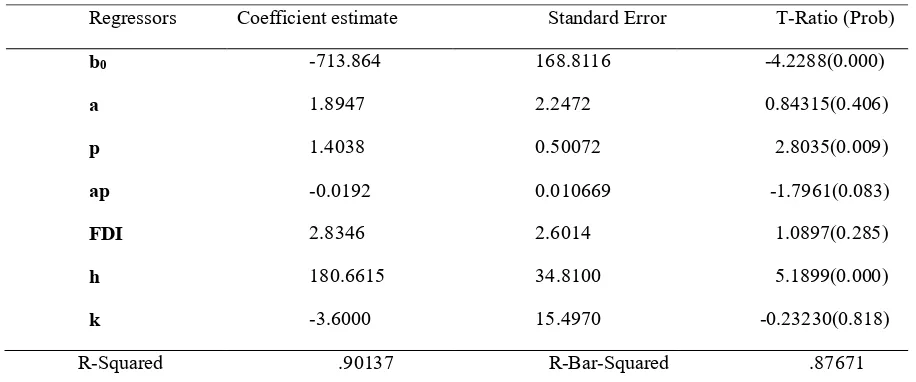
Table 3
Main Regression Result
Regressors Coefficient estimate Standard Error T-Ratio (Prob)
b0 a p ap FDI h k -713.864 1.8947 1.4038 -0.0192 2.8346 180.6615 -3.6000 168.8116 2.2472 0.50072 0.010669 2.6014 34.8100 15.4970 -4.2288(0.000) 0.84315(0.406) 2.8035(0.009) -1.7961(0.083) 1.0897(0.285) 5.1899(0.000) -0.23230(0.818)
R-Squared .90137 R-Bar-Squared .87671
In Table 3, the regression result shows that Ghana’s economic growth would attain negative level of growth without the presence of the independent variable. It is also evident that, a percentage increase in aid assistance, good economic policy and other factors like FDI and human capital increase GDP growth by 1.8947%, 1.01038%, 2.8346% and 180.6615% respectively in Ghana. Contrary to Burnside and Dollars (2000) suggestion that aid work effectively in countries with good economic policies, an increase in aid-policy in the regression however decreases economic growth by 0.0192% even though the parameter estimate is statistically highly insignificant. The R2 value of 0.91077 in Table 3 means that, about 91% of
the variations in economic growth of Ghana are explained by the independent variables. Given the high R2, magnitude of some of the parameter estimates particularly human capital (about
180.7%) and highly insignificant coefficients.
5 | Page
(Dickey-Fuller and Augmented Dickey fuller) test to investigate whether the time series data are stationary or not, the results are shown in Table 4. Table 5 also shows the results after first differencing. The results after first differencing showed aid does not have any positive impact on the economic growth of Ghana.
V.
CONCLUSION
In this study we analyzed the impact of foreign aid and good economic policies on economic growth, within the time period of 1975 to 2010. To better understand the aid-policy nexus, a separate model for policy was estimated as propounded by Burnside and Dollar, 2000. The policy model estimated was therefore incorporated into the main growth models to assess their respective impact on Ghana’s economic growth. We realized that human capital (which is measured as secondary school enrollment as a percentage of the gross) has a greater impact on Ghana’s economic growth and development in general. It was evident that aid in itself had an insignificant impact on growth but the policy coefficient was statistically significant. The empirical result from this study however suggests an insignificant impact of physical capital on economic growth. Thus, even though the country is investing, the investment is not yielding much positive impact on economic growth. The ADF test suggested the presence of unit root (non-stationary). The variables were therefore transformed from their original to the first difference form. However, the problem was not resolved.
IV.P
OLICYI
MPLICATIONGhana as a country is investing; the investment is not yielding much positive impact on economic growth. This result might occur for the following reasons.
Successive governments divert resources from potentially productive sectors of the economy to unproductive sectors and hence decreasing the overall output-generating capacity of the investment in order to score political point. As a result this investment does not add to the overall output of the economy [8]. Bribery and corruption as Rose-Ackerman [9] indicated has characterized many developing economies thereby leading to inefficient returns on investment in the economy. This increases the cost of the project which is transferred to the price of the project’s output thereby reducing the demand for the product or project. As the demand for the product or the project decreases, the incremental output-capital ratio for the activity eventually reduces.
6 | Page
R
EFERENCES[1] United Nations (2010). The Millennium Development Goals Report 2010. New York: Oxford Press.
[2] William Easterly, (2007). Are aid agencies improving?, Economic Policy, CEPR & CES & MSH, vol. 22, pp 633-678.
[3] Ayodele, T., Franklin, C., Nolutshungu, T.A., and Sunwabe, C.K. (2005). African perspectives on Aid: Foreign Assistance will not pull Africa out of Poverty. Economic Development Bulletin. September. pp 1-4
[4] Amoako-Tuffour, J. (2005). Multi-Donor Direct Budget Support in Ghana: the
implications for aid delivery and aid effectiveness. Centre for Policy Analysis, No. 11, pp.1-22.
[5] Burnside, C., and Dollar, D. (2000).. Aid, Policies, and Growth. American Economic Review, Vol.90, no.4, September. pp. 847-868.
[6] Levine, Ross & Renelt, David, (1992). A Sensitivity Analysis of Cross-Country Growth Regressions, American Economic Review, American Economic Association, vol. 82(4), pp 942-63.
[7] Sachs, J.D. and A.M. Warner.(1995). Economic Reform and the Process of Global Integration, Brookings, Papers on Economic Activity, vol. 1, pp. 1-118.
[8] Robert Osei, (2003). IMF and World Bank Sponsored Structural Adjustment Programs in Africa: Ghana's Experience. Journal of International Development, John Wiley & Sons, Ltd., vol. 15(2), pages 261-262.
[9] Rose-Ackerman, Susan, and Andrew Stone. (1996). The Costs of Corruption for Private Business: Evidence from World Bank Surveys. Manuscript (May).
Appendix
Table 4 ADF tests for variable G
The Dickey-Fuller regressions include no intercept and no trend Test statistic LL AIC SBC HQC df 2.7180 -120.9010 -121.9010 -122.6642 -122.1613 adf(1) 1.7689 -116.4557 -118.4557 -119.9821 -118.9762 LL = Maximized log-likelihood AIC = Akaike Information Criterion
7 | Page
ADF tests for variable G
The Dickey-Fuller regressions include an intercept but not a trend Test Statistic LL AIC SBC HQC DF 2.6317 -118.4573 -120.4573 -121.9837 -120.9778 ADF(1) 1.2412 -115.9086 -118.9086 -121.1982 -119.6894
ADF tests for variable G
[image:8.595.71.524.270.431.2]The Dickey-Fuller regressions include an intercept and a linear trend Test Statistic LL AIC SBC HQC DF -.25236 -114.4815 -117.4815 -119.7711 -118.2623 ADF(1) -.42956 -113.3945 -117.3945 -120.4473 -118.4356
Table 5 Regression Results After First Differencing
Regressor Coefficient Standard Error T-Ratio[Prob]
b0 -1.4980 1.5880 .94334[.353]
DA -.12837 0.18047 -.71127[.483] DP -.25471 0.18076 -1.4091[.169] DFDI -2.6302 1.3530 -1.9440[.062] DLH -59.0241 36.4866 -1.6177[.117]
DLK 3.6419 7.5787 .48054[.634]
![Table 5 Regression Results After First Differencing Regressor Coefficient Standard Error T-Ratio[Prob]](https://thumb-us.123doks.com/thumbv2/123dok_us/7771557.717427/8.595.71.524.270.431/table-regression-results-differencing-regressor-coefficient-standard-error.webp)
