/
Factor Analysis and Cluster Analysis: Their Value
and Stability in Social Survey Research
JOHN RAVEN JANE RITCHIE DOREEN BAXTER
METHODOLOGICAL work carried out by the British Government Social Survey Department in the course of a number of surveys into educational matters revealed that:
1. Varimax factor analysis and various types of cluster analysis gave substantially
the same results, although cluster analyses tended to break up the larger factors.
2. Substantial improvements could be made to both Varimax and Cluster
analytic solutions by inspecting the correlation matrices arranged as indicated by these techniques.
3. The abstract debate about whether to rotate or not should cease: both
rotated and unrotated solutions had their uses. However, the interpretation of the results was quite different in the two cases. Although the techniques have similar mathematical origins, they were not, in practice, simply different forms of the same technique. The model of the data field that was appropriate when one tech nique was most useful was quite different from the model that was appropriate when the other technique was the most useful. This is important because many investigators seem to adopt one technique rather than another because of the selective availability of computer programmes rather than because of an explicit model of the data field in which they are working.
4. The Varimax, but not the Principal Component, solution was stable from
one main survey to another and from pilot to main surveys.
5. Rotation of fewer factors lead to items being assigned to larger factors in
such a way as to obscure the factor patterns, particularly when the correlation matrices were not examined.
6. Addition of extra variables similarly served to obscure the factor pattern i f the number of factors extracted was not simultaneously increased.
7. Removal of a biased sample of individuals did not materially alter a Varimax
\
Nothing that is said will be new to investigators with wide experience in this field; on the other hand it is hoped that subsequent discussion will enable investi gators to pool experience, and thus arrive at the beginnings of a formal under standing of the parameters which determine what the various techniques do with different types of data.. ' • t' '" ' '
Aims • • • • • • ••• ;
The object of this paper is to present the results of some methodological work carried out in the Government Social Survey Department in the course of a number of surveys connected with education. Most of the work was undertaken in connection with an enquiry into sixth form education, but other data were collected in enquiries into undergraduates' attitudes towards school teaching as a career, a study of adults' and adolescents' attitudes toward smoking, and a follow-up study of the survey done for the Plowden committee on primary education. While much that is said in this paper is well known to people with wide experience in this field it is not available in a formalised fashion to people embarking on research in which these techniques will be used. It is hoped that the paper will stimulate further formal discussion of what these techniques do with different types of data under different conditions. The paper should therefore be viewed as a report on what happens under a limited number of conditions and not as an authoritative statement of what will happen under all conditions with all types of data. Nevertheless the data reported here are drawn from a larger pool of data collected together in Government Social Survey paper M i 34 and in a forthcoming ESRI memorandum. > j ... * " *
Sample size and method of collecting data . J
The data to be reported were, unless specifically stated, collected in main surveys consisting of 3,000 to 4,600 informants, or in pilot; surveys of approximately
100 informants. . •" j • •
Similarly most of the data to be reported were collected from informants, ratings on five- or seven-point scales such as those given on facing page. A similar format was used for collecting the information on desired job characteris tics. While this information was obtained through written ratings by the inform ant, rather than by an oral interview, the questionnaires were either administered individually or given to small groups of seven or eight pupils at a time: they were not mass testing sessions. j ,.
Most of the analyses ^hat will be reported were based on Pearson prdduct moment correlations between untransformed raw ratings. In the case of school r
type, however, the ratings of all pupils within a school were averaged before the intercorrelations between the variables describing the schools were calculated. .
A word is perhaps in order concerning, the origin of the items. All were generated from extensive programmes of exploratory work and a literature review. Furthermore, a decision was taken not to follow j the common practice of inserting into the questionnaires a set of items to accurately measure each of a
. r. .
• t
Sample Items
Extremely Important that important that I do not mind the school the school whether the should NOT should do this school does do this in in Vlth form this or not Vlthform
Encourage you to be independent
Make sure you do as well as possible in 'A' level G.C.E. and other examinations
Help you to develop your personality and
character 1 2 3.
small number of theoretically derived "dimensions" of job aspirations, desired course type, or school type. Instead a large number of conceptually separable dimensions (40 or so in each case) were represented in the questionnaires by only one or two items each. In other words the exploratory and pilot work concentrated on reducing the number of items to the minimum number required to cover the field of enquiry adequately, rather than on developing instruments designed to measure accurately each of the large number of conceptually separable areas. Although the work reported in this paper is concerned with seeking higher order generality within this data, it is, because of the way the data were generated, therefore not surprising that many of the inter-relationships with which we shall be dealing are not very substantial. This is an important point to bear in mind when considering how far the methodological findings can be generalised.
Purpose of Correlational Analysis
Since the objective of this paper is to compare, empirically, what different forms of data analysis do with the same set of data, and then to go on to see what happens with different sets of data, it is necessary first to be clear about what we are trying to do when we analyse data of this sort in this way.
The objectives of analyses of this sort are:
(1) To show that the individual items have some meaning—if an item does
(2) (a) To sort out the different attitude dimensions, that are represented in any batch of attitude items. By this is meant that we wish to sort out groups of items which are in some sense measuring one attitude and ' ' . distinguish them from groups of items which are measuring some
other attitude. ! (b) In some sense to explain why items correlate with other items as they
do—for example because they are tapping more than one attitude dimension at the same, time. I
-I
(3) To develop attitude scales with which to assess the consistency.strength,
all-pervasiveness, or what have you, of an individual's attitudes. The theory here is that i f an underlying attitude is strong it will dominate a person's responses to a series of items which, in addition to tapping one common dimension; also tap a series of other dimension's. The theory assumes that all the items raise issues which are complex and that we should respond to all of them by saying "In some ways yes, in other ways no." However if we feel strongly about something we will allow those considerations to overrule! all other considerations. It is assumed that the more often we allow one set of considerations to overrule all sorts of alternative considerations the more strongly we feel about the basic issue and the more firmly it is anchored in our mental make-up. j
Thus, if we respond consistently to a series'of items which have one attitudinal dimension in common but which also tap a series of other attitude dimensions then we must have a stronger, more all-pervasive, more organised, or more resistant to change) attitude on the common
dimension. | It is important to notice that for the logic to be sound the items must
not overlap completely in content: they must tap a wide range of diverse attitudes as well as the one in which jwe are interested.
From this it follows that the requirements of an attitude scale are:
(a) Moderately correlated items: If the items are too highly correlated they
will tap only one dimension and our inference that an individual who endorses all of them must have a stronger attitude because more divergent pulls were overcome will be erroneous.
(b) A range of marginals to add weight to our belief that a person who
endorses more items also endorses the more extreme items that fewer people endorse. ' .' j .
(c) Items which tap a wide range of dimensions as well as the one in which
* we are interested and cover a wide range of manifest content. , . . i . . ., Does Factor Analysis Sort Out Such Batches of Items' <:{••••
somewhat differently. For example they think that all forms,of factor analysis group together highly correlated items.
However Table i lists the items making up the first two principal components
T A B L E 1: F I R S T T W O P R I N C I P A L C O M P O N E N T S (loadings of less t h a n .30 o m i t t e d ; d e c i m a l points omitted).
C o m p o n e n t I
I t e m L o a d i n g
N o . ( X l O O ) .
2 9 . Y o u would be doing w o r k w h i c h would have some standing i n a c a d e m i c c i r c l e s . 51
3 4 . T h e w o r k would be intellectually developing a n d stimulating. 51
2 5 . Y o u w o u l d be able to r i s e to a position of responsibility i n a short time. " 51
3 7 . T h e s t a r t i n g s a l a r y w o u l d be good. 50
1 8 . T h e r e would be good opportunities for promotion throughout y o u r c a r e e r . 4 9
3 0 . T h e r e would be a congenial atmosphere in w h i c h to w o r k . 4 9
2 3 . T h e ultimate s a l a r y prospects in the c a r e e r would be good. 4 9
2 1 . Y o u r w o r k would have some s o c i a l prestige attached to it. 4 7
3 6 . T h e r e w o u l d be plenty of opportunity to develop outside interests. 46
14. Y o u r colleagues would be interesting a n d stimulating. 4 5
2 0 . Y o u would be able to increase the specialist knowledge gained i n y o u r degree. 4 4
19. T h e r e would be good r e l a t i o n s between a l l levels of staff. 4 4
3 8 . T h e w o r k would m a k e full use of y o u r capabilities. 4 3
2 8 . I t would be up to y o u to develop y o u r w o r k a s y o u chose. 4 3
2 6 . Y o u ' w o u l d have the opportunity of continuing with y o u r studies a s p a r t of your w o r k . 41
3 5 . T h e r e w o u l d be security of employment. 3 9
2 7 . Y o u would be able to use the knowledge gained i n y o u r degree. 3 9
2 2 . P r o m o t i o n would depend o n m e r i t a n d not on the c l a s s or type of y o u r degree. 38
4 1 . A job with long h o l i d a y s . 3 7
12. P r o m o t i o n w o u l d depend o n the quality of your w o r k a n d not on seniority. 3 7
16. T h e r e w o u l d be opportunities for travel on the job. 3 5
13. W o r k w h i c h w o u l d d e m a n d considerable initiative. 3 5
17. Y o u would be v e r y m u c h your own boss. 3 4
4 0 . Y o u would.be meeting a variety of different types of people. 3 3
3 2 . I t w o u l d be e a s y to get a job overseas i n this field of w o r k . 31
2 4 . Y o u r s a l a r y ' w o u l d depend o n the amount of w o r k y o u put into the job a n d not o n fixed a m o u n t s . % of v a r i a n c e accounted for = 2 3 %
3 0
C o m p o n e n t I I
5 . S o c i a l S e r v i c e — i n c l u d e s hospital s e r v i c e e t c . — N o t school t e a c h i n g . — 6 5 1. I n d u s t r y — i n c l u d e s m a n u f a c t u r i n g , processing, public utilities. 6 2
1 5 . Y o u would be doing a s o c i a l l y useful j o b . — 6 0
8. W o r k i n w h i c h most of y o u r time would be spent w i t h c h i l d r e n o r young people. — 5 9
2 3 . T h e u l t i m a t e s a l a r y prospects i n the c a r e e r would be good. 55
18. T h e r e would be good opportunities for promotion throughout y o u r c a r e e r . 5 5
3 9 . Y o u r w o r k would be of immediate benefit to others. — 5 3
2 . B u s i n e s s , C o m m e r c e , i n s u r a n c e , finance, r e t a i l . 52
9 . W o r k i n w h i c h y o u would spend m u c h of y o u r time dealing with figures. 4 4 1 0 . G e n e r a l a d m i n i s t r a t i v e , organising, m a n a g e r i a l w o r k . 4 0
4 0 . Y o u w o u l d be meeting a v a r i e t y of different t y p e s of people. — 3 7
3 7 . T h e s t a r t i n g s a l a r y would be good. 3 3
2 5 . Y o u . w o u l d be able to r i s e to a position of responsibility i n a short time. % of v a r i a n c e accounted for = 1 8 %
3 2 Y o u . w o u l d be able to r i s e to a position of responsibility i n a short time.
% of v a r i a n c e accounted for = 1 8 %
from one study, together with their loadings. The first component accounts for
23 per cent of the total variance of the 34 items involved, and, as can be seen,
many of the loadings are quite substantial.
From what we have said we would expect the items with high loadings to be highly correlated with each other.
However, as Table 2 shows, this is not the case. In other words, scoring people on the 1st principal component in this case is not justified because the component is defective in a basic rule of attitude measurement, namely that items purporting to measure the same thing should be moderately correlated with each other.
However, let us leave Table 2 for a moment and come back to it later, because principal components analysis, even in these circumstances, does have its uses.
TABLE 2: MATRIX OF INTERCORRELATIONS ARRANGED AS INDICATED BY THE PRINCIPAL ANALYSIS. CORRELATIONS OF -2 AND OVER ONLY. TO NEAREST DECIMAL PLACE. DECIMAL POINT OMITTED. WITHIN FACTORS (SEPARATED BY HORIZONTAL AND VERTICAL LINES) THE ITEMS ARE ARRANGED IN ORDER OF THEIR FACTOR LOADINGS. ITEMS HAVE BEEN ASSIGNED TO THE COMPONENT ON WHICH THEY HAVE THEIR HIGHEST LOADING.
Factor
Mot Variable No: Factor No: 1 Variable
No: 29 34 25 37 30 21 36 14 19 38 28 22
2
5 1 15 8 23 18 39 2 » 10
3
11 20 26 40 6 27 7 31 4
35 13 17
5
32 16 41 33 6 4 7 24 8 3 12
1 29 34 25 37 30 21 36 14 19 38 28 22 10 10 10 3 10 3 2 10 3 3 3 10
2 3 10 3 5 2 10
5 3 3 10
3 2 10 4 3 2 10
3 10 2 5
1 IS 8 23 18 39 2 9 10 2
2 2 3
4 6 4 2 4 4 3 3
2 2 2 2 2
3
10 -3 10
5 -2 10 5 - 3 10 -3 3 10 -3 3 10
4 -2 6 3 10 4 3 . 3 10 -3 4 2 10
3 2 3 5 10
-3 11 20 26 40 6 27 7 31
4 3 2 5 3 3 5 4 4
3 3 3 3
4 3 3
4 3 , . 2
2
-2
3 3 3 5 -2
2 2 -2 2 10
5 10 5 7 10
3 10 5 4 4 10 3 6 5 3 10
4 10 3 10 4 35
13 17...
4 2 2 3 3
2 3 3 3 3 4 3 2 10 10
3-10 5 32
16 41 33
2 4 2 2 3
3 3 2
2
2 10 6 10 10
10
e 4 10
7 24 3 3 3 2 10
S 3
F A C T O R A N A L Y S I S A N D C L U S T E R A N A L Y S I S
T A B L E 3 : F I R S T T H R E E R O T A T E D ( V A R I M A X ) F A C T O R S . F a c t o r L o a d i n g s
F a c t o r 1 4 0 . Y o o would be meeting a v a r i e t y o l different types of people. 3 3 . T h e w o r k w o u l d m a k e full use of y o u r c a p a b i l i t i e s . 3 4 . T h e w o r k w o u l d be intellectually developing a n d s t i m u l a t i n g . 3 6 . T h e r e w o u l d be plenty of opportunity to develop outside interests. 1 9 . T h e r e w o u l d be good relations between a l l levels of staff. 14. Y o u r colleagues w o u l d be interesting a n d s t i m u l a t i n g . 3 0 . T h e r e w o u l d be a congenial atmosphere i n w h i c h to w o r k .
% o f v a r i a n c e accounted for — 5 %
— 3 2 — 3 3 — 3 8 — 4 7 — 6 1 — 6 9 — 7 6
F a c t o r 2 3 7 . T h e s t a r r i n g s a l a r y w o u l d be good.
2 3 . T h e u l t i m a t e s a l a r y prospects i n the c a r e e r would b e good. 4 1 . A job w i t h long h o l i d a y s .
3 5 . T h e r e would be s e c u r i t y of e m p l o y m e n t .
2 1 . Y o u r w o r k w o u l d have s o m e s o c i a l prestige a t t a c h e d to i t .
1 8 . T h e r e would be good opportunities for p r o m o t i o n throughout y o u r c a r e e r . 3 3 . F u r t h e r full-time t r a i n i n g w o u l d not be needed before s t a r t i n g this w o r k . 2 5 . Y o u w o u l d be a b l e to r i s e to a position of responsibility i n a s h o r t t i m e . 3 6 . T h e r e w o u l d be plenty of opportunity to develop outside interests.
% of v a r i a n c e accounted for — 7 %
7 6 7 0 6 3 56 51 4 8 4 2 3 8 3 5
F a c t o r 3
2 8 . I t w o u l d be up to y o u to develop y o u r w o r k a s y o u c h o s e . — 3 8 3 4 . T h e w o r k w o u l d be intellectually developing a n d s t i m u l a t i n g . — 4 6 2 7 . Y o u w o u l d be able to use the knowledge gained i n y o u r degree. — 6 7
6. U n i v e r s i t y . — 6 8 2 9 . Y o u would be doing w o r k w h i c h w o u l d have s o m e standing i n a c a d e m i c c i r c l e s . — 7 0
1 1 . T h e o r e t i c a l w o r k a i m e d a t i n c r e a s i n g fundamental knowledge r a t h e r than at immediate p r a c t i c a l application. — 7 1
2 0 . Y o u w o u l d be able to i n c r e a s e the specialist knowledge gained i n y o u r degree. — 7 8 2 6 . Y o u w o u l d have the opportunity of continuing with y o u r studies a s p a r t of y o u r w o r k . — 7 8
% of v a r i a n c e accounted for = 9 %
the same analysis. It is clear that they look very similar to the Principal Components. However, when we look at the Correlation Matrix, presented in Table 4 we see that we have:
(a) Some clear clusters of moderately correlated items.
(b) Some items which don't correlate with anything: they must be ambiguous, unique in content, or have poor distributions of answers (thus rendering them unsuitable for measuring any tiling).
(c) Some items that the computer seems to have misassigned.
At this point let's go back to the principal components presented in Table 2.
com-TABLE 4:.THE CORRELATION MATRIX ARRANGED ACCORDING TO THE RESULTS OF THE VARIMAX ANALYSIS.
Factor
Nos Variable No: FactorNo: ; ' 3 ..VariaM* . ,
-No: 6 11 20 26 27 29 34 6
5 8 15 .39 18
2 .
21 23 25 33 35 37 41 1
-14 19 30 36 7
1 2 9 - 10 40
• » :
12 13 12 24 38 5
16 31 32 . 4
4 17 28 8
.3, 7
3 6 11 20 26 27 29 .34 10 • . 5 10
4 - • 5 10 • " 4 ' 5 7 10 . • 3 3 6 5 10
-4 -4 5 5 -4 • 10 ' 3 3 3 4 „3 4 10
•
6 5 8 IS 39
10 5 10 5 5 10 4 5 6 10 2 18
-21 23 ; • 25
33 35 : 37 "
41
• - ' * 3"
-3 10 3
-3 6 . 4 ' • ' ' * ' .3
4 10-4 10 3 4. 10
2 10. 2 4 - . 1 0 3 - 6 3 3 4 10 2 3 2 2 4 10 1 14
1». 30 36 •
• 2 • • . 3 2
2 . 2 2
"' • • ' 3 2 2 2 3 2 3
10 3 10 5 5 10 2 3 3 10 «
7 1 2 9 10 40
-2 -3 -3 -2 -2 3 „' 3 -3 - .
3 3 3 3 5
2 . 3 2
2 3 3 3 3 3 10
* 10 4 2 10 3. 5 10
-2 10
: - ' ".
9 12 . 11
22-24 — 38—
' ' V . 4 3
- i ~ •
- - 2 3 • 3 .. . 2' 3
3 - 3 " " — ~ "
10 3 10 4~" 3 10 -2 3 10
3 10 9 12
. 11 22-24 — 38—
' ' V . 4 3
- i ~ •
- - 2 3 • 3 .. . 2' 3
3 - 3 " " — ~ "
10 3 10 4~" 3 10 -2 3 10
3 10 9 12
. 11 22-24 — 38—
' ' V . 4 3
- i ~ •
- - 2 3 • 3 .. . 2' 3
3 - 3 " " — ~ "
2
10 3 10 4~" 3 10 -2 3 10
3 10 5 16
31 32 2 . 2 2 3 2 10 3 10 6 3 10 4 4
17
28 3 2 3 4 2 4 3 • " - • ' •- 3 . - , " . . . _ "~ '-" 3 y
10 10 . : 3 10 8 ,-3-r
-•1 -.
- ' ?" ~ •-- % <: ... 'i 1 2 -~- 1 -~- '
-2' 2 2 .• -2 2 '
ponents are independent—the components are, in fact, logically absolutely dependent on what variance has been taken out of the matrix by what has gone before. They make no sense in isolation. They are not conceptually independent. Furthermore they assume that the data one is analysing are best fitted by a model which prer supposes a general factor plus a series of subsequent correctives—as may be the case, for example, in intelligence testing where one may wish to build a model which says "first assess an individual's general level of intelligence, then assess whether his level of verbal ability is higher or lower than would be expected from his level of general intelligence, then assess whether his numerical ability is higher or lowerthan you would expect from these two combined, etc". The reader will no doubt find that such a theory jars with what he has previously believed to be the psychological model of the dimensions of the intellect—a jarring which should serve to illustrate the need to examine the psychological models which are associated with the use of various techniques of data analysis very carefully. It is hoped, too, that the reader is also feeling uncomfortable about the way in which we have applied a model, which was designed to tell us something about items, to an attempt to say something useful about people.
Returning to the Varimax analysis presented in Table 4 it is clear that the psychological model is quite different: here'we do have conceptually.distinct attitude areas. Furthermore, insofar as we do have some correlation outside our clusters it should be emphasised that this is also in line with the theory of attitude measurement which was outlined above. ' ; " •
To summarise this discussion: It should now be clear that both principal com ponents solutions and Varimax solutions have their uses: the old debate about whether to rotate or not should die. Fot all sets of data both an unrotated and a rotated solution can be useful: one or the other is simply more'appropriate to the data field and more relevant to the purposes for which we want to use it. In the case we have been discussing one could use the principal components model as an explanatory framework, although the measures of the factors would be weak. The explanation would run something like: I f we wish to predict the inter-correlation between any two items from one underlying variable (a rather stupid thing to do, given the obtained matrix) the first thing to take'into account is the extent to which the socially desirable response is clear on both items: i f it is clear the items will tend to, correlate. If, after that, one wishes to improve on the predictions we have already made, the next thing to take into account is the extent to which it is clear that the item has anything to do with industry. And so on. Note that once one has used 6 components to arrive at a reasonably accurate approximation to the original correlations one might just as well have said ' to which of the 6 clusters does the item belong?" knowing that once one had an answer to that question one could predict that the item would be highly correlated with other items making up the same cluster and uncorrelated with items making up other clusters.
correlate at least -.4 with each other (owing, for example, to them all having a clear social desirability component); but superimposed on this high level of intercorrelation there are distinct clusters of items which are highly correlated with the other items in the same cluster but only moderately correlated-with the
items in other clusters. 1 1
Finally, it should once more be remarked that i f the principal components solution is used then it will not be possible to use an individual's score on the second component in isolation from his score on the first component: it only makes sense in relation to that score. Furthermore, factor scores derived from a components analysis cannot.be obtained by looking only at the most "saturated" items because these items are not very highly intercorrelated, with the result that a basic rule of psychological measurement, namely that all items which measure the same thing should be at least moderately intercorrelated, is broken:
We have now outlined two psychological models of possible data fields which presuppose different types of analysis. Before we move on to compare various techniques of analysis it is worth pausing to look at yet another set of data which is best fitted by yet another model and presupposes yet another form of analysis. The example used here is taken from Rosenberg (1958) and is presented in Table
5. Rosenberg maintains that the items as arranged form a continuous order:
TABLE 5: OCCUPATION AND VALUES (ROSENBERG 1956)
; i
CREATIVE AND ORIGINAL ABILITIES AND , APTITUDES H E L P F U L T O
OTHERS WORK WITH
P E O P L E STATUS AND
PRESTIGE GOOD D E A L
O F MONEY SECURE
FUTURE
Creative Abilities Helpful People Status Money Security
MONEY P E O P L E
STATUS s=s H E L P F U L
•S , 4
-ABILITIES ^ C R E A T I V E - SECURITY
.McQUItTY SOLUTION
nega-tively correlated. Had he analysed his data by a routine Varimax package, without arranging the matrix as shown, he would have obtained three clusters similar to, i f not identical with, the three McQuitty clusters shown in the bottom of the table. If only one underlying variable is involved this would indeed have been an inappropriate model to have fitted to the data.
The importance of looking at the correlation matrix can be stressed further by looking again at the Varimax analysis (Table 4). As mentioned above, the clusters of items produced by the Varimax analysis were much tighter than the clusters produced by the Principal Components Analysis, but they were still not perfect from the point of view of constructing attitude scales.
It appears from inspection that some items should be moved from one cluster to another in order to raise the internal consistency of the cluster, and that other items should be dropped from the analysis. Although this can be done by inspection it is clear that some numerical coefficient would assist the process. For this purpose we have found the coefficient a (McKennell, 1967) to be of considerable value. Generally, removal of misassigned items serves to improve a, and maximisation of a can be used as one of the criteria to be taken into account when re-assigning items.
Comparison of Varimax Analysis with other forms of Cluster Analysis
In the course of the studies we are discussing the results of Varimax analyses were compared with other forms of cluster analysis, namely McQuitty Elementary Linkage Analysis, Holzinger's j8 Coefficient Solution, and Tryon's strip method of Cluster analysis.
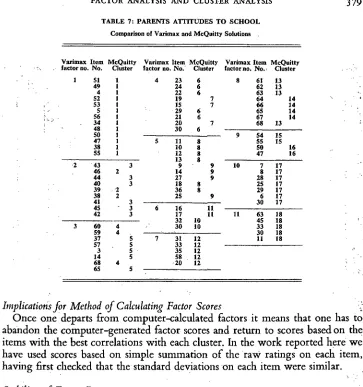
Table 6 compares the Varimax and McQuitty solutions for the undergraduate data. It will be seen that the two solutions are substantially the same, even to the extent of agreeing with moves we made as a result of inspection of the matrix. However the McQuitty analysis does tend to break up the larger clusters. This is a fairly general result also illustrated by Table 7, taken from the Plowden follow-up study.
Table 8 shows that the similarity of the McQuitty solution and the solution which suggests itself from inspection of a correlation matrix ordered as indicated by a Varimax analysis continues even when large general factors seem to be involved.
Table 9 compares the Varimax analysis and the Holzinger j8 coefficient cluster analysis for the undergraduate data: it will be seen that they are again very similar.
Table 10 compares the again very similar Varimax and Tryon strip method solutions.
T A B L E 6 : V A R I M A X A N A L Y S I S C O M P A R E D W I T H M c Q U i T T Y ' S E L E M E N T A R Y L I N K A G E A N A L Y S I S . *
6 11 2 0 2 6 2 7 2 9 3 4 28
6 ^ 1 1
2 6 2 8 - 1 7
27 - 2 0 - 2 9 - 3 4 - 38
S 8 15 3 9 4 0
8
1 5 ^ 3 9 t
4 0 - 7 - 3
18 21 2 3 2 5 3 3 3 5 3 7 41
2 5 - 1 8 3 5
t I 2 3 ^ 3 7 - 41
t t
I I
21 3 3
1 4 X i •
19 X 1 9 ^ 3 0 - 1 4 1
3 0 X t >
3 6 X 3 6 ' i
1 X ' • ' • '
2 X U ± 9 - 4 . 1
9 X
10 X 1 '
4 0 2 ^ 1 0 |
4
1 2 X
1 3 X 1 3 - 1 2 ^ 2 2 - j
2 2 X < i :
2 4 X ' 2 4 ! ' ' " ' '
38
1 • ' • • ! . ) • - . ! . 16 X
31 X 1 6 ^ 3 2 - 3 1 , ' i ' :": "
3 2 X
r
4 7 28
. 1 . •! . , : : •,.
3 X
• | i . . • v ,
7 X
4 0 1 5 ^ 3 9 - 4 0 - 7 - 13 . . . i ;1
3 9 t - •
15
T A B L E 7 : P A R E N T S A T T I T U D E S T O S C H O O L
C o m p a r i s o n of V a r i m a x a n d M c Q u i t t y Solutions
V a r i m a x I t e m M c Q u i t t y V a r i m a x I t e m M c Q u i t t y V a r i m a x I t e m M c Q u i t t y f a c t o r no. N o . C l u s t e r factor no. N o . C l u s t e r factor no. N o . C l u s t e r
1 51 1 4 2 3 6 8 61 13 4 9 1 2 4 6 6 2 1 3 4 1 2 2 6 6 3 13 5 2 1 19 7 6 4 14 5 3 1 15 7 66 14 5 1 2 9 6 6 5 14 56 1 21 6 67 14 3 4 1 2 0 7 68 1 3 48 1 3 0 6
50 1 9 5 4 15 4 7 1 5 11 8 5 5 15 38 1 10 8 50 16 5 5 1 12 8 4 7 16
13 8
2 4 3 3 9 9 10 7 17 4 6 2 14 9 8 17 4 4 3 27 9 28 17 4 0 3 18 8 25 17 3 9 2 3 6 8 2 9 17 38 2 2 5 9 6 17 41 3 3 0 17 4 5 3 6 16 11
4 2 3 17 11 11 6 3 18 3 2 10 4 5 18 3 60 4 3 0 10 3 3 18 5 9 4 : : 3 0 18 3 7 5 7 31 12 11 18 57 5 3 3 1 2
3 5 3 5 12 14 5 58 12 68 4 2 0 12 6 5 5
Implications for Method of Calculating Factor Scores v Once one departs from computer-calculated factors it means that one has to
abandon the computer-generated factor scores and return to scores based on the items with the best correlations with each cluster. In the work reported here we have used scores based on simple summation of the raw ratings on each item, having first checked that the standard deviations on each item were similar.
Stability of Factor Patterns
We have made a number of studies of the stability of the factor patterns with which we are dealing: we have studied their stability from one survey to another, their stability as the number of factors rotated is varied, their stability from pilot to main surveys, and their stability when biased sub-samples of informants are omitted from the analysis.
[image:13.486.51.414.57.444.2]Stability from One Survey tc Another
Table n compares the Varimax factor structures obtained for the career aspiration items that were common to the undergraduate and sixth form studies; it will be seen that in spite of the different populations studied, and, it may be addedr in-, spite of the items here discussed being supplemented by different
X X X XXX X XX X xx x XXXXXXXX X XX X XXXXXXXXXXX X XXXXXXXXX X
J
xxxx x MM «•
\*%*~ js e X X X X ,
I
i
xx x X x X X X
X X
XXXXXX X X X X XX X X X X XXXXXX X X X XXXXXXXX X
x •
• ' X XX X X X xx x XXXXXXXXXXX X XXXXXXX X X xx x X * ! X XX X XX X xx x XXXXXXXXXXX X XXXXXX X X X x ' X X X I x . xx x X X xx x XXXXXXXXXXX X XXXXX X X XX ; X XX X X X xx x XXXXXXXXXXX X xxxx x " * X X X X . X xx x X X XX X XXXXXXXXXXX X xxx x X X X X x ! X xx x X X XX X XXXXXXXXXXX X xx x XX X X
x 1
X xx x XX X xx x XXXXXXXXXXX X X X X X X X X X X X X I xxxx x X X xx x . XXXXXXXXXXX X X , , XX X
i 1
X X x XXX X XX X X X I X X • X X
1 •
T A B L E 9 : T R Y O N ' S M O D I F I C A T I O N O F H O L Z I N G E R & H A R M A N ' S C O E F F I C I E N T ( F r u c h t e r , 1 9 5 4 p l 2 ) ;
F a c t o r a n a l y s i s C l u s t e r a n a l y s i s
r « X
i i X
20 X
26 X
2 7 x
2 9 X
3 4 X
(.28 X
L o o k i n g a t the 21
i n t e r c o r r e l a t i o n m a t r i x 2 these c l e a r l y h a v e little 10
to do w i t h the cluster I 38
N . B . 2 8 belongs here
ri6
S-i 31 [ 3 2
18 21 2 3 2 5 3 3
I 3 5 3 7
L4 1
V a r i m a x A n a l y s i s c o m p a r e d with C l u s t e r A n a l y s i s
F a c t o r a n a l y s i s
X X X 14
X X X X X X X X 3 6
14 19 3 0 3 6
C l u s t e r a n a l y s i s
X X X X X
X X
X X 18 2 3
X X X X X 18 25 2 3 3 7
X X X X
X X 4 0
17 26 28 2 9 3 4
Closer inspection of the items which were assigned to different clusters in the two studies showed that, in most cases, the items could, with almost equal justification, have been assigned to the cluster with which they were most closely
associated in the second study in the first study as well, j
Inspection of Table 12 reveals that in spite of the stability of the Varimax solution in the two studies, the Principal Component solution was quite different in the two studies. One looks in vain for any component in the second study which replicates the principal component in the first study, and so on for the other
components. - 1
Stability from Pilot to Main Studies
T A B L E 1 0 : V A R I M A X A N A L Y S I S C O M P A R E D W I T H T R Y O N ' S S T R I P M E T H O D O F C L U S T E R A N A L Y S I S
6 X
11 X 2 0 X 2 6 X 2 7 X 2 9 X 3 4 X
2 8 X N . B . a s s u g g e s t e d f r o m inspection
5 X 8 X 1 5 X 3 9 X 4 0 X
7
3 N . B . a s suggested f r o m t a b l e o f loadings
1 8 X 2 1 X 2 3 X 2 5 X 3 3 X 3 5 X 3 7 X 4 1 X
1 7 2 4
1 4 X 1 9 X 3 0 X 3 6 X
1 X 2 X 9 X 1 0 X 4 0
1 2 X 1 3 X 2 2 X 2 4 3 8 X
1 6 X 31 X 3 2 X
4 1 7 2 8
3 7
T A B L E 1 1 : V A R I M A X S T R U C T U R E O F C A R E E R A S P I R A T I O N I T E M S I N T H E S U R V E Y S O F U N D E R G R A D U A T E ' S A T T I T U D E S A N D S I X T H F O R M P U P I L S
F a c t o r i n F a c t o r i n U n d e r g r a d u a t e S i x t h F o r m I t e m D e s c r i p t i o n S t u d y S t u d y
1. T h e o r e t i c a l W o r k a i m e d a t i n c r e a s i n g fundamental knowledge A A 2. Y o u would have opportunities of continuing y o u r studies a s p a r t of
y o u r w o r k A A 3 . T h e w o r k would be intellectually developing a n d s t i m u l a t i n g A A
4 . S o c i a l S e r v i c e B B 5 . W o r k w h i c h y o u w o u l d spend m u c h of y o u r t i m e dealing w i t h c h i l d r e n
o r young people B B 6. Y o u w o u l d be doing a s o c i a l l y useful job B B 7. Y o u r w o r k w o u l d be of immediate benefit to others B B 8. Y o u would be meeting a v a r i e t y of different types of people B D
9 . T h e r e would be good opportunities for promotion throughout y o u r
c a r e e r _ C C 1 0 . T h e u l t i m a t e s a l a r y prospects i n y o u r c a r e e r w o u l d be good C C 1 1 . T h e r e would be s e c u r i t y of e m p l o y m e n t C C 12. A job w i t h long h o l i d a y s C J
.13. Y o u r colleagues w o u l d be interesting a n d stimulating D D 14. T h e r e w o u l d be good relations between a l l levels of staff D D 1 5 . T h e r e would be a congenial atmosphere i n w h i c h to w o r k D D 1 6 . T h e r e would be plenty of opportunities to develop outside interests D D
1 7 . I n d u s t r y , m a n u f a c t u r i n g , p r o c e s s i n g , p u b l i c utilities E E 1 8 . B u s i n e s s — c o m m e r c e , i n s u r a n c e , finance, r e t a i l E I 1 9 . W o r k i n w h i c h y o u w o u l d spend m u c h of y o u r t i m e d e a l i n g with figures E E 2 0 . G e n e r a l a d m i n i s t r a t i v e , o r g a n i s i n g , m a n a g e r i a l w o r k E I
2 1 . 2 2 . 2 3 . 2 4 .
P r o m o t i o n would depend on quality of y o u r w o r k a n d not seniority W o r k w h i c h w o u l d d e m a n d considerable initiative
P r o m o t i o n would depend o n m e r i t , not c l a s s o r type of degree o r G . C . E . T h e w o r k w o u l d m a k e full use of y o u r capabilities
F F F F
F F F
A
2 5 . 2 6 .
2 7 .
T h e r e would b e opportunities for t r a v e l on the job
Y o u w o u l d have opportunities to w o r k i n a field .quite outside y o u r previous e x p e r i e n c e
I t w o u l d be e a s y to get a job overseas i n t h i s field of w o r k
G
G G
G
G G
2 8 . W o r k i n w h i c h y o u w o u l d spend m o s t of y o u r t i m e t a l k i n g to a n d
T A B L E 1 2 : P R I N C I P A L C O M P O N E N T L O A D I N G S O F C A R E E R A S P I R A T I O N I T E M S I N T H E U N D E R G R A D U A T E A N D S I X T H F O R M S T U D I E S
, . j • , , <•>
T h e first t w o c o l u m n s show the loadings of the i t e m s o n the first p r i n c i p a l component i n the U n d e r g r a d u a t e S t u d y a n d i n the S i x t h F o r m S t u d y . I t w i l l be seen t h a t the two a r e by no m e a n s i d e n t i c a l . F u r t h e r m o r e the first P r i n c i p a l C o m p o n e n t f r o m the U n d e r g r a d u a t e S t u d y is not r e p l i c a t e d i n any of the components f r o m the S i x t h F o r m S t u d y . P r i n c i p a l C o m p o n e n t L o a d i n g s
to one d e c i m a l p l a c e ( d e c i m a l point omitted), (loadings below -35 omitted) ;
t
P C I P C 1 P C 2 P C 2 P C 3 P C 3 P C 4 P C 4 P C S P C S
I •! S I • I
d 1 cs ct tt \ . st
« § • * 3 2 o 2 o 2 5 £ to u to & to fc to w to tt .C & •£ « 49 (S J S j
I t e m s P W D U I P U I D O T D C A
1. T h e o r e t i c a l w o r k a i m e d a t i n c r e a s i n g fundamental knowledge J - 7 + 4 2 . Y o u w o u l d have opportunities of continuing y o u r studies a s p a r t of y o n r 1
w o r k 4 \ - 6 4 3 . T h e w o r k w o u l d be intellectually developing a n d s t i m u l a t i n g 5 5 i
4 . S o c i a l S e r v i c e s — h o s p i t a l * p r o b a t i o n , youth s e r v i c e s . N O T school 1
t e a c h i n g 5 - 7
5. W o r k i n w h i c h y o u w o u l d s p e n d m u c h of y o u r t i m e dealing w i t h j c h i l d r e n o r young people 5 - 6 4 6. Y o u w o u l d be doing a s o c i a l l y useful job 6 - 6 7. Y o u r w o r k w o u l d be of immediate benefit to others 6 - 5 4 8. Y o u w o u l d b e meeting a v a r i e t y of different t y p e s of people 7 - 4 6 9 . T h e r e w o u l d be good opportunities for promotion throughout y o u r c a r e e r 5 6 6 10. T h e u l t i m a t e s a l a r y prospects i n y o u r c a r e e r would be good 5 6 6
1 1 . T h e r e w o u l d be s e c u r i t y of e m p l o y m e n t 4 j 4 4 - 6
1 2 . A j o b w i t h long holidays 4 | 4 4 1 3 . Y o u r colleagues would be interesting a n d s t i m u l a t i n g 5 5
1 4 . T h e r e would be good relations between a l l levels of staff 4 5 i 1 5 . T h e r e w o u l d be a congenial a t m o s p h e r e i n w h i c h to w o r k 5 5 ' 1 6 . T h e r e w o u l d be plenty of opportunities to develop outside interests 5 5 !
17. I n d u s t r y — m a n u f a c t u r i n g , p r o c e s s i n g , p u b l i c utilities 6 5 4
18. B u s i n e s s — c o m m e r c e , i n s u r a n c e , finance, r e t a i l 5 6 4 1 9 . W o r k i n w h i c h y o u would spend m u c b of y o u r t i m e dealing w i t h figures 4 4
2 0 . G e n e r a l a d m i n i s t r a t i v e , o r g a n i s i n g , m a n a g e r i a l w o r k 4 5 4 5 2 1 . P r o m o t i o n would depend o n q u a l i t y of y o u r w o r k a n d not seniority 4 {
2 2 . W o r k w h i c h would d e m a n d considerable initiative 4 j 5 4 4 2 3 . P r o m o t i o n w o u l d depend on m e r i t , not c l a s s o r type of degree o r G C E 4
2 4 . T h e w o r k would m a k e f u l l use of y o u r c a p a b i l i t i e s 4 4 [ 4
2 5 . T h e r e w o u l d be opportunities for t r a v e l o n the job 4 4 - 5
2 6 . Y o u would h a v e opportunities to w o r k i n a field quite outside previous t e x p e r i e n c e 4 |
2 7 . I t would be e a s y to get a job overseas i n this field of w o r k 4 I 4 - 5
2 8 . W o r k i n w h i c h y o u w o u l d be t a l k i n g to a n d dealing directly w i t h adults 5 I 5 5
correlation matrix, all the studies reported have been carried out on very large samples. It is therefore appropriate to report that when the results obtained from a pilot study of ioo informants were compared with the results obtained in a subsequent large study alt the factors which emerged from the pilot, other than those which had been obtained in previous large studies, completely disappeared in the main study. It would appear that where a well established factor is fed into a small sample study it is likely to emerge in the analysis, but the reverse is not true: factors emerging from analyses of data obtained fr6m small pilot samples are less likely to emerge in larger studies. Considerable! care should therefore be observed in drawing conclusions from analyses based Ion small samples.
Stability of Factor Patterns as the Number of Factors Rotated fi Varied
T A B L E 1 3 : V A R I M A X S O L U T I O N S F O R S I X T H F O R M P U P I L S C A R E E R A S P I R A T I O N S
M A T E R I A L . t
T h e T a b l e lists the i t e m s m a k i o g up the f a c t o r s e x t r a c t e d , r a n k e d i n e a c h c a s e a c c o r d i n g to their f a c t o r loadings. L o a d i n g s of l e s s t h a n -3 omitted, d e c i m a l point omitted.
9 — F A C T O R S 6 — F A C T O R S 4 — F A C T O R S
I t e m N o s .
3 7 1 7 7 31 7 4 7 2 7 7 7
9 7
2 6 8
1 8 8
2 5 4
10 8
1 7 6 3 4 3
12 4
3 4 6 3 3 6 1 3 3 3
8 7
2 3 6 2 7 : 5 3 0 3 14 7 15 , 5 21 s 5
28 ; 6
19 !r. s
11 5 2 2 5 1 6
2 4 • 3 2 4 2 0 :
2 9 3 5 3 3
9 I t e m
N o s . 1 2 3 4 5 6
I t e m
N o s . 1 2 3 4
31 7 31 7
17 7 17 7
3 7 4 6
4 7 3 6
3 2 5 3 3 2 5
5 4 3 2 0 4
21 5 4
2 7 3 0 4 3
7 7 2 4 3 3
9 6 21
18 7 2 7
2 6 7 7 6
1 2 4 3 9 6
2 5 4 3 19 5
1 3 3 2 2 5
11 3 3 2 8 3 4
10 8 3 3 4 3
1 7 3 4
6 3 4 18 6
3 3 3 6 26 6
28 5 2 7 4 3
2 2 3 5 2 5 4
3 4 5 16 4
2 0 3 4 11 4
19 . 4 4 13 3
2 9 4 29 3 3
2 7 6 12
2 3 5 1 0 5
7 15 5 1 5
6 8 5 8 S
4 3 0 5 2 3 4
4 2 4 3 3 6 3 3 4
4 14 3 15 3
3 16 3 1 4
7 10 7 7 6 7 7
5 5 % total v a r i a n c e 4 4 % total v a r i a n c e 3 S % total v a r i a n c e
which they are assigned look reasonable in all the studies. It is important to emphasise this point in view of what is to follow: One would assume from the data presented in Table 13 that a detailed inspection of the structure of the inter-correlations between the items involved would reveal a reasonably "good" picture (for:definition of "good" see the introductory discussion above).
And,indeed, in the 9-factor solution we obtain a fairly typical picture: while it is true that some of the clusters are made up of items which are not very highly correlated with each other (in spite of their high loadings on those factors in the first part of Table 13) and some items, also with high loadings, are not correlated very highly with the clusters to which they are assigned, the picture is such that it could reasonably easily be sorted out by inspection of the correlation matrix.
However, Tables 15 and 16 show that the picture becomes increasingly blurred as less and less factors are rotated.
The point that the factor loadings are not, in fact, a very good guide to the items that are highly intercorrelated should be re-emphasised. As fewer and fewer factors are rotated the items are, as it were, squeezed into previously good factors. Scores based on these solutions would be even less meaningful than scores obtained
oo
0\
TABLE 14: CORRELATION MATRIX FOR PUPILS CAREER ASPIRATION MATERIAL WITH 9 FACTORS EXTRACTED. CORRELATIONS OF L E S S THAN -2 OMITTED: DECIMAL POINT OMITTED
3 4 17 31 2 7 9 18 25 26 1 6 10 12 13 33 34 8 23 27 30 14 15 21 11 19 22 28 5 16 20 24 29 32|
from the 9-factor solution—and scores from that would be highly misleading in some cases.
The next table compares the three solutions. It will be seen that the stronger clusters recur in each analysis, even though they are obscured by the addition
T A B L E 1 7 : P U P I L S C A R E E R A S P I R A T I O N S , M A I N S U R V E Y , 9 - 6 - A N D 4 - F A C T O R V A R T M A X S O L U T I O N S C O M P A R E D
N o t e t h a t , u n l i k e T a b l e 1 3 , the i t e m n u m b e r s have been left i n the s a m e o r d e r f r o m a n a l y s i s to a n a l y s i s i n o r d e r to f a c i l i t a t e c o m p a r i s o n . ( F a c t o r L o a d i n g s of I t e m s , c o r r e c t to one d e c i m a l p l a c e , d e c i m a l point omitted, loadings less t h a n -35 omitted)
I t e m N o s .
M c Q u i t t y C l u s t e r s
9 F a c t o r S o l u t i o n
1 2 3 4 5 6 7
6 F a c t o r S o l u t i o n F a c t o r N u m b e r
8 9 1 2 3 4 5 6
4 F a c t o r S o l u t i o n
1 2 3 4
3 A 8 7 7
4 A 7 7 7
17 B 7 7 7
31 B 7 7 6
2
c 8 8 7
7
c 8 7 6
9 c 7 6 6
18 D 8 7 7
2 5 D 4 4 5
2 6 D 8 7 7
1 E 8 7 5
6 F 4 5 4
10 E 8 8 6
1 2 E 4 4 4
13 J 4 4 4 4
3 3 G 7 6 4
3 4 G 7 5
8 H 7 5 5
2 3 H 7 6 5
27 H 6 6 5
3 0 H 5 4 4
1 4 I 7 4
15 I 6 6 4
21 1 5
11 E 5 4
19 J 6 4 6
2 2 J 5 6 6
28 J 6 6 5
5 K 4 4
16 L 7 5
2 0 L 5 5 5
2 4 L 6 4 4
2 9 K 4 4 4
3 2 K 4 5 5 4 6
2 . I t e m numbers c o m p r i s i n g e a c h f a c t o r
3 2 2 6 10 3 4 8 14 2 8 16 31 2 18 10 3 3 27 31 2 18 10
17 7 18 1 3 3 2 3 15 1 9 2 4 17 7 2 6 1 28 2 3 17 7 26 1
31 9 2 5 6 27 21 11 3 2 3 9 12 6 2 2 1 5 4 9 2 7 8
4 1 2 2 2 20 4 1 9 2 5 3 4 8 3 1 9 2 5 2 3
3 2 20 2 9 3 2 20 30 3 2 2 2 16 6
5 19 2 0 2 8 11 2 9 5 3 3
3 0
of other items. Notice, too, the similarity of the 9-factor Varimax solution and the McQuitty solution.
Stability When More Items are Added j
One of our analyses of what the pupils wanted out of sixth fdrm education was carried out on 80 items and another on a sub-set of 34 items drawn from the
80. Inspection "of the correlation matrices for the 34 items common to both
analyses reveals that the addition of extra variables, when these do not come
S C H O O L T Y P E , F A C T O R S T R U C T U R E C O M P A R I S O N O F T W O D I F F E R E N T S A M P L E S : ( a ) a l l schools, (b) boarding schools e x c l u d e d . : ~ '
F a c t o r loadings to first d e c i m a l p l a c e . j D e c i m a l point omitted.
L o a d i n g s under .4 omitted. 1
A L L S C H O O L S E X C L U D I N G I N D E P E N D E N T D I R E C T G R A N T ! A N D B O A R D I N G S C H O O L S
1 0 — F A C T O R S O L U T I O N 1 0 — F A C T O R S O L U T I O N
1 1 3 4 S 6 7 8 9 10 1 2 3 4 5 6 7 8 9 10
f 3 2
38 4 3 4 4 48 4 9 50 59 2 4 15 16 2 4 27 2 9 3 0 4 0 1 8 11 37 46 60 7 21 47 55 57 5 6 3 3 3 5 3 9 10 2 3 2 5 1 3 18 3 4 58 14 2 2 2 6 31 36 1 2 17 41 4 2 51 5 2 5 3 5 4 5 6 19 2 0 28 4 5
from exactly the same data field, and when the number of factors extracted is not simultaneously increased, has much the same effect as rotating too few factors— items which do not really belong to a factor get pushed into it. In cases such as this, the insertion of extra variables, far from helping to clarify the picture, serves to obscure it.
Stability When a Biased Sample of Information is Left Out
In order to ensure that the ways in which we classified schools made sense within one section of schools (state schools) as well as across all schools, separate analyses of school type were run for all schools and for all schools excluding Independent, Direct Grant, and Boarding schools. Since the latter types of schools are in many ways so different from other schools, it is of considerable interest to be able to report that the results of the analysis were remarkably similar in the two cases. Table 18 gives results. The two very weak factors, factors 5 and 6, do get broken up.
Conclusions
1. It is important to select a Principal Component (unrotated) or a Varimax
(rotated) solution (or some entirely different form of analysis) in accordance with an explicit psychological model of the data field in which one is working, and not on the basis of the selective availability of computer programmes or beliefs about whether it is "best" to rotate or not.
2. It is important to look at the correlation matrices, tedious though this is. 3. It is usually possible to improve on the computer solution by inspection and
to test this solution by calculating a.
4. Strong Varimax factors tend to be stable over time, over variations in
sample size, over population changes, over rotation of varying numbers of factors, and over addition of additional items.
Economic and Social Research Institute, Dublin.
British Government Social Survey.
REFERENCES
CU1R (1963) Factor Analysis. B I M D 17 (H. H . Harman).
Holzinger and Harman, in Fruchter, B . (1954) Introduction to Factor Analysis. McKenneU, A . C . & Bynner, J . , The Young Smoker, Govt. Social Survey Report 385.
McKcnnell, A. C . (1967), Use of Coefficient Alpha in constructing attitude and similar scales. Social Survey Paper M139.
McQuitty, L . K . (1957), Elementary Linkage Analysis. Educ. Psychol. Meas. 17, p. 207.
Morton-William, R., Finch, S., & Poll, C , Undergraduates' Attitudes Toward School Teaching as a Career, Government Social Survey Report No. 354.
Raven, J . and Ritchie, J . , A Comparison of 5 Techniques of Data Analysis, Social Survey Paper No.
.M134. . ., j. . „ u -r L / V - : r =
Raven, J . ' & Baxter, D.,v Stability of Factor Patterns.* ESRI paper' to be 'released1 Y ''
Rosenberg, M . (1958), Occupations and Values, Free Press, Clencoe. j