Original Article
Histological validation of frequency
domain optical coherence tomography for
the evaluation of neointimal formation after a
novel polymer-free sirolimus-eluting stent implantation
Qiang Fu1, Hongyu Hu1, Wei Chen1, Zhixu Tan1, Li Li2, Dezhao Wang1, Buxing Chen1
1Department of Cardiology, Beijing Tiantan Hospital, Capital Medical University, Beijing, China; 2Department of
Pathology, National Center for Cardiovascular Disease, China and Fuwai Hospital, Chinese Academy of Medical Sciences and Peking Union Medical College, Beijing, China
Received August 1, 2015; Accepted August 28, 2015; Epub September 1, 2015; Published September 15, 2015
Abstract: Novel polymer-free drug-eluting stents have been developed to reduce polymer-related adverse events. However, neointimal coverage after polymer-free DES implantation is unclear and validation between optical co-herence tomography (OCT) and histology is required. Sixteen polymer-free sirolimus-eluting stents were randomly implanted into coronary arteries of 8 normal swine. OCT and histological measurement were conducted at 3 or 6 months after stent placement. For quantitative measures, lumen area, stent area, neointimal area and neointimal thickness were validated in every single OCT and histology matched cross-section. Moreover, for qualitative analy-sis, OCT signal patterns of neointimal tissue were classified as homogeneous, layered and heterogeneous patterns based on optical intensity and backscatter pattern and peri-strut inflammation was also determined by histology. In total, 70 OCT and histology matched cross-sections were analyzed. At quantitative analysis, good correlations and agreements were found in the measurement of lumen area (ICC = 0.67, P<0.001), neointimal area (ICC = 0.89,
P<0.001) and neointimal thickness (ICC = 0.94, P<0.001) except for stent area (ICC 0.19, P = 0.13) between OCT and histology. At qualitative analysis, lymphocyte infiltrations of peri-strut were more frequently seen in heteroge -neous sections than in homoge-neous sections (10/14 sections, 71.4% vs. 12/50 sections, 24%; P = 0.003). In conclusion, OCT has proper correlation and agreement with histology in assessment of neointimal formation and heterogeneous neointima assessed by OCT may also be associated with peri-strut inflammation detected in histol -ogy after polymer-free sirolimus-eluting stents implantation, supporting the use of OCT to evaluate neointimal cover-age after polymer-free stent implantation in clinical practice.
Keywords: Polymer-free, optical coherence tomography, histology, neointima
Introduction
Although drug-eluting stent (DES) is deemed to be the effective interventional strategy for coro-nary artery disease, in-stent thrombotic event has become a critical concern with the increas-ing clinical use of DES [1-3]. In order to solve the issue, several polymer-free DESs have been developed and also proved to be a feasible method to decrease polymer-related adverse events [4-6]. Optical coherence tomography (OCT) is an ideal intravascular imaging tool to quantitatively evaluate neointimal coverage and stent healing after stent implantation owing to its high resolution, which is 10 times higher than intravascular ultrasound [7-10]. Re-
Histological validation of OCT in neointima
Materials and methods
Nano polymer-free sirolimus-eluting stent
Nano (Lepu Medical Technology, Beijing, China) polymer-free sirolimus-eluting stents (SES) are made of stainless steel and the sirolimus con-centration is 1.2 μg/mm2. There are a large
number of pores with a diameter of 100 nm×1 μm on the stent struts and sirolimus is released slowly via the nano-porous surface of the stent platform.
Animal study design
A total of 8 juvenile Chinese swine with a body weight of 20 to 30 kg were used in this study. Sixteen nano polymer-free SES were random-ized to implantation into the right coronary artery (RCA), left anterior descending (LAD) or left circumflex (LCX) coronary artery with two stents in each swine model (one stent per ves-sel). Three days before coronary procedure, ani-mals were given 300 mg of aspirin and 75 mg of clopidogrel. Thereafter, antiplatelet therapy of 75 mg clopidogrel and 100 mg of aspirin was administered daily throughout the study in all animals. Coronary catheterization was per-formed after the administration of intravenous heparin (5000 u). Baseline angiography was acquired and all stents were implanted with a vessel overstretch of 10-20% compared with the reference vessel diameter to induce a mod-erate vessel injury and promote neointimal for-mation. Stents of 14, 15 or 18 mm length and diameters of 2.5, 2.75 or 3.0 mm were implant-ed according to the coronary artery size. FD-OCT follow-up study was performed at 3 and 6 months after stent implantation (eight stents/four pigs each time point). The study protocol was approved by the institutional ani-mal care and use committee at Beijing Tiantan Hospital.
FD-OCT acquisition and analysis
FD-OCT imaging was performed using the C7-XR OCT intravascular imaging system (Li- ghtlab Imaging, Inc., St Jude Medical, USA). During FD-OCT image acquisition, a continuous non-occlusive contrast-saline mixture as a flush was administrated to replace coronary blood flow and automatic pullbacks were performed at a rate of 20 mm/s and 100 frames/s. Off-line OCT analysis was performed with Light Lab Imaging software.
For quantitative analysis, cross-sectional OCT images were analyzed at 1-mm longitudinal steps throughout the pullback from distal stent edge to proximal stent edge. OCT images were excluded from the analysis if stent struts were not visible on the screen, bifurcation cross-sec-tions with side branches, or residual blood was mistaken for neointimal tissue. The lumen and stent were manually traced and stent struts were positioned manually in the center of the stent strut which showed a bright “blooming” appearance [14]. The following parameters were measured: lumen area (defined as the delimiting contours of the lumen), stent area (identified by circumferential area limited by the contours of the struts), neointimal area (stent area-lumen area), neointimal burden (mean neointimal area/mean stent area ×100%). To analyze a neoinitimal thickness, the distance from the center of each stent strut to the lumi-nal border was measured in the direction of the center of gravity. Quantitative analyses of all OCT images were performed by two indepen-dent investigators (F.Q. and T.Z.) who were masked to the angiographic data and clinical presentations. Inter-observer agreement was determined by calculating values for differenc-es in measurements of neoinitimal area and neoinitimal thickness analyzed by 50 cross-sectional images without artifacts.
[image:2.612.90.299.110.185.2]For qualitative analysis, the OCT signal patterns of neointimal tissue were categorized into three patterns based on Gonzalo’s classification: homogeneous, layered and heterogeneous pat-terns [15]. The homogeneous pattern is defined as neointimal tissue with uniform optical prop-erties without focal variation in the backscat-tering pattern. The heterogeneous pattern is defined as neointimal tissue with focally chang-ing optical properties and various backscatter-ing patterns, and the layered pattern has con-centric layers with different optical properties.
Table 1. Comparison of the quantitative param-eters between FD-OCT and histological measure-ments
FD-OCT Histology Lumen area mm2 2.4±0.7 2.0±0.5
Stent area mm2 3.9±0.5 3.6±0.5
Neointimal area mm2 1.5±0.5 1.7±0.6
Neointimal burden % 37.8±13.1 44.8±14.6 Neointimal thickness μm 261.2±109.5 269.8±107.2
Histological analysis
All animals were euthanized after follow-up coronary angiography and OCT imaging. Im- mediately after euthanasia, the hearts were excised and the stented coronary artery seg-ments were then harvested from the heart by careful dissection and fixed by immersion in 10% formalin, dehydrated in a graded series of ethanol, and embedded in methyl methacrylat-eresin. After polymerization, sections measur-ing approximately 1.3 mm were sawed from each stent, beginning at the distal stent edge. The artery-stent specimens were cut on a rota-ry microtome at 100 μm from the proximal through the distal margin of the stent and stained with hematoxylin and eosin as well as elastic Van Gieson stains. There were no histo-logical sections lost due to processing, and all sections were of excellent quality.
The cross-sectional areas including external elastic lamina representing stent area, internal elastic lamina and lumen area of each section were measured. Neoinitimal thickness was de- termined as the distance between the inner
surface of each stent strut and the luminal bor-der in the direction of the center of gravity. Morphometric analysis was performed by Im- agePro Plus 6.0 software (Media Cybernetics, Inc. USA).
For qualitative assessment, all sections were analyzed by light microscopy. Stent-associated inflammation and neovascularization identified by microvessels in the neointima were investi-gated. All histomorphologic analysis was com-pleted by a single independent investigator (L.L.) blinded to the present study.
Statistical analysis
[image:3.612.89.523.71.350.2]Data are reported as means and standard devi-ations for normally distributed continuous data or medians with interquartile ranges for non-normally distributed data. Student’s t-test (two-sided) was used for comparison of normally distributed continuous data, and Mann-Whitney U-test (two-sided) was used for the statistical comparison of non-normally distributed contin-uous data. The association between FD-OCT and histological analysis was calculated using
Histological validation of OCT in neointima
intra-class correlation coefficient (ICC). The agreement between FD-OCT and histological analysis was determined by Bland-Altman plots [16]. Additionally, inter-observer variability for the quantitative OCT assessment was investi-gated using a kappa analysis. Differences we- re considered statistically significant at P<0.05. Statistical analyses were performed using SPSS 20.0 software (IBM Corporation, Armonk, NY, USA).
Results
A total of 70 OCT and histology matched cross-sections were analyzed in the present study. The quantitative parameters between FD-OCT and histological measurements are shown in
Table 1. The lumen and stent areas measured by FD-OCT were slightly larger, on average, than those measured by histology. Conversely, FD-OCT measurements have smaller neointi-mal area, neointineointi-mal burden and neointineointi-mal thickness compared with histological
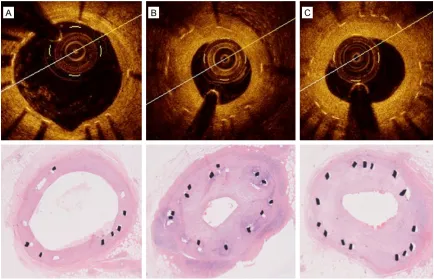
[image:4.612.92.522.72.405.2]measure-ments. Representative images of FD-OCT and histomorphologic sections after Nano polymer-free SES implantation are shown in Figure 1. Inter-observer variability for the quantitative FD-OCT assessment showed good concorda- nce: k = 0.91 for neointimal area, k = 0.81 for neointimal thickness.
Figure 2 showed correlations of quantitative parameters between FD-OCT and histological measurement. Adequate correlations were fo- und in the measurement of lumen area (ICC 0.67, P<0.001), neointimal area (ICC 0.89,
P<0.001) and neointimal thickness (ICC 0.94,
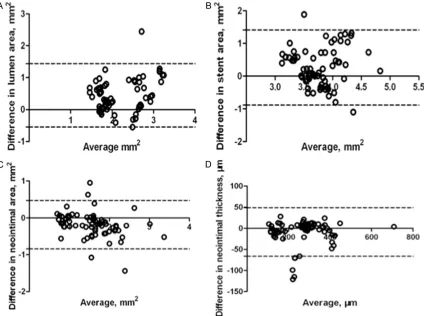
P<0.001) except for stent area (ICC 0.19, P = 0.13). Similarly, the Bland-Altman analysis is shown in Figure 3, suggesting that there are good agreements between FD-OCT and histo-logical measurements in terms of lumen area, neointimal area and neointimal thickness ex- cept for stent area.
As for tissue characteristics of neointima assessed by FD-OCT, 70 OCT and histology matched cross-sections were classified to 50 homogeneous sections (71.4%), 14 heteroge-neous sections (20%) and 6 layered sections (8.6%).
Additionally, in histological analysis, lympho-cyte infiltrations of peri-strut were observed in 22 OCT and histology matched sections and more frequently seen in heterogeneous sec-tions than in homogeneous secsec-tions (10/14 sections, 71.4% vs. 12/50 sections, 24%; P = 0.003).
Discussion
The present study demonstrates good agree-ments between FD-OCT and histological quan-titative analysis for the evaluation of neointi- mal formation after novel nano polymer-free drug-eluting stent in a pig model. Moreover, at qualitative analysis, heterogeneous neointima assessed by FD-OCT may also be associated
with peri-strut inflammation detected in his- tology.
Recently, FD-OCT has emerged as a novel, high-ly rapid coronary imaging method for assess- ing neointimal coverage after coronary stent implantation [17]. Furthermore, according to our previous investigation, OCT can detect dif-ferent signal intensity and attenuation in differ-ent period of in-stdiffer-ent restenosis [18]. However, the accuracy of this imaging method needs to be further evaluated, especially validate with histology. In addition, polymer-free stent has begun to apply increasingly in clinical practice but morphological characteristics of in-stent neointimal tissue assessed by OCT are not still fully investigated.
[image:5.612.95.519.72.388.2]With respect to quantitative measures, lumen area, neointimal area and neointimal thickness as detected by FD-OCT correlated closely with these parameters as measured by histology, demonstrating an excellent agreement in the present study. However, no significant relation
Histological validation of OCT in neointima
of measurement of stent area between FD-OCT and histology was found. Moreover, the OCT measurements of lumen and stent area were greater than the same histological measure-ments in the study, and similar result was also reported by Murata A et al [7]. The differences may be mainly attributed to different method of measurement. In general, histomorphological analysis used as the gold standard defines in-stent neointima as the interval encompassed by the internal elastic lamina and the lumen boundaries in vessel cross-sections, whereas in OCT imaging, the internal elastic lamina can-not be identified and the stent outline is used as a substitute for the calculation of neointimal parameters [19]. Thus, the technical issue may result in differences of some of the measure-ments between OCT and histomorphology. In addition, vascular tissue shrinkage during his-tological procedure could be involved [20]. Nevertheless, in the present study, we showed that the quantitative assessment of in-stent neointimal proliferation using OCT is correlated with the measurements from histomorphologi-cal analysis, suggesting that OCT can provide precise measurement like histomorphology for in-stent neointimal proliferation due to its high resolution.
On the other hand, FD-OCT measurements seem to be related to histomorphological results in the qualitative analysis. In histomor-phological analysis, obvious lymphocyte infiltra-tion of peri-strut was found and more prevalent in heterogeneous structure assessed by OCT, suggesting that heterogeneous neointima may be associated with peri-strut inflammation. Likewise, Tearney GJ et al [21] also investigated the use of OCT for assessing macrophages deg-radation, demonstrating that the high resolu-tion of OCT may be well suited for identifying macrophages within fibrous caps. However, FD-OCT was still difficult to identified lympho-cyte infiltration around stent strut. A possible explanation for the finding is that light attenua-tion within arterial tissue and strut blooming resulted in a lack of peri-strut tissue detection [7].
Overall, our findings demonstrate that neointi-mal parameters including neointineointi-mal area and neointimal thickness measured by FD-OCT may be substituted for the measurements of histo-pathology. Moreover, OCT heterogeneous
neo-intima may be associated with peri-strut inflam-mation detected in histology.
Study limitation
The main limitation of this study was that stents were placed in health pigs without atheroscle-rotic disease and thus several complex profiles of arterial healing and neointimal formation in human could not be detected. Furthermore, the sample size of animals is small.
Conclusion
Proper correlation and agreement were found in assessment of neointimal formation between FD-OCT and histology as well as OCT heteroge-neous neointima might be associated with peri-strut inflammation detected in histology, sup-porting the use of FD-OCT to evaluate neointimal coverage after polymer-free stent implantation in clinical practice.
Acknowledgements
This work was funded by Beijing Municipal Commission of Health and Family Planning (Grant number: 2011-3-026). The authors would like to thank for the expert technical assistance of the staff at Beijing Pinggu hospi-tal in animal experimenhospi-tal phases of this study.
Disclosure of conflict of interest
None.
Address correspondence to: Dr. Buxing Chen, De- partment of Cardiology, Beijing Tiantan Hospital, Capital Medical University, 6 Tiantanxili, Dongcheng District, Beijing, China. Tel: 86-10-6709-6572; Fax: 86-10-6709-6572; E-mail: chbux@126.com
References
[1] Stone GW, Ellis SG, Cox DA, Hermiller J, O’Shaughnessy C, Mann JT, Turco M, Caputo R, Bergin P, Greenberg J, Popma JJ, Russell ME; TAXUS-IV Investigators. A polymer-based, pacli -taxel-eluting stent in patients with coronary artery disease. N Engl J Med 2004; 350: 221-231.
[3] Nakazawa G, Finn AV, Vorpahl M, Ladich ER, Kolodgie FD, Virmani R. Coronary responses and differential mechanisms of late stent thrombosis attributed to first-generation siroli -mus- and paclitaxel-eluting stents. J Am Coll Cardiol 2011; 57: 390-398.
[4] Hausleiter J, Kastrati A, Wessely R, Dibra A, Mehilli J, Schratzenstaller T, Graf I, Renke-Gluszko M, Behnisch B, Dirschinger J, Winter-mantel E, Schömig A; investigators of the indi-vidualizable durg-eluting Stent System to Abrogate Restenosis Project. Prevention of re-stenosis by a novel drug-eluting stent system with a dose-adjustable, polymer-free, on-site stent coating. Eur Heart J 2005; 26: 1475-1481.
[5] Mehilli J, Kastrati A, Wessely R, Dibra A, Haus-leiter J, Jaschke B, Dirschinger J, Schömig A; Intracoronary Stenting and Angiographic Re-stenosis-Test Equivalence Between 2 Drug-Eluting Stents (ISAR-TEST) Trial Investigators. Randomized trial of a nonpolymer-coated ra-pamycin-eluting stent versus a polymer-coated paclitaxel-eluting stent for the reduction of late lumen loss. Circulation 2006; 113: 273-279. [6] Ruef J, Störger H, Schwarz F, Haase J.
Com-parison of a polymer-free rapamycin-eluting stent (YUKON) with a polymer-coated pacli- taxel-eluting stent (TAXUS) in real-world coro -nary artery lesions. Catheter Cardiovasc Interv 2008; 71: 340-341.
[7] Murata A, Wallace-Bradley D, Tellez A, Alviar C, Aboodi M, Sheehy A, Coleman L, Perkins L, Na-kazawa G, Mintz G, Kaluza GL, Virmani R, Granada JF. Accuracy of optical coherence to-mography in the evaluation of neointimal cov-erage after stent implantation. JACC Cardio-vasc Imaging 2010; 3: 76-84.
[8] Templin C, Meyer M, Müller MF, Djonov V, Hlushchuk R, Dimova I, Flueckiger S, Kronen P, Sidler M, Klein K, Nicholls F, Ghadri JR, Weber K, Paunovic D, Corti R. Coronary optical fre-quency domain imaging (OFDI) for in vivo eval-uation of stent healing: comparison with light and electron microscopy. Eur Heart J 2010; 31: 1792-1801.
[9] Jang IK, Bouma BE, Kang DH, Park SJ, Park SW, Seung KB, Choi KB, Shishkov M, Schlen-dorf K, Pomerantsev E, Houser SL, Aretz HT, Tearney GJ. Visualization of coronary athero-sclerotic plaques in patients using optical co-herence tomography: comparison with intra-vascular ultrasound. J Am Coll Cardiol 2002; 39: 604-609.
[10] Coletta J, Suzuki N, Nascimento BR, Bezerra HG, Rosenthal N, Guagliumi G, Rollins AM, Costa MA. Use of optical coherence tomogra-phy for accurate characterization of athero-sclerosis. Arq Bras Cardiol 2010; 94: 250-4, 268-72, 254-259.
[11] Tearney GJ, Waxman S, Shishkov M, Vakoc BJ, Suter MJ, Freilich MI, Desjardins AE, Oh WY, Bartlett LA, Rosenberg M, Bouma BE. Three-dimensional coronary artery microscopy by in-tracoronary optical frequency domain imaging. JACC Cardiovasc Imaging 2008; 1: 752-761. [12] Her AY, Kim JS, Kim YH, Shin DH, Kim BK, Ko
YG, Choi D, Jang Y, Hong MK. Histopathologic validation of optical coherence tomography findings of non-apposed side-branch struts in porcine arteries. J Invasive Cardiol 2013; 25: 364-366.
[13] Kim JS, Afari ME, Ha J, Tellez A, Milewski K, Conditt G, Cheng Y, Hua Yi G, Kaluza GL, Granada JF. Neointimal patterns obtained by optical coherence tomography correlate with specific histological components and neointi -mal proliferation in a swine model of resteno-sis. Eur Heart J Cardiovasc Imaging 2014; 15: 292-298.
[14] Guagliumi G, Musumeci G, Sirbu V, Bezerra HG, Suzuki N, Fiocca L, Matiashvili A, Lortkip-anidze N, Trivisonno A, Valsecchi O, Biondi-Zoccai G, Costa MA; ODESSA Trial Investiga-tors. Optical coherence tomography assess- ment of in vivo vascular response after implan-tation of overlapping bare-metal and drug-elut-ing stents. JACC Cardiovasc Interv 2010; 3: 531-539.
[15] Gonzalo N, Serruys PW, Okamura T, van Beusekom HM, Garcia-Garcia HM, van Soest G, van der Giessen W, Regar E. Optical coher-ence tomography patterns of stent restenosis. Am Heart J 2009; 158: 284-293.
[16] Bland JM, Altman DG. Statistical methods for assessing agreement between two methods of clinical measurement. Lancet 1986; 1: 307-310.
[17] Chen BX, Ma FY, Luo W, Ruan JH, Xie WL, Zhao XZ, Sun SH, Guo XM, Wang F, Tian T, Chu XW. Neointimal coverage of bare-metal and sirolim-us-eluting stents evaluated with optical coher-ence tomography. Heart 2008; 94: 566-570. [18] Fu Q, Suzuki N, Kozuma K, Miyagawa M,
No-mura T, Kawashima H, Shiratori Y, Ishikawa S, Kyono H, Isshiki T. Quantitative optical coher-ence tomography analysis for late in-stent re-stenotic lesions. Int Heart J 2015; 56: 13-17. [19] Lemos PA, Takimura CK, Laurindo FR,
Gutier-rez PS, Aiello VD. A histopathological compari-son of different definitions for quantifying in-stent neointimal tissue: implications for the validity of intracoronary ultrasound and optical coherence tomography measurements. Car-diovasc Diagn Ther 2011; 1: 3-10.
Histological validation of OCT in neointima
coherence tomography and histology of over-lapping everolimus-eluting bioresorbable vas-cular scaffolds in a porcine coronary artery model: the potential implications for clinical practice. JACC Cardiovasc Interv 2013; 6: 523-532.