AN EX-POST EVALUATION
FRAMEWORK FOR BRT AND MRT IN
MEXICO
A study on the impacts of Bus Rapid Transit and
Mass Rapid Transit in Mexico City
VS.
COLOPHON
Title: An ex-post evaluation framework for BRT and MRT in Mexico
Subtitle: A study on the impacts of Bus Rapid Transit and Mass Rapid Transit in Mexico City
Version: Final
Date: 31 March 2014
Pages: 180
Author: Thijs Teunissen Student number: s0165204
Contact: t.teunissen@student.utwente.nl
Institution: University of Twente
Department: Faculty of Engineering Technology (CTW) Research group: Centre for Transport Studies (CTS)
President supervising committee: prof. dr. ir. K.T. Geurs Daily supervisor University of Twente: dr. ir. L.C. La Paix Puello Supervisor CTS Embarq México: ing. E. Morales Juárez
Rapid urbanization and motorization are causing sustainability issues in large metropolises around the world. These issues particularly manifest in congestion, reduced livability, inequality, environmental deprivation and productivity losses. Mass transit systems offer the potential to mitigate many of these effects through a more efficient transport system. Bus Rapid Transit (BRT) and Mass Rapid Transit (MRT) are the most well-known and popular mass transit solutions. Especially in developing countries these can provide an efficient alternative to low-capacity, unregulated informal public transport. However, the impacts of these systems on sustainability are largely unknown. A lack of ex-post evaluations causes a knowledge gap in whether expected impacts are in fact realized. Furthermore, no studies that compare the two systems exist. Therefore the objective of this thesis is to develop an ex-post evaluation framework to assess and compare the impacts of BRT and MRT systems in developing countries. This framework consists of nine indicators, subdivided into the social, environmental and economic concepts of sustainability. The social indicators are equity and safety from accidents. The environmental indicators are climate change, air pollution and modal shift. The economic indicators comprise travel time savings, construction costs, operating and maintenance costs and revenues. Unlike conventional evaluation methods, this framework only monetizes the economic indicators, since it is difficult to express social and environmental impacts in monetary terms and also undesirable because this underrepresents them in the outcomes. In order to aggregate the individual indicators the flag model was applied, which standardizes the impacts using critical threshold values based on a literature study. Surveys were conducted among passengers to estimate direct effects (370 respondents per corridor) and among other travelers within the zone of influence to approximate indirect impacts (90 respondents per corridor). The ex-post evaluation framework was case-tested in Mexico City on the recently implemented Metrobús (BRT) line four and Metro (MRT) line twelve.
The results show that the Metrobús line performs better in terms of construction costs, operating and maintenance costs and modal shift. Meanwhile, the Metro displays a higher performance for equity, safety, travel time savings, revenues, air pollution and climate change. The aggregated outcomes suggest that the Metrobús performs better on economic and environmental indicators, while the Metro achieves more significant social impacts. Overall, both systems perform equally, although Metrobús performance is slightly higher. Furthermore, the standardized values indicate that the overall performance of both transit lines is slightly below the average of other impact evaluations. Monetary aggregation of the economic indicators suggests that the Metrobús line is economically more efficient, but that profitability is higher for the Metro line. However, a sensitivity analysis reveals that the Metro’s profitability depends heavily on the value of time, while the Metrobús is also profitable for low values of time.
En las grandes metrópolis del mundo, la urbanización y motorización provocan rápidamente problemas de sustentabilidad, que se manifiestan en congestión, habitabilidad reducida, desigualdad, degradación medioambiental y poca productividad. Los sistemas de transporte masivo pueden mitigar potencialmente estos problemas, dado que mejoran la eficiencia de los sistemas de transporte. Los transportes masivos más conocidos y más populares son el BRT y MRT. Especialmente en países en desarrollo, constituyen una alternativa eficiente al transporte público informal, caracterizado por su baja capacidad y la ausencia de regulación. Sin embargo, los impactos de esos sistemas son en gran parte desconocidos. Lo anterior se debe a una falta de evaluaciones ex post, que permiten conocer si se han realizado los impactos previstos. Además, no existe ningún estudio que compare los sistemas BRT y MRT. Por lo tanto, el objetivo de esta tesis es desarrollar una herramienta para evaluaciones ex post que evalúe y compare los impactos en sistemas de BRT y MRT en países en desarrollo.
Rapid urbanization is, especially in developing countries, causing many people to migrate to cities to find income opportunities. Furthermore, cities cannot accommodate the large influx of new citizens, forcing many of them to reside in slums in the outskirts of large metropolises. Such slums lack access to many essential amenities, such as water, education, healthcare and employment and transport opportunities. This lack of opportunities results in large (income) inequalities, especially in less-developed countries. Urbanization in combination with rapid motorization also cause transport demand to increase enormously, while infrastructure provisions often lag, particularly in developing countries. Consequently, congestion is a major problem, with much time lost in traffic, impeding economic efficiency and development. This congestion causes many environmental issues as well, particularly air pollution and climate change. The transport sector is responsible for approximately 22.3% of total CO2 emissions, of
which 73.6% is emitted by road transport. Simultaneously, transport is responsible for the emission of harmful pollutant gases, such as carbon monoxide (CO) and particulate matter (PM), which is mainly evident in large metropolises.
In developing countries, congestion is for a large part due to informal public transport dominating the (public) transport market. As a result, many privately-owned vehicles offer transport services, often using easily navigable small buses or minivans. These services are often unsafe, polluting and overcrowded, but are still popular due to high frequency and coverage. Nonetheless, these services can provide an important complimentary feeder service to mass transit solutions. Mass transit systems have the potential to mitigate congestion by providing a more efficient movement of people. Mass Rapid Transit (MRT) has traditionally been the most popular mass transit mode. However, high capital investments hinder implementation in developing countries. To overcome these affordability issues for mass transit solutions, Curitiba (Brazil) introduced the Bus Rapid Transit (BRT) system in 1974. Bogotá’s TransMilenio mimicked this system in 2000 and henceforth many, mainly Latin American, cities have followed suit. Capacities of full BRT systems approach those of MRT systems, while capital investments are ten to a hundred times lower. Furthermore, BRT provides a flexible and short-term solution to congestion problems. Nonetheless, BRT is still considered a second-hand alternative to MRT, particularly because BRT occupies scarce road space otherwise dedicated to cars.
One of the reasons that ambiguity about the effectiveness of BRT and MRT persists is that effects of BRT and MRT systems have only been researched minimally. Many studies evaluate one or a couple effects, but few conduct an extensive evaluation incorporating a wide range of effects. Especially once a project has been implemented little attention is given to the impacts and successfulness of a project. This study developed an ex-post evaluation framework of BRT and MRT systems in Mexico. This was done by creating a framework that includes non-monetized environmental and distributive social effects, but also monetized economic impacts. The framework is useful to compare the impacts of BRT and MRT systems. This research provides insights in the performance of both systems and how this performance differs. In order to test the ex-post evaluation framework, a case study is conducted in Mexico City. This city was chosen because of the developing country context and since it is one of the few cities that have implemented a BRT and a MRT system.
LITERATURE REVIEW
The drawback of monetization is that social and environmental impacts are difficult to monetize. Even the estimation of non-monetized project effects is regarded extremely difficult for some impacts, particularly public transport projects. Another major shortcoming of CBA is that distributive effects are not taken into account and one person’s can benefit can nullify the costs of a hundred others. In reality, decision makers are also interested in equity, which concerns the fairness of the distribution of effects. This concerns what is an ethically justifiable distribution, i.e. how much some are allowed to ‘suffer’ for the benefit of others. Furthermore, many ex-ante appraisals are based on unrealistic assumptions, resulting in optimism bias to ensure projects go ahead.
The main advantage of ex-post evaluations is that they provide information on actual impacts, which can be used to optimize the assumptions in ex-ante appraisal. The methodology is similar to CBA, but actual observations are used instead of predictions. The two main methodical issues of ex-post evaluations are causality and the evaluation timing. Causality relates to which extent the effects are endogenous or exogenous of project implementation. Short-term evaluation is easier than long-term evaluation, because exogenous effects are minimal. On the other hand, evaluating too early means not all effects may yet be observable.
Many studies were consulted to attain a comprehensive overview of impacts included in transport appraisal. The impacts most often included in transport evaluation are infrastructure costs (construction costs and operating and maintenance costs), user benefits (travel time savings) and externalities (air pollution, climate change, noise and accidents). However, distributional and equity impacts are also important in transport evaluation, because these provide vital information of who benefit from the project and if this is morally just. Furthermore, many ex-post evaluations and ex-ante appraisals only include direct (user) benefits and exclude indirect impacts on travelers who use a different transport mode within the same area.
CASE STUDY: MEXICO CITY
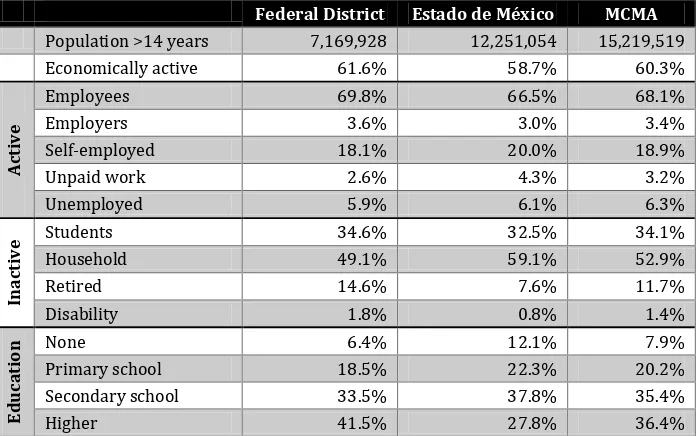
The Mexico City Metropolitan Area (MCMA) is a conglomeration of previously separate cities, often abbreviated to Mexico City. Its central part is the Federal District, but the city also comprises the states Estado de México and Hidalgo. Mexico City is situated in a former lake basin at 2,240 meters above sea level and is surrounded by several mountain ridges. Mexico City has a population of 21.1 million and is the nation’s economic center, producing 27.2% of the national GDP. The Federal District is the main employment center and the Estado de México is more residential, resulting in unbalanced traffic flows within the city. Poverty is more widespread in the Estado de México (45.3%) than in the Federal District (28.5%). Income inequalities are also largest in the Estado de México, with a Gini-index of 0.436 compared to a Gini-index of 0.413 in the Federal District.
Mexico City is ranked amongst the most polluted cities in the world. The mountain ridges surrounding the city function as a barrier, containing many pollutants within the valley. High pollutant concentrations are primarily caused by transport, which consumes over half of Mexico City’s energy and is responsible 70% of all pollutant emissions. This is aggravated by reduced engine efficiency due to Mexico City’s high altitude. Furthermore, Mexico City’s CO2 emissions
Metro network consists of twelve lines spanning 197 km, transporting 4.7 million passengers daily. A ticket costs US$ 0.37, although some social groups are exempt. The twelfth Metro line, inaugurated in 2012, is the focus of this study. This line was selected because it is the only Metro line that was implemented in recent years. This line has a length of 24.3 km, serves twenty stations, connects with four other Metro lines and transports 430,000 daily passengers, of which 158,000 transfer from other Metro lines.
In 2005 the first BRT corridor was implemented in Mexico City and named Metrobús. Currently, the Metrobús network comprises five lines with a total length of 105 km, transporting 855,000 daily passengers. The Metrobús fare is US$ 0.45. Implementation of the first Metrobús corridors was difficult, because existing operators feared losing income. To resolve this, operators were included in the planning and operation of the Metrobús lines. The fourth Metrobús line was selected for this study, because its recent implementation limits the causality problem described in the previous section. The line is 28 km long, serves 37 stations, connects with six Metro lines and three Metrobús lines and transports 59,344 passengers per working day. It is important to note that the Metrobús line is not a full BRT line, but an open BRT system. Except for the terminals, stops consist of platforms with on-board fare collection. Also, buses are non-articulated because they have to navigate narrow streets in the historic center. This significantly reduces the line’s capacity and number of passengers. The service to and from the airport has a higher fare of US$ 2.25.
METHODS
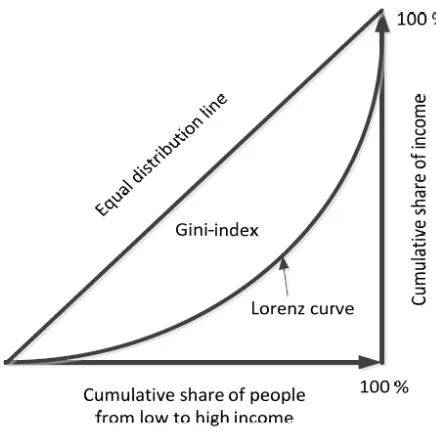
This ex-post evaluation framework evaluates a total of nine social, environmental and economic impacts separately and monetizes only the latter. The evaluation includes both direct (users) and indirect (travelers within the zone of influence using a different transport) impacts. The social indicators included in the framework are equity and safety. Equity regards the fairness of the distribution of impacts. This is measured by the distribution of travel time savings along income groups. A Lorenz curve is plotted with the cumulative share of total trips ordered by income on the x-axis and the cumulative share of inverse previous travel times on the y-axis. Next, a Gini-index is calculated and the same is done for current travel times. This Gini-index represents the equality of the distribution of travel times along income, with positive values representing lower travel times for higher income groups and a positive value the reverse. The change in Gini-indices represents the equity impact. Safety is measured by the safety perception of respondents. The relative difference between current and previous safety perception characterizes the safety impact.
The environmental indicators are air pollution, climate change and modal shift. Air pollution concerns the reduction of CO, NOx and PM10 emissions. Current and previous emissions are
estimated using emission factors per trip differentiated per transport mode and the corresponding modal split within the zone of influence of the transit line. The relative change of each pollutant emission is then calculated and the average change represents the air pollution indicator. The climate change indicator is determined similarly, but only CO2 emissions are
included. The modal shift concerns the previous transport mode of passengers. Since the most interesting modal shift is from private vehicles, the summed modal shift from cars and taxis is considered.
income-Metro. Revenues are determined by multiplying the number of passengers by the fare, the fraction of passengers that is not exempt from the fare and the fraction of new passengers. To allow for comparison, construction costs, operating and maintenance costs and revenues are all expressed per kilometer of infrastructure.
The economic indicators are aggregated into a NPV and B/C ratio using a discount rate of 12% and project horizon of fifteen years. Furthermore, the VOT is increased along GDP growth. Also, a sensitivity analysis of the NPV is conducted in which the VOT is varied. Additionally, social, environmental and economic indicators are evaluated using the
flag model. This model uses critical threshold values (CTVs) to evaluate the performance of indicators. These CTVs are based on studies evaluating similar impacts. It is important to note that most studies only include direct impacts. A minimum, average and maximum CTV are calculated based on the average and standard deviation, see Table 1. For benefits, a green flag is attributed to indicators values above the maximum, an orange flag for values between the average and maximum, a red flag for values between the average and minimum and a black flag for values below the minimum. For costs, the reverse holds. Based on the CTVs, standardized values ranging between -2 and 2 are calculated. For each indicator group, the standardized values are averaged to determine the standardized outcome and corresponding flag.
The data for the ex-post evaluation was collected using surveys among passengers and other travelers within the zone of influence using a different transport mode. A total of 369 surveys among Metrobús passengers and 373 surveys among Metro passengers were conducted. Among the other travelers a total of 104 surveys for Metrobús and 78 surveys for Metro were conducted. The number of surveys among other travelers is lower because impacts were expected to be smaller. The passenger survey results were expanded according to boarding station and the surveys among other travelers were expanded according to transport mode.
RESULTS AND DISCUSSION
The equity improvement is 31.3% for Metrobús and 39.8% for Metro. Hence, equity impacts are larger for the Metro line. This difference is especially caused by larger direct impacts for the Metro. Furthermore, the values of the Gini-indices are close to zero, suggesting that the distribution of travel times over income groups is very equal. This means that travel times are distributed very evenly over income groups. Furthermore, even small changes in the distribution have significant impacts on the indicator value, so the results are very sensitive to inaccuracies. The direct and indirect safety impacts are larger for the Metrobús than the Metro. However, the total safety impact is larger for Metro (29.6%) than Metrobús (23.4%). This is because the fraction of Metrobús user trips represents only 9.7% of all trips within the zone of influence, while Metro user trips are 40.0% of all trips. Hence, the direct impacts have a more significant impact on the total impacts. Another noteworthy result is that the safety perception of Metrobús users is higher than the safety perception of Metro users. This is interesting, because generally MRT systems are considered safer than BRT systems, which still have conflicts with other traffic flows. A reason for the difference can be that respondents (subconsciously) included on-board
Indicator CTVmin CTV CTVmax
Safety 21.5% 34.9% 48.3%
Equity -0.1% 8.6% 17.3%
Air pollution -57.5% -39.2% -20.9%
Climate change -58.4% -42.0% -25.6%
Modal shift 7.8% 10.9% 14.0%
Travel time savings 19.8% 26.4% 33.8%
Construction costs (per km) $6.4M $46.2M $86.1M
Operating costs (per year per km) $1.1M $1.3M $1.5M
Revenues (per year per km) $0.5M $1.1M $1.7M
Both pollutant and CO2 emission reductions are higher for the Metro line (29.6% and 22.8%)
than the Metrobús line (12.3% and 4.9%). Also absolute emission reductions are significantly higher for the Metro line, representing around 0.3% of total transport emissions in Mexico City, compared to only 0.02% for Metrobús. This difference has three main causes. First of all, only mobile emissions are included so point emissions resulting from energy production for the Metro are excluded. Secondly, even though the modal shift from private vehicles is higher for Metrobús, the higher modal shift from low-capacity public transport has a larger impact on the results. Thirdly, the size of the modal shift is larger for Metro, because of the higher passenger numbers.
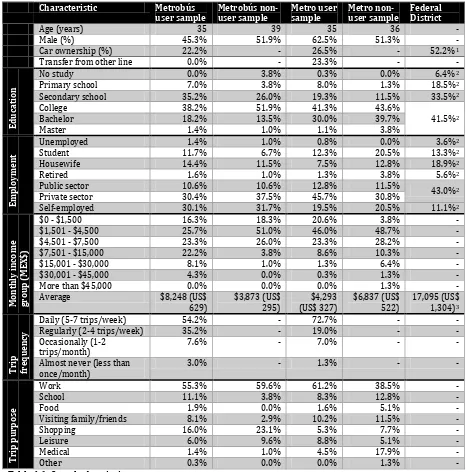
The modal shift from private modes is higher for Metrobús (14.3%) than Metro (7.5%). This is mainly caused by a difference in the taxi modal shift, which makes sense since the Metrobús line serves the airport and city center, two areas that typically have a higher taxi use. Furthermore, the average income of Metrobús passengers is almost double the average income of Metro users. Hence, passengers are more likely to be able to afford a taxi as alternative transport mode. This lower income also explains why the higher modal shift from low-capacity public transport is higher for Metro (63.7%) than Metrobús (40.5%). Furthermore, for the Metrobús line a high modal share from the Metro occurs (39.4%).
The travel time savings are shown in Table 2. Both in absolute and relative terms the travel time savings are larger for the Metro line than the Metrobús line. This is mainly because the fraction of users of the total population, which is much higher for the Metro line than the Metrobús line. Therefore, the higher direct travel time savings of the Metro have a larger impact on the total savings. Furthermore, average user travel times are significantly higher for the Metro, resulting in larger direct monetary impacts if the same relative impact is achieved. In fact, the relative direct travel time savings are larger for the Metrobús, but the larger number of travelers and higher absolute travel times results in higher monetized travel time savings for the Metro.
Transit line Daily trips TTS per
trip (min.) TTS Annual TTS (hrs.) Annual TTS (US$) Direct TTS Indirect TTS % Direct TTS of total
Metrobús 609,948 6.6 11.1% 19,463,945 $73,203,897 34.7% 9.1% 24.5%
Metro 1,343,717 15.9 21.7% 103,655,935 $389,849,970 27.1% 15.6% 66.6%
Table 2: Travel time savings.
Construction costs per kilometer are much higher for Metro (US$ 65.9 million) than Metrobús (US$ 1.5 million). This is not surprising since rail infrastructure is generally ten to a hundred times higher than BRT infrastructure. However, also compared to other BRT lines, the Metrobús is cheap. Since it is not a full BRT, significant savings were made. The Metro line is less expensive than the average of other MRT lines. However, most of these MRT lines are located in developed countries, where labor costs and thus construction costs are higher. Operating and maintenance costs are also much higher for Metro (US$ 1.7 million per kilometer per year) than Metrobús (US$ 178,380 per kilometer per year. Operating and maintenance costs per passenger are more similar; US$ 0.28 for Metrobús and US$ 0.30 for Metro. These costs are also below the ticket price. However, overhead costs of the system’s organization are not taken into account. Revenues are higher for Metro (US$ 2.0 million per kilometer per year) than Metrobús (US$ 267,992 per kilometer per year). This is not surprising since daily ridership is over ten times higher. Furthermore, these revenues are higher than the operating costs, indicating an operating profit.
the two lines is solid, because this affects the evaluation of both lines equally.
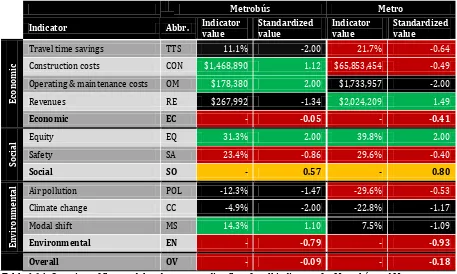
Metrobús Metro
Indicator Abbr. Indicator value Standardized value Indicator value Standardized value
Ec
on
om
ic
Travel time savings TTS 11.1% -2.00 21.7% -0.64
Construction costs CON $1,468,890 1.12 $65,853,454 -0.49
Operating & maintenance costs OM $178,380 2.00 $1,733,957 -2.00
Revenues RE $267,992 -1.34 $2,024,209 1.49
Economic EC - -0.05 - -0.41
So
ci
al Equity EQ 31.3% 2.00 39.8% 2.00
Safety SA 23.4% -0.86 29.6% -0.40
Social SO - 0.57 - 0.80
En
vi
ro
nm
en
ta
l Air pollution POL -12.3% -1.47 -29.6% -0.53
Climate change CC -4.9% -2.00 -22.8% -1.17
Modal shift MS 14.3% 1.10 7.5% -1.09
Environmental EN - -0.79 - -0.93
Overall OV - -0.09 - -0.18
Table 3: Overview of flag model and corresponding flags for all indicators for Metrobús and Metro.
Aggregation of economic indicators shows a NPV of US$ 541 million and a B/C ratio of 8.48 for Metrobús, compared to a NPV of US$ 1.4 billion and B/C ratio of 1.77 for Metro. Hence, the Metro line is more profitable, while the Metrobús line has a higher economic efficiency. For the Metro, this profitability mainly depends on travel time savings, since discounted construction, operating and maintenance costs and revenues accrue to US$ 1.6 billion, compared to only US$ -25 million for Metrobús. A sensitivity analysis of the VOT confirms this, since it reveals that the profitability of the Metro depends heavily on the VOT, while the Metrobús line is profitable for low values as well. Hence, the profitability of the Metro is uncertain. The Metrobús line, on the other hand, is profitable irrespective of the VOT.
CONCLUSIONS AND RECOMMENDATIONS
This study ex-post evaluated Mexico City’s fourth Metrobús line and twelfth Metro line using nine indicators. The results show that the Metro has higher impacts for the equity, safety, air pollution, climate change, travel time savings and revenues indicators. Meanwhile, the Metrobús performs superior for construction costs, operating and maintenance costs and modal shift. Indicator aggregation indicates that both lines perform similarly, but the Metro is better for social indicators and the Metrobús for economic and environmental indicators. Furthermore, the Metrobús has a higher economic efficiency, while both projects are profitable.
This Master thesis marks the end of my graduation process, my time as a student at the University of Twente and an amazing period in my life. In this time I have found many great friendships, developed myself as a person and had the opportunity to travel to many interesting places. The prospect to conduct my research in Mexico has truly been incredible and has provided me great insights in the Mexican way of life. This has made my graduation process an unforgettable experience. I could not have completed this thesis without the help and support of many people. I would like to take this opportunity to thank them.
First of all, my gratitude goes to my supervising committee, consisting of Karst Geurs and Lissy La Paix Puello. Karst Geurs has especially provided great help in the first stages of my research, helping me to give a direction to my research and by restricting the size of my research. Also his feedback on later versions has helped me improve my thesis. Lissy La Paix Puello has provided me useful assistance during the entire process of my thesis and has specifically provided help with the indicator aggregation. All of this she did despite sometimes being away on holiday or travelling.
At CTS Embarq México I first of all want to wholeheartedly thank Erick Morales for all his help, particularly with setting up the surveys and interviews. Despite bureaucratic drawbacks, he persevered in ensuring arrangements were made. I also owe a huge thanks to Abel López Dodero for helping me with my research proposal and providing me with valuable literature on the Mexican context. I would like to express my gratitude to Fernando Paez and Adriana Lobo for the opportunity to stay at respectively his department and her company. Thanks also go to Alejandro López for exporting my surveys to tablets and José Juan Hernández and Aldo Cerezo Cazares for providing great insights in Mexico City’s transport systems in general and the Metrobús in specific. Everyone else at CTS Embarq México: thanks for the great lunch breaks, insightful talks and making me feel at home at the office and in Mexico!
I would like to thank Adán, Natali and Brenda for helping me conduct the survey. Furthermore, my gratitude goes to Emelina Nava for her interview, which provided great insights in the transport system in Mexico City. My gratitude also goes to Onésimo Flores for his vision on Mexican transport, especially in the evolution of the transport system. At the Metrobús, my thanks go to Félix Santiago and Gonzalo García Miaja for showing me the whole Metrobús system and its operation and resolving any doubts I had about how the system functions.
My thanks also go to Diego, Juan, Susana, Lila, Chris and Gwen for the great time in Mexico City outside of working hours. They have been great roommates, provided an amazing place to live in Mexico City and helped me take my mind of my work and enjoy Mexico. Also, they have provided a great help in practicing and improving my Spanish.
Chapter 1. Introduction ... 1
1.1 Background ... 1
1.2 Research purpose ... 2
1.3 Reading guide ... 3
Chapter 2. Research design... 5
2.1 Scope of research ... 5
2.2 Research objective ... 5
2.3 Research questions ... 6
2.4 Research methodology ... 7
Chapter 3. Theoretical framework... 9
3.1 Sustainable transport and transport planning ... 9
3.2 Cost-benefit analysis... 12
3.3 Ex-post evaluation ... 14
3.4 Indicators ... 16
3.5 Evaluation criteria ... 19
3.6 Survey design ... 23
3.7 Conclusions ... 26
Chapter 4. Sustainability and transportation in Mexico ... 27
4.1 Mexico ... 27
4.2 Mexico City ... 28
4.3 Metro ... 33
4.4 Metrobús ... 35
4.5 Conclusions ... 37
Chapter 5. Methodology ... 39
5.1 Evaluation framework ... 39
5.2 Indicator selection ... 42
5.3 Data collection ... 44
5.4 Indicator calculation methods ... 49
5.5 Indicator aggregation ... 58
5.6 Sensitivity analysis ... 61
Chapter 6. Results ... 63
6.1 Sample description ... 63
6.2 Social indicators ... 65
6.3 Environmental indicators ... 67
6.6 Sensitivity analysis ... 75
6.7 Interviews ... 78
6.8 Conclusions ... 81
Chapter 7. Discussion ... 83
7.1 Individual indicators ... 83
7.2 Aggregated indicators ... 93
7.3 Sensitivity analysis ... 99
7.4 Political context ... 103
7.5 Research limitations ... 106
Chapter 8. Conclusions and recommendations ... 111
8.1 Conclusions ... 111
8.2 Limitations ... 113
8.3 Recommendations ... 114
References ... 115
Appendix
Appendix A Location of poorest and least poor boroughs ... A-1 Appendix B Gini-index per borough ... A-2 Appendix C Pollutant distribution in MCMA ... A-3 Appendix D PM10 concentrations in Mexico City ... A-4
Figure 2-1: Research model. ... 8 Figure 3-1: Policy cycle (HM Treasury, 2003). ... 11 Figure 4-1: Poverty (yellow), extreme poverty (red), vulnerability for income (orange) and social deprivation (blue) and non-poor and non-vulnerability (green) per Mexican state (CONEVAL, 2012b). ... 29 Figure 5-1: Gini-index illustration with Lorenz curve and equal distribution line (Wee and Geurs, 2011). ... 50 Figure 6-1: Comparison of standardized values of indicators for Metrobús and Metro. ... 72
Appendix
Figure A-1: Location of Federal District's boroughs with highest poverty (CONEVAL, 2012a). .. A-1 Figure A-2: Location of Federal District's boroughs with least poverty (CONEVAL, 2012a). ... A-1 Figure A-3: Gini-index per borough of the Federal District (CONEVAL, 2012a). ... A-2 Figure A-4: Schematic depiction of the concentration of pollutants during the day in MCMA (Comisión Ambiental Metropolitana, 2011). ... A-3 Figure A-5: Distribution of PM10 concentrations in the MCMA (Comisión Ambiental
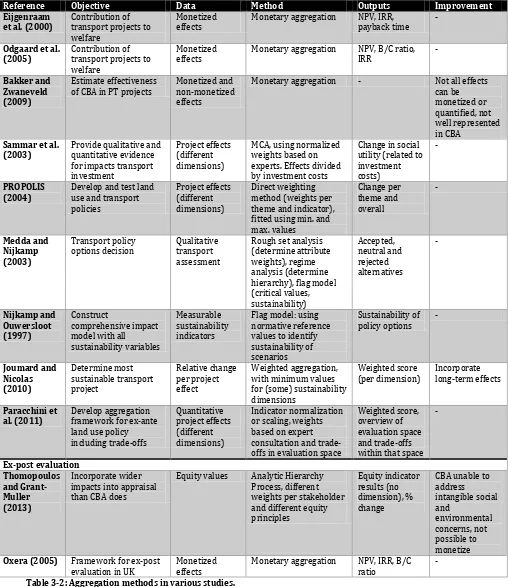
Table 3-1: Possible indicators for the ex-post evaluation, based on literature. ... 17 Table 3-2: Aggregation methods in various studies. ... 23 Table 4-1: Monthly household income per income decile (INEGI, 2012)... 27 Table 4-2: Overview of population, poverty and number of trips per borough of the Federal District. ... 29 Table 4-3: Monthly household income per income decile for MCMA (INEGI, 2012). ... 30 Table 4-4: Information on employment and education in Federal District, Estado de México and MCMA (INEGI, 2013a). ... 30 Table 4-5: Emissions per day of the week in the MCMA (Comisión Ambiental Metropolitana, 2011). ... 31 Table 4-6: Car ownership per household per income group (Ciudad de México, 2007). ... 32 Table 4-7: Emissions per transport type (Comisión Ambiental Metropolitana, 2011) and modal split (Ciudad de México, 2007). ... 32 Table 4-8: Properties of Metro lines. ... 34 Table 5-1: Indicators used in research, grouped in social, economic and environmental dimensions. ... 44 Table 5-2: Overview of data collection methods, what data is collected and for which indicators data is useful. ... 46 Table 5-3: Survey wish list. ... 47 Table 5-4: Emission factors per transport mode and emission. ... 52 Table 5-5: Value of time per income group. ... 54 Table 5-6: Range of indicator values found in literature. ... 59 Table 5-7: CTVmin, CTV and CTVmax per indicator. ... 60
This chapter provides an introduction to the research topic. First, a concise background of the problem addressed is given. From this background follows the purpose of this research. Finally, a reading guide is provided. This reading guide helps readers to find the parts of this thesis that are of main interest to them.
1.1
BACKGROUND
Since 2010 over half of the world’s population is living in urban areas. Urbanization is still increasing, especially in developing countries, where large numbers of people move to cities to find income opportunities. As a result, 70% of the world’s population is expected to live in urban areas by 2050. Additionally, developing countries are becoming increasingly motorized. The expanding urban population and motorization cause congestion problems in rapidly expanding cities (UN-Habitat, 2012). These trends significantly affect the livability of cities, manifesting especially in social segregation, environmental deprivation, economic inequalities and productivity losses. The concept of sustainable development focuses on overcoming these issues. The essence of this concept is that present needs are met without compromising the ability to meet future needs. This is done by focusing on the interaction between environmental, social and economic aspects in (policy) development. (WCED, 1987).
One of the major environmental concerns is the effect of climate change on the way of everyday life. Increasing greenhouse gas (GHG) emissions, of which carbon dioxide (CO2) is the most
important, are expected to result in rising sea levels and more extreme weather patterns (increased drought and heavier precipitation), among other effects (UN-Habitat, 2012). The majority of these emissions is caused by the most developed countries. Ironically, especially developing countries are prone to the effects, because of vulnerable locations of cities and limited adaptive capabilities (UN-Habitat, 2011). The transportation sector is responsible for approximately 22.3% of total CO2 emissions, of which 73.6% is emitted by road transport.
Meanwhile, fuel demand is increasing and emissions are expected to keep rising (IEA, 2012). Even in optimistic scenarios, which incorporate major mitigation policies, transport’s CO2
emissions are expected to increase by 40% between 2007 and 2030 (ITF, 2010). Simultaneously, transport is responsible for the emission of harmful pollutant gases, such as carbon monoxide (CO) and particulate matter (PM), which is mainly evident in large metropolises (UN-Habitat, 2012).
This development is aggravated by massive migration to cities, which cannot accommodate the large influx of new citizens, forcing many of them to reside in slums in the outskirts of large metropolises. Such slums lack access to many essential amenities, such as water, education, healthcare and employment and transport opportunities (OECD, 2011a). This lack of opportunities results in large (income) inequalities, which especially manifest in urban areas in less developed countries (OECD, 2011b). Urbanization also causes transport demand to increase enormously, while infrastructure provisions often lag, particularly in developing countries. Consequently, congestion is a major problem, with much time lost in traffic, impeding economic efficiency and development (UN-Habitat, 2012).
Such mass transit systems have the potential to mitigate congestion by providing a more efficient movement of people than private vehicles and informal public transport. Mass Rapid Transit (MRT) has traditionally been the most popular mass transit mode. Particularly (Western) European, North American and Asian cities have implemented such systems. However, high capital investments hinder implementation in developing countries. To overcome these affordability issues for mass transit solutions, Curitiba (Brazil) introduced the Bus Rapid Transit (BRT) system in 1974 (Wright and Hook, 2007). Bogotá’s TransMilenio mimicked this system in 2000 and henceforth many, mainly Latin American, cities have followed suit. The World Bank recommends BRT as appropriate infrastructure for developing countries (Timilsina and Dulal, 2011). Capacities of full BRT systems approach those of MRT systems, while capital investments are ten to a hundred times lower (Wright and Hook, 2007). Furthermore, BRT provides more flexible and short-term solutions to congestion problems (Deng and Nelson, 2013). Nonetheless, BRT is still considered a second-hand alternative to MRT, particularly because BRT utilizes scarce road space otherwise dedicated to cars (Hidalgo and Gutiérrez, 2013).
1.2
RESEARCH PURPOSE
One of the reasons that ambiguity about the effectiveness of BRT and MRT persists is that effects of BRT and MRT systems have only been researched minimally. Many studies evaluate one or a couple effects, but few conduct an extensive evaluation incorporating a wide range of effects. For example, Keeling (2013) suggests research is required on the economic impacts of BRT. Furthermore, projects are regularly appraised ex-ante, but ex-post evaluations are rarely carried out (Knudsen and Rich, 2013). Nevertheless, ex-post evaluations are an important part of successful policy implementation (HM Treasury, 2003). In developing countries the lack of ex-post evaluations is even more evident, while ex-ante appraisal is often only carried out once a project has already been planned.
Problems within transport evaluation also persevere. Cost-benefit analyses (CBAs) have a financial approach and only evaluate projects on their economic performance, monetizing all effects. However, it is difficult to put a price on environmental and social impacts (Mouter et al., 2013). Furthermore, distributive effects are often completely left out (Mouter, 2012). Additionally, due to the utilitarian approach of CBA, high-income groups are more influential on results than low-income groups (Wee, 2011). As a result of these limitations, CBAs can have a positive outcome, even though only a small minority benefits. Also ex-post evaluations are not without methodological drawbacks. The major drawback is the causality, because not all observed effects are necessarily the result of the project. Hence, it is uncertain which effects are endogenous and which are exogenous (Berveling et al., 2009). This directly relates to the second issue, which is the evaluation timing, since short-term evaluations limit the causality problems, while long-term evaluations are preferable because effects are better observable (Annema et al., 2012). Short-term evaluations are conducted within one to two years after implementation and include effects such as travel time savings, whereas long-term evaluations are conducted after approximately ten years and focus on other impacts such as land use effects.
incorporates all three concepts of sustainability. This framework is useful to compare the impacts of BRT and MRT systems. However, the research does not aim to definitively settle the debate between BRT and MRT systems. Nonetheless, the research can provide insights in the performance of both systems and how this performance differs. Furthermore, it provides a first ex-post evaluation that incorporates both BRT and MRT systems.
1.3
READING GUIDE
This thesis is divided into eight chapters. After this first introductory chapter, the second chapter discusses the research design. This chapter introduces the research objective and explains what this research aims to accomplish. In order to clearly outline the research, several research questions are formulated. Finally, this chapter elaborates on the research methodology that is applied in the rest of this thesis.
The third and fourth chapters provide an overview of the literature that was studied for this research. The third chapter regards the theoretical framework that is used to develop the research methodology. This literature review focuses on ex-ante appraisal and ex-post evaluation methods and the problems encountered in their application. Furthermore, information is given on indicators used in other studies, and how these indicators are evaluated and aggregated. Finally, this chapter offers some insights in the theory of survey design. The fourth chapter focuses on sustainability and transportation in Mexico in general and Mexico City in specific. Also, Mexico City’s MRT system and BRT system are introduced, putting a distinct focus on the two transit lines that are evaluated in this study. These two chapters are of particular interest to gain insights in the background of the issues addressed in this study.
Chapter five regards the methodology of this research. This chapter outlines the evaluation framework that is applied to evaluate the BRT and MRT lines. Furthermore, the indicators used within the framework are selected and the techniques used to calculate these are elaborated on. Additionally, the aggregation method and sensitivity analysis is explained. Finally, this chapter discusses how the required data is collected. This chapter is especially interesting to gain insights in how the results were achieved.
The results from the application of the methodology are presented in chapter six. This chapter merely describes the results and does not discuss its implications. All indicators are presented individually, but this chapter also provides the results of the indicator aggregation, as well as the main findings from the interviews. Chapter seven interprets the results presented in chapter six. This chapter relates the individual indicator performance to values found in literature. Furthermore, individual indicators of the BRT and MRT line are compared and discussed. Additionally, the aggregated indicators are compared. Based on this, a conclusion can be drawn on which of the systems performs better in general and in which area specifically. This chapter also compares the performance of both lines to the initial policy objectives and Mexico City’s political context. Finally, some limitations of the research are discussed. These two chapters are of particular interest for readers that are interested in the outcomes of the research.
The introduction gave the rationale for this research. This chapter discusses how this research is designed. First, the scope of the research is addressed, focusing especially on the location of the case study. Secondly, the research objective is set. Based on this research objective, several research questions and corresponding sub-questions are defined. Finally, the research methodology to answer these questions and to achieve the research objective is elaborated on.
2.1
SCOPE OF RESEARCH
The introduction shows that transport project evaluation is conducted on a regular basis. However, most research focuses on ante appraisal and monetary evaluations. Meanwhile, ex-post evaluations are carried out minimally and especially social indicators focusing on distributional effects are often disregarded. Furthermore, for developing countries, BRT and MRT systems are the two main mass transit solutions. This research therefore focuses on ex-post evaluating a MRT and a BRT line, in a developing country context. For this purpose, Mexico City has been selected as the location of the case study. This city has been selected because it has a MRT system, the Metro, and a BRT system, the Metrobús. Also, for both systems new lines have recently been implemented. Besides, Keeling (2013) suggests that additional research on mobility is required for megacities, such as Mexico City, particularly since poorer segments of the population are concentrated in distant suburbs. This makes Mexico City a suitable location to test the ex-post evaluation framework developed in this research.
An important aspect of the evaluation is to select suitable transport lines. New Metrobús lines were implemented in 2005, 2008, 2011, 2012 and 2013 (ALC-BRT and EMBARQ, 2013). Since ex-post evaluation should typically take place one to five years after implementation (see section 3.3.1), only the third and fourth Metrobús lines comply. For a relatively new system not all effects may yet be attained. On the other hand, the later the evaluation is conducted, the more exogenous effects distort the analysis and causality issues occur. This latter problem is considered more troublesome for the analysis, which is why Metrobús line four is selected for the BRT evaluation. Mexico City’s Metro has only expanded by one line since 1999; in 2012 the twelfth metro line was completed (Ciudad de México, 2013a). Hence, this is the only suitable Metro line to analyze, because exogenous effects are too large for other lines. Metro line twelve runs from south of the city center to the southeast of the city.
2.2
RESEARCH OBJECTIVE
Based on the introduction and the scope of the research, the following research objective is defined:
Develop and apply an ex-post evaluation framework to assess and compare the impacts of BRT and MRT systems in Mexico
2.3
RESEARCH QUESTIONS
In order to achieve the research objective, several research questions need to be answered. The research questions and a brief explanation are given below.
1. How are impacts of transport projects evaluated?
This research question mainly consists of a literature study on current practice in appraisal and evaluation methodologies in different contexts. Part of the study focuses on cost-benefit analyses (CBAs), but ex-post evaluations are addressed as well. The focus is on the evaluation of transport projects, and a range of countries where these are applied is discussed. Also, the experience with the application of these methods is interesting, because this provides insights in problems that are encountered. If problems are encountered repeatedly, this information can be used to adapt the framework to overcome these issues.
The main goal of this research question is to gain insights in the type of indicators that are used in transport project appraisal. This is used as input for the development of the framework that will be applied to Mexico City. Furthermore, the incorporation of different locations will yield comprehension of which indicators are applicable in which situation. For example, one can expect equality indicators to be of higher importance in cities with great income disparities, but less so in cities where incomes are already relatively equal. Additionally, the problems identified are used to adjust the framework for this research. For example, literature may indicate that certain indicators are often left out, difficult to measure, contain large uncertainties etc. Also the way indicators are quantified is investigated, especially focusing on if and how indicators are monetized. Finally, the way in which indicators are aggregated is studied. Chapter three provides an overview of the literature on transport project evaluation.
Sub-questions:
a) Where are appraisal and evaluation methodologies applied for transport projects?
b) How are these methodologies executed?
c) What problems are encountered in these methodologies?
d) Which indicators are included in the appraisal and evaluation of transport projects?
e) What methods are applied to aggregate indicators?
2. How can the impacts of Mexico City’s Metro and Metrobús be evaluated?
The main goal of this research question is to develop the evaluation framework. First of all, the political context of Mexico City is investigated. This concerns both sustainability policies and the transport system in general. Based on the previous research question a suitable evaluation framework for Mexico City can be developed. This comprises a description of underlying assumptions of the framework and the evaluation steps. Furthermore, a suitable set of indicators for this framework is selected. The relevance of indicators for the case of Mexico City, based on the first sub-question, is taken into consideration for this. For example, social indicators may be more important in Mexico than in the Netherlands. How these indicators are evaluated is also part of this research question. Additionally, the necessity of monetizing indicators is discussed. Finally, this research question includes the aggregation of the individual indicators. Chapter four discusses the Mexican context and chapter five the evaluation framework that is applied to Mexico City.
Sub-questions:
c) Which indicators are used in the evaluation framework? d) How are these indicators evaluated?
e) How is the data required for the evaluation collected? f) How are the indicators aggregated?
3. What are the outcomes of the evaluation of Mexico City’s Metrobús and Metro?
The application of the evaluation framework developed in the previous question results in the outcomes of the evaluation. These outcomes are both given per individual indicator, but also for the aggregated indicators. The latter provides a more general overview of the impacts of the transit line. Furthermore, the outcomes are compared to the values that were expected beforehand. These expectations are based on the effects found in other literature studying the effects of transport projects. Chapter six elaborates on the outcomes of the evaluation framework.
Sub-questions:
a) What are the outcomes of the individual indicators? b) What are the outcomes of the aggregated indicators? c) How do these outcomes compare to expected values?
4. How do the outcomes of the Metrobús and Metro compare?
This research question compares the outcomes of the Metrobús line and the Metro line. This can contribute to the academic discussion on the effectiveness of the two transit systems. It is interesting to discuss for which indicators both systems perform similarly and for which differences exist. This is also discussed on an aggregated level. The aim of this research question is not only to compare the outcomes, but also to pinpoint specific differences in performance. This gives insights in which of the two systems can be best implemented in which case. A comparison of the outcomes with the policy objectives set before implementation is also made. This evaluates if initial expectations have been meet. Finally, a comparison with the expected performance by policy makers is made. This gives insights if they have the correct view of the transit line’s impacts. Chapter seven discusses these comparisons.
Sub-questions:
a) How do the individual indicators compare?
b) On an aggregated level, how do the Metrobús and Metro line compare? c) Which transport system is preferable for which policy objective? d) Does the performance meet the policy objectives of the transit lines? e) How does this compare to the expected performance by policy makers?
2.4
RESEARCH METHODOLOGY
evaluation framework developed. This part aims at answering the two final research questions and all its sub-questions.
This chapter discusses the relevant literature for the research. The focus is on methodologies to evaluate the performance of transport systems. First of all, relevant principles of sustainable transport and transport planning are explained. Secondly, an overview of a popular ex-ante appraisal methodology is discussed: cost-benefit analysis. Thirdly, ex-post analysis methodologies are addressed. Fourth, the indicators for appraisal frameworks that are used in the previously discussed methodologies are identified. Fifth, the criteria used for transport evaluation are mentioned. Sixth, a brief introduction is given on how a survey can be designed effectively. Finally, based on the literature review some conclusions that are useful for the methodology chapter are given.
3.1
SUSTAINABLE TRANSPORT AND TRANSPORT PLANNING
This section discusses basic principles of sustainable transport and transport planning. First of all, some literature on sustainable development is discussed. Secondly, a more distinct focus is put on sustainable transport. Finally, public transport in developing countries is addressed.
3.1.1
SUSTAINABLE DEVELOPMENT
The concept of sustainable transport is strongly intertwined with sustainable development, which provides a more general description. This was thoroughly studied by the Brundtland Commission. This UN Commission studied the effects humanity has on its environment and has set guidelines on how to address this issue. They defined the concept of sustainable development as follows:
“Sustainable development is development that meets the needs of the present without compromising the ability of future generations to meet their own needs. It contains within it two key concepts:
• the concept of 'needs', in particular the essential needs of the world's poor, to which overriding priority should be given; and
• the idea of limitations imposed by the state of technology and social organization on the environment's ability to meet present and future need.” (WCED, 1987, p. 41)
This definition highlights that sustainability does not only refer to environmental goals, but should put a distinct focus on environmental, social and economic issues and the interaction between the three (WCED, 1987). Hence, effects should always be discussed in harmony, since positive economic effects may impair the environment’s ability to meet future generations’ needs, or vice versa.
In terms of environmental sustainability, climate change is an issue increasingly recognized in academic literature. Especially the use of fossil fuels is of growing concern, with World resources depleting and demand increasing; it is expected that by 2035 fuel demand has increased 40% (IEA, 2012). Besides fuel scarcity, global CO2 emissions resulting from fuel combustion pose
serious threats through climate change. Current estimations predict CO2 emissions to keep
rising, even if abatement strategies are incorporated in the models. The two main contributors to CO2 emissions are the electricity and heat sector and the transport sector, responsible for
respectively 41% and 22.3% of global CO2 emissions. Of the latter, 73.6% is caused by road
transport (IEA, 2012). Even when major mitigation policies are included, predictions still estimate an increase of 40% in transport CO2 emissions between 2007 and 2030 (ITF, 2010). To
Climate change has severe impacts on livability, with expected impacts including, among others, warmer and more frequent hot days, rising sea levels, a higher frequency of heat spells and a higher frequency of heavy precipitation, but also more areas being affected by drought (UN-Habitat, 2011). This is especially troublesome for developing countries, as many of their cities are located in areas prone to flooding, droughts or on the coast, while the majority of CO2
emissions originate from developed, rich countries. Furthermore, high incomes are deemed to have greater adaptive capabilities to changes imposed by climate change (UN-Habitat, 2011). Meanwhile, today’s world is urbanizing rapidly; in 2010 for the first time over half of the World’s population resided in urban areas. This figure is expected to rise to 70% by the middle of this century (UN-Habitat, 2012). Especially emerging economies (EEs) and non-OECD countries in Latin America, Asia and Africa face large numbers of people moving to cities in the hope of finding income opportunities. Of these, Latin America is most urbanized, with 80% of the population living in urban areas, which is expected to increase to 87% by 2050 (UN-Habitat, 2012). This causes many social issues, since many people migrating to cities are forced to reside in slums in the outskirts of large metropolises, due to a lack of institutional provisions of housing security. These inhabitants lack sufficient access to (among others) water, education, healthcare, employment and transport opportunities. Consequently, social exclusion may occur. This results in income inequalities, which as a trend are still rising in OECD countries, with the Gini-index increasing from 0.29 in the mid-1980s to 0.32 in the late 2000s (OECD, 2011a). In emerging economies these income inequalities are significantly higher, which is mainly due to the informal sector, a lack of access to proper education and barriers for women. These inequalities mainly manifest in urban areas (OECD, 2011b).
Prosperity analyses show that to improve prosperity these inequities require more attention in urban decision making (UN-Habitat, 2012). Besides the aforementioned environmental sustainability and social inclusion, productivity, infrastructure and quality of life are other determinants of a city’s prosperity. A study by UN-Habitat (2012) shows that in Latin American cities the focus should mainly be on productivity, generating local jobs, improving transport infrastructure, improving living conditions and reducing inequalities, while simultaneously protecting the environment. Cities can utilize their full productivity potential if barriers are decreased. This is mainly achieved by reducing traffic congestion, enhancing mass transit and providing efficient and reliable transport services (UN-Habitat, 2012).
3.1.2
SUSTAINABLE TRANSPORT
Besides urbanization issues, motorization is causing congestion problems in ever-expanding cities. Motorization in Latin America is highest for the developing world, at 169 cars owned per 1000 inhabitants in 2008, a figure which is expected to continue to increase (UN-Habitat, 2012). However, motorization trends in developing countries differ significantly from developed countries. Sperling and Claussen (2002) note that especially two-wheeler’ numbers are increasing rapidly. This is particularly evident in Asia, but is also spreading to Latin America and Africa. These two-wheelers provide a cheap and affordable alternative to a car, because they are better navigable on crowded streets and cost only a fraction in purchase price. This private vehicle ownership is further stimulated due to competition within the public transport market, with various types of public transport competing over customers, instead of competing with private modes (Ardila, 2012).
from traffic accidents and a limited number of services accessible (World Bank, 2002). Hence, a shift is required from conventional transport planning to sustainable transport planning. Such a change involves focusing on accessibility instead of mobility, a people focus instead of traffic focus and from economic evaluation towards multi criteria analysis also including social and environmental impacts (Banister, 2008). To promote such sustainable transport planning, Leather (2009) proposes the avoid-shift-improve approach. The avoid approach regards the avoidance of travel by limiting the need to travel. The shift approach concerns shifting travel to the most sustainable transportation mode. The improve approach aims at reducing emissions through technological advancement. Many public transport policies intend to induce a shift from private modes (taxi, car, motorcycle) to public modes.
In order to effectively implement transport policies, HM Treasury (2003) has developed a policy cycle for transport planning (see Figure 3-1). This policy cycle consists of six steps: the rationale, formulation of objectives, appraisal, monitoring, evaluation and feedback. The last two steps take place after the implementation phase. HM Treasury (2003) notes that for large or on-going projects an ex-post evaluation is most important. This information can provide important feedback for future project development, a wider policy debate and improvement of ex-ante appraisals. However, Berveling et al. (2009) note that policy makers often only focus on ex-ante appraisal and do not conduct an ex-post evaluation. This means that important information that can be obtained from ex-post evaluation is not acquired.
3.1.3
PUBLIC TRANSPORT IN DEVELOPING COUNTRIES
Developing countries only have limited government regulation regarding public transport, despite the relevance of public transport for economic growth, poverty alleviation, safety and air pollution reduction. Often, governments do not impose entry barriers on the transport market, which results in many privately-owned vehicles offering transport services. These are often small vehicles such as minivans because they are easier to navigate (Ardila, 2012). However, this results in unsafe services, old and polluting vehicles, overcrowding and competition for customers. Nonetheless, use is high, because of the high frequency and coverage they offer, essentially providing door-to-door transport (Cervero and Golub, 2007).
This informal transport poses several problems, because an oversupply can cause inflated fares (Ardila, 2012). As a result, public transport often constitutes a large part of daily expenditure of users (Coorporación Andina de Fomento, 2009). Also, if more-organized, high-capacity transit systems are proposed, these existing bus operators often fear for their jobs and oppose all plans. Hence, it is necessary to involve existing bus operators in the planning process and restructure the public transport organization in such a way that existing bus operators can complement rather than compete with new public transport systems (Hidalgo and Carrigan, 2010). However, Sperling and Claussen (2002) indicate that in developing countries a lack of political commitment and public resources often limit the possibilities to tackle this problem. This makes it difficult to achieve radical changes to improve the efficiency of the public transport system. Nonetheless, some mass transit solutions have been successfully implemented in developing countries (Wright and Hook, 2007).
Mass transit systems have typically been implemented in the form of Mass Rapid Transit systems. MRT has been a popular way to provide high capacity urban public transit in many European, North American and Asian cities. However, high capital investments make such transport options unaffordable for many developing countries. In order to provide citizens with rapid transit operations without spending large sums of money, Curitiba (Brazil) introduced the Bus Rapid Transit system in 1974 (Wright and Hook, 2007). Since the implementation of Bogotá’s TransMilenio BRT system in 2000, many other cities have followed suit, regarding BRT as a viable alternative to MRT and Light Rail Transit (LRT) systems. The World Bank has recommended BRT as appropriate infrastructure for developing countries due to significant impacts on externalities and successful implementation in many contexts (Timilsina and Dulal, 2011). Wright and Hook (2007) have published a BRT planning guide, defining BRT as a high-quality bus-based transit system that delivers fast, comfortable and cost-effective urban mobility through the provision of segregated right-of-way infrastructure with rapid and frequent operations. BRT capacities can, if implemented correctly, rival capacities of MRT systems, with capital investments ten to one hundred times lower (Wright and Hook, 2007). Meanwhile, BRT construction times are significantly shorter, providing short-term solutions to congestion problems as well as more flexible infrastructure to accommodate changing travel patterns (Deng and Nelson, 2013). Despite BRT’s recent success, especially in Latin America, it is often still considered a second-hand alternative to rail options, such as LRT and MRT (Hidalgo and Gutiérrez, 2013). Hidalgo and Gutiérrez (2013) highlight that this is often caused by car users’ perception of BRT taking up scarce space and claim that road capacity is reduced.
Public transport is often regarded as a transport mode for the poor. As a result, the affordability of public transport is often a point of discussion. Serebrisky et al. (2009) study the issue of affordability and public transport subsidies. Such subsidies often have two purposes: increase the use of public transport and improve the affordability, especially for the poor. Several types of subsidies exist, such as concessionary fares (free or discounted fares for certain groups), a flat fare structure (subsidizing longer journeys), infrastructure grants (government pays for construction costs of infrastructure) and quality self-selection (low incomes use lower quality and cheaper public transport and high incomes higher quality and more expensive public transport). However, Serebrisky et al. (2009) note that often transport subsidies are regressive and that focusing on inferior or necessity goods would be more effective. Often, this is because accessibility problems limit the effectiveness of transport subsidies.
3.2
COST-BENEFIT ANALYSIS
For some time, cost-benefit analysis has been a popular method to appraise the impacts of transport projects. Cost-benefit analysis is an ex-ante appraisal methodology applied regularly for transport project appraisal and is used frequently in the decision making process. CBA focuses on expressing a project’s effects in monetary terms, so all effects are expressed in the same dimension. This way, effects can easily be summed and compared. Odgaard et al. (2005) provide an overview of the use of CBAs in project appraisal in Europe. This report shows that great differences exist between EU members. The Netherlands, for example, have a thorough framework for CBAs, while many EU members in Eastern Europe mainly apply CBAs because this is a requirement for EU funding. This section briefly discusses the CBA methodology, which is followed by an account of the major problems associated with CBA practice.
3.2.1
METHODOLOGY
transport project. The effects that are used in CBA (and other evaluation methodologies) are elaborated on in section 3.4. These effects are classified as costs (e.g. construction costs) and benefits (e.g. travel time savings) and can cover a broad scope (which is why sometimes the term social cost-benefit analysis is used). An important part of CBA is to prevent that effects are counted twice and thereby overrepresented in the outcome. What makes CBA specific is that all effects are quantified and monetized. The latter is often done using a shadow pricing methodology, such as the value of time. This way, all costs and benefits can be summed giving a single net present value (NPV) of each project alternative. Other evaluation criteria also exist, which are discussed in section 3.5. Often, CBA is a mandatory element in the decision making process (Eijgenraam et al., 2000).
The steps required to conduct a CBA are identified by Eijgenraam et al. (2000):
I. Problem analysis: this step focuses on the formulation of the problem and setting project goals, as well as the constraints imposed on the project (e.g. environmental targets); II. Project definition: this step focuses on constructing several project alternatives, including
a null alternative or reference scenario (no project developed);
III. Identification of project effects; the effects of the various project alternatives are identified (e.g. direct, indirect and external effects);
IV. Estimation of relevant exogenous effects; this step estimates the effects of the project surroundings on the project alternatives (e.g. national or global economic developments);
V. Estimation and valuation of project effects; the project effects identified in step III are estimated in this step (e.g. amount of travel time saved due to project);
VI. Estimation of investment and exploitation costs; all costs associated with the construction of the project alternatives are estimated;
VII. Compose the cost-benefit overview; in this step the previously estimated costs and benefits are compared to show the economic and social effects of the project alternatives (e.g. the net present value);
VIII. Alternatives and risk analysis; due to the risks and uncertainties associated with ex-ante analyses, in many of the previous steps these risks should be incorporated;
IX. Additional tasks; although the CBA is complete after the previous steps, additional tasks can include links to Public Private Partnerships and ex-post project evaluations.
Ramirez Soberanis (2010) also describes the steps used for CBAs in the Mexican transport sector, where CBAs are a legal obligation to access public funds. The first step is to identify the problem (Dutch step I). Then a ‘no project scenario’ scenario has to be developed, including some basic measures to optimize its situation (comparable to the null alternative in step II and exogenous effects in step IV). The project alternative(s) is defined (step II) and the project costs and benefits are quantified (step III, V and VI). Next, these costs and benefits are compared to the ‘no project scenario’ to calculate the benefits and costs in relation to the null alternative (step VII). These net costs and benefits are expressed in profitability indicators (such as net present value; step VII). Finally, a sensitivity and risk analysis are performed (step VIII) (Ramirez Soberanis, 2010). Thus, the Mexican approach is very comparable to the Dutch approach in terms of the properties of the analysis. However, this does not necessarily mean that the analyses are of comparable quality, because the accuracy and comprehensiveness of the analysis can still differ significantly. Furthermore, Mexican ex-ante appraisal is often applied when a project has already been selected. Hence, only the project situation and the null alternative are compared, and other project alternatives are not considered.