Assessment of Forest Damage in
Croatia using Landsat-8 OLI Images
Original scientific paper
Anita Šimić Milas
1,2, Prabha Rupasinghe
1, Ivan Balenović
3,
Pece Grosevski
1Background and Purpose: Rapid assessments of forest damage caused by natural disasters such as ice-break, wind, flooding, hurricane, or forest fires are necessary for mitigation and forest management. Forest damage directly impacts carbon uptake and biogeochemical cycles, and thus, has an impact on climate change. It intensifies erosion and flooding, and influences socio-economic well-being of population. Quantification of forest cover change represents a challenge for the scientific community as damaged areas are often in the mountainous and remote regions. Forested area in the western Croatia was considerably damaged by ice-breaking and flooding in 2014. Satellite remote sensing technology has opened up new possibilities for detecting and quantifying forest damage. Several remote sensing tools are available for rapid assessment of forest damage. These include aerial photographic interpretation, and airborne and satellite imagery. This study evaluates the capability of Landsat-8 optical data and a vegetation index for mapping forest damage in Croatia that occurred during the winter of 2014.
Materials and Methods: The change detection analysis in this study was based on the Normalized Difference Vegetation Index (NDVI) difference approach, where pre- and post- event Landsat-8 images were employed in the ENVI image change workflow. The validation was done by comparing the satellite-generated change detection map with the ground truth data based on field observations and spatial data of forest management units and plans.
Results: The overall damage assessment from this study suggests that the total damaged area covers 45,265.32 ha of forest. It is 19.20% less than estimated by Vuletić et al. [3] who found that 56,021.86 ha of forest were affected. Most damage was observed in the mixed, broadleaf and coniferous forest. The change errors of commission and omission were calculated to be 35.73% and 31.60%, respectively.
Conclusions: Landsat-8 optical bands are reliable when detecting the changes based on the NDVI difference approach. The advantage of Landsat-8 data is its availability to acquire data and detect
Abstract
1 Bowling Green State University, School of Earth, Environment and Society, 190 Overman Hall,
Bowling Green, OH-43403, Ohio, USA
2 G-ECO Research, Toronto, ON M5K 1P2, Ontario, Canada
3 Croatian Forest Research Institute, Division for Forest Management and Forestry Economics,
Trnjanska cesta 35, HR-10000 Zagreb, Croatia Corresponding author: e-mail: asimic@bgsu.edu
Citation:
ŠIMIĆ MILAS A, RUPASINGHE P, BALENOVIĆ I, GROSEVSKI P 2015 Assessment of Forest Damage in Croatia using
Landsat-8 OLI Images. South-east Eur for 6 (2): 159-169. DOI: http://dx.doi.org/10.15177/seefor.15-14
INTRODUCTION
Every year we observe forest damages caused by natural disasters such as floods, tornados, ice-breaks, windstorm events, forest fires and hurricanes. Due to climate changes, in recent years natural disasters appear to be increasing, which calls for rapid assessment and monitoring of damage and conditions. Change detection studies are important to aid human response to forest cover change. It is important to collect the information about the processes that cause changes as well as patterns and extent of the changes [1]. The regular assessment is necessary for updating forest cover maps and the management of natural resources.
Forest damage directly affects forest ecosystem, as well as other natural processes and socio-economic state and well-being of human population. Assessment of forest damage is important for estimating forest carbon uptake as well as understanding biogeochemical cycles, climate change, soil erosion, and watershed processes. Forests allow for multiple resource benefits that include livestock grazing, wildlife habitats, as well as tourism and recreation. The preservation of forests helps conserve natural habitats and global biodiversity of flora and fauna, while providing other benefits for the public. Recently, because of increased public awareness of natural resource policy, public concerns have shifted toward sustainable forest management and long-term preservation of public lands including urban forests. Urban forest management is receiving a special attention for the reasons of increased health and economic vitalities to many communities. Burban and Anderson [2] emphasized three phases of emergency action for a natural disaster mitigation: 1) preparation - monitoring
the severe weather systems, developing a disaster response plan and allocating responsibilities to the community members; 2) response – immediate activity during and after the disaster such as tree damage clean-up and identifying different methods of better and safe migration of people through the damaged area; 3) recovery - attempts to restore conditions including tree planting and care, and protection of young trees and young forest ecosystem.
Quantification of cover change represents a challenge for management and inventories of forests as the damaged areas are often vast and located in remote mountainous regions [3]. While physical access to the affected areas and ground assessments may be complex, remote-sensing techniques enable a fast regional-scale damage assessment. This technology provides some of the most accurate means of measuring the extent of damaged forest [4-7]. In addition to the spatial dimension, multi-temporal satellite data allow for quantifying the forest cover changes patterns within a spatio-temporal framework for better forest management and policy decision-making.
As summarize by Chehata et al. [8], the medium or high spatial resolution sensors are commonly used to detect defoliation [9], clear-cut detection [10-11], or deforestation [12, 13]. Landsat TM and Modis have been applied in the studies related to windfall damage [14, 15] using the pixel based approach. Chehata et al. [8] used the object based change detection in windstorm damaged forest using high-resolution multispectral Formosat-2 images. Multispectral images are commonly used to assess the damage in two different approaches 1) based on vegetation indices, 2) using image classification methods. In the former, the trend between vegetation indices, before and after changes within a few days after an event. The data are publicly available and free of charge. The spatial resolution of 30 m is fine enough for a rapid assessment of forest damage. Merging different optical sensors (e.g. Landsat and Sentinel-2), or, considering active and/or thermal remote sensing satellite imagery would be necessary for monitoring damaged areas during winter time.
the event, are commonly compared in a per-pixel approach. The later includes classification of pre- and post-event maps and the differences are based on the changes in land cover classes. The relationship between the Normalized Difference Vegetation Index (NDVI) and proportion of damaged areas per pixel [16], or, between image texture and the percentage of crown loss, are commonly explored approaches [17, 18]. Traditional pixel-based supervised cla-ssification using supervised object-oriented classification and image differencing of vegetation indices are equally used in the forest change detection studies [19, 20].
Desirable indices include numerous Vegetation Indices (VIs) such as the Normalized Difference Vegetation Index (NDVI), fraction of Photosynthetically Active Radiation (fPAR), and Leaf Area Index (LAI). Vegetation indices are computed across all pixels without prior assumption of biome type, land cover condition or soil type [21].
NDVI is a function of near infrared (NIR) and red (R) spectral range and is computed using the following equation [21]:
NDVI = (NIR - R) / (NIR + R)
NDVI ranges from -1 (bare land) to 1 (high vegetation cover). Healthy vegetation has low reflectance in the red spectral region due to high absorption of light by chlorophyll and other pigment, and has high reflectance in the NIR due to the internal reflectance by the structural properties of the mesophyll spongy tissue of green leaf. The NDVI is a measure of leaf greenest and the photosynthetic capability of leaves [22]. Any abrupt change in NDVI suggests changes in vegetation canopies and thus, NDVI can be an adequate measure of forest change. Although NDVI can change due to different environmental factors such as soil moisture and the weather, this index is commonly used for the forest damage detection due to non-systematic variation as described by Huete and Liu [23] and Liu and Huete [11].
This study evaluates the capability of Landsat-8 and NDVI derived from this sensor
for mapping forest damage caused by extreme weather events in western Croatia during the winter of 2014.
Landsat-8 is an American Earth observation satellite launched on February 11, 2013 that began normal operations on May 30, 2013. Landsat-8 carries two instruments: the operational land imager (OLI), which includes a deep blue band and a shortwave infrared band for cirrus detection in addition to the existing visible and infrared bands, and thermal infrared sensor (TIRS), which provides two thermal bands. Both sensors provide improved signal-to-noise (SNR) radiometric performance quantized over a 12-bit dynamic range. Landsat-8 data products are consistent with all standard Level-1 data products as explained on the USGS web site [24], where also all details about processing levels of all Landsat data products could be found. The Level 1T data products are terrain corrected datasets with spatial resolution of 30 m for OLI multispectral bands. The Landsat-8 satellite images the entire Earth every 16 days. The data are georeferenced and processed to the Universal Transverse Mercator (UTM) map projection using the World Geodetic System (WGS) 84 datum. The Level 1G data product provide systematic and geometric accuracy, which is derived from data collected by the sensor and spacecraft. The Level 1T provides systematic radiometric and geometric accuracy by incorporating ground control points and applying a Digital Elevation Model (DEM) for topographic accuracy.
The forest damage was observed over five Croatian counties between January 31st and February 6th 2014 [3]. The damaged resulted from freezing rain and flooding. Freezing rain (ice-breaks) damaged forest stands in the Primorsko-Goranska County. Extreme rain events resulted in excessive flooding in the Zagrebačka County and Sisačko-Moslovačka County. To a lesser extent, the damage was observed in Karlovačka County and Ličko-Senjska County. A state of natural disaster was proclaimed in all five counties. To apply to the European Union (EU) Solidarity Fund, Vuletić
rapid damage assessment and quick recovery of the damaged forested areas. The damage cost assessment included damage of forest and forest ecosystem, forest roads and skid-trails, the cost of recovery, afforestation and post-afforestation protection, as well as the cost of emergency interventions during the event and damage risk prevention.
As stated by Vuletić et al. [3], there is no methodology for fast and reliable assessment of forest damage in Croatia. Thus, we decide to explore remote sensing technology and assess the damage using widely available multi-spectral remote sensing technology.
MATERIALS AND METHODS
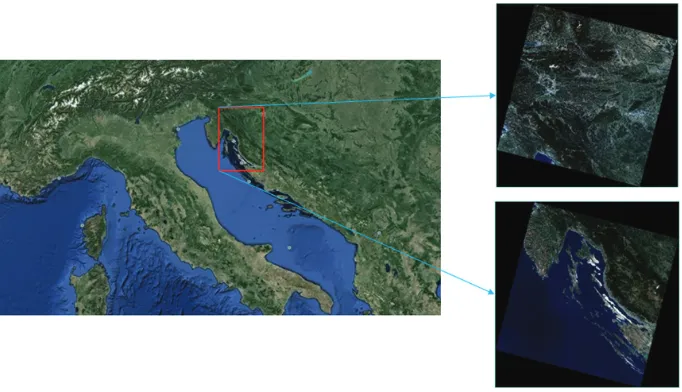
The study area was chosen based on the paper of Vuletić et al. [3]. The area consisted of five Croatian Counties affected by ice-breaks and flood events in the winter of 2014. The impact severity on the forest organizational units (Forest Administrations - FA) in each county which are managed by Croatian Forests Ltd. was different (Figure 1).
The method used in this study was based on Landsat-8 Level 1T images (paths/rows 190/28 and 290/29) [24]. Data from summer 2013 (August 2013) and 2014 (July 2014) were radiometrically and atmospherically corrected using FLAASH, a module embedded in ENVI software (Figure 2). FLAASH corrects wavelengths in the visible through near-infrared and shortwave infrared regions, up to 3 µm [25]. The module created a cloud map classification image used during FLAASH processing to refine the calculations. Mid-Latitude Summer (MLS) atmospheric model was used to run the corrections. Several clouds observed on the images were masked and excluded from the calculations. Two Landsat-8 tiles from each year were mosaicked to cover the area of interest (Figure 1). The histogram equalization was applied to avoid any differences in radiometric scheme of different images. Instantaneous NDVI was calculated for each image and the simple image NDVI difference approach was used to detect the forest damage. The images were chosen in the peak of growing seasons when any changes in NDVI are most prominent. Using the ENVI image change flow approach
[image:4.476.69.410.390.586.2]the NDVI difference image was generated. The default threshold was applied to generate the NDVI difference image between 2013 and 2014. The change detection areas were delineated based on the NDVI default value of zero for change-no change areas. Kernel size of 20 and aggregation minimum size of 100 was used in the ENVI process. The change class image, change class vector, change class statistics and difference image were imported to ArcGIS for further analysis.
ArcGIS was used to compare the findings with the ground truth data collected in 2014 and reported by Vuletić et al. [3]. The ground truth polygons were based on the damage intensity of forest stands in accordance with the Methodology for Damage Assessment Caused by Natural disasters, Croatia. The forest units were separated in broadleaf and coniferous forests although many units consisted of mixed forest represented by both broadleaf and coniferous stands. Each forest type was assign a grade based on the damage intensity and was classified as destroyed or damaged at different levels, using percentages.
The trees were considered damaged when their upper third of the crown were damaged more than 50%. Broken and uprooted trees, and trees with majority of the crown broken were considered as totally damaged (destroyed) trees [3]. The damaged forest considered areas where less than 70% of trees were damaged. The destroyed forest considered forest stands where damaged trees were estimated to be higher than 70% [3].
The land use map was provided by Corine Land Cover Croatia (CLC Croatia) [26], which was then used to compare the NDVI difference maps and the ground truth polygons for broadleaf and coniferous forest.
RESULTS AND DISCUSSION
Our results suggest that the area affected by the natural disaster in the western Croatia during the winter of 2014 occupies a total area of 45,265.32 ha (Figures 3, 4 and 5). It is 19.20% less than estimated by Vuletić et al. [3] who found that 56,021.86 ha of forest were affected.
Furthermore, Vuletić et al. [3] suggested that 19,245.79 ha of forest were seriously damaged, while 9,808.22 ha were totally destroyed. In our findings, based on the NDVI differences and the natural breaks generated in ArcGIS, the
NDVI 2014 NDVI 2013
Final Map Landsat
8 image summer 2014
Landsat 8 image summer 2013
Cloud masking ENVI: Image change detection
GIS: Validation Radiometric and atmospheric
corrections, Mosaicking Radiometric and
[image:5.476.42.239.53.289.2]atmospheric corrections, Mosaicking
FIGURE 2. Major steps used in the analysis
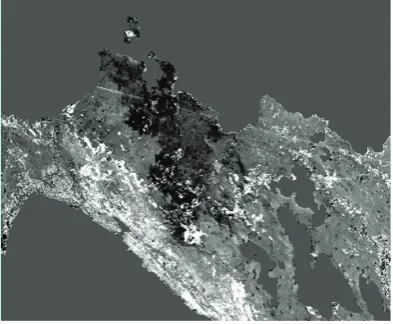
[image:5.476.252.449.445.607.2]FIGURE 4. Total damaged area generated by Landsat-8 using the NDVI difference approach and classification using ArcGIS natural breaks
[image:6.476.65.404.348.611.2]classification results show that high damaged area occupies 1,151.91 ha, moderate-to-high area occupies 4,448.43 ha, moderately damaged area occupies 13,940.10 ha, and low damaged area consists of 25,724.79 ha (Figure 4). In this approach, the class breaks are identified that best group similar values and that maximize the differences between classes. Differently than for ground truth findings, where the damage variability within each county is not considered, the resulting map considers high variability and shows different levels of damages regardless of administrative boundaries.
The errors of commission and omission associated with change are calculated to be 35.73% and 31.60%, respectively (Figure 5). The errors are observed generally at the edges of the damaged areas, except for a pathway that is running throughout the area. The satellite generated map classified this area as damaged, whereas the same area is excluded in the ground truth maps. Based on the provided land cover map, we have observed that the pathway consists of mixed and broadleaf forest.
As shown in Figure 4, we categorized the levels of damage intensity on the NDVI difference classes in this study. Overall, our study suggests that minimum of 16.24% of broadleaf forest, 24.32% coniferous, and 54.83% of mixed forests were damaged or destroyed by the ice-breaks in 2014.
For the purpose of practicality, we draped the polygons with different levels of damage intensity generated by Vuletić et al. [3] over the map generated in this study (Figure 6). We generated maps for different levels of damage over broadleaf and coniferous forests. Both the broadleaf and coniferous forests show somewhat higher errors of omission for damaged areas than for the destroyed areas. In other words, more agreements can be seen for destroyed areas suggesting that satellite-generated maps are more accurate in some high severity areas. This is reasonable to expect as satellite imagery is more sensitive to larger NDVI differences. In addition, visibility of the damage during the summer period may become somewhat unnoticed when low damaged
broadleaf trees receive new leaves, which may occur as early as 10-14 days following the event. However, Ciesla et al. [27], suggest that experience has shown that ice storm damage incurred during winter can still be resolved and classified on leaf-on color infrared (CIR) aerial photos taken at a scale of 1:8,000 during the summer leaf-on period following the event.
To develop a robust assessment of change detection it is important to pay attention to quantifying the change omission errors. Also, in a robust assessment, the area of 5,524.51 ha may be included in the calculations due to cloud cover.
Landsat-8 is widely available imagery, free of cost and can be downloaded in a few days after the data are collected. The spatial resolution of Landsat-8 images of 30 m is fine enough for the initial assessment of the damage under a clear sky. Our further analysis will involve thermal bands and also temporal bands throughout the winter time (weather permitted) to examine the impact of weather/ seasons, flooded water, soil moisture, and surface temperature on the delineation of the damaged areas. For instance, more water and colder temperature result in longer retention time of ice in the forest. Remote sensing images acquired during winter time together with meteorological ancillary data could provide addition information about behavior of the damaged areas during the winter time. This can considerably aid the preparedness plan after the ice melt. However, remote sensing data acquisition using optical sensors during the winter time stays a challenge. Besides the weather factor, the 16 day revisit cycle of Landsat can be another obstacle especially in the winter time when the weather is cloudy. Merging different optical sensors (e.g. Landsat and Sentinel-2) and to increase temporal data acquisition, or, considering active and/or thermal remote sensing satellite imagery would be necessary for monitoring damaged areas during winter time.
resolution of the sensor, one should consider that the ground truth observations can be challenging and biased as the area is remote in some instances and the estimation of the percentage damage is often subjective. To explore the impact of digital elevation model (DEM) embedded in Landsat-8 datasets we attempted to incorporate the ASTER DEM dataset in the calculations; however, the differences were insignificant.
CONCLUSION
This study explores a commonly used approach for estimating forest damage caused by ice-breaks, using Landsat-8 datasets, available
to the public. Landsat-8 is expected to be advantageous over the previous Landsat sensors as it has better radiometric resolution and more available bands. In this study, the NDVI difference approach was used to delineate the damage. Two Landsat-8 OLI images were used in the analysis, one for summer 2013 (pre-event dataset) and summer 2014 (post-event dataset). The resulting map shows that the damaged area is 19.20% less than estimated by Vuletić
et al. [3]. The error of omission is 31.60% and error of commission is 35.73%. The results indicate that proposed index NDVI approach performs sufficiently well in detecting the forest changes. However, the time series analysis including different seasons is needed to refine the findings.
REFERENCES
1. LAMBIN EF, STRAHLER A 1994 Indicators of land-cover change for change-vector analysis in multitemporal space at coarse spatial scales. Int J Remote Sens 15 (10): 2099-2119. DOI: http:// dx.doi.org/10.1080/01431169408954230
2. BURBAN LL, ANDERSEN JW 1994 Storm Over the Urban Forest (Second Edition). URL: https:// books.google.com/books?id=Q-iMhTCIcs8C &pg=PA16&lpg=PA16&dq=natural+disaste r+and+forest+damage&source=bl&ots=aci Pdhw85G&sig=9WikvZ0QbQgZFbasTp4QgIg EIDw&hl=en&sa=X&ei=_-LkVNWWHI-7yQS-EwAzgU#v=onepage&q=natural%20disaster%20 and%20forest%20damage&f=false (15 November 2014)
3. VULETIĆ D, KAUZLARIĆ Ž, BALENOVIĆ I, KRAJTER OSTOIĆ S 2014 Assessment of Forest Damage in Croatia Caused by Natural Hazards in 2014. South-east Eur for 5 (1): 65-79. DOI: http://dx.doi. org/10.15177/seefor.14-07
4. COPPIN PR, BAUER ME 1996 Digital change detection in forest ecosystems with remote sensing imagery. Remote Sensing Reviews 13 (3-4): 207-234. DOI: http://dx.doi. org/10.1080/02757259609532305
5. MILLER AB, BRYANT ES, BIRNIE RW 1998 An analysis of land cover changes in the Northern Forest of New England using multitemporal Landsat MSS data. Int J Remote Sens 19 (2): 215-265. DOI: http://dx.doi.org/10.1080/014311698216233 6. ADIA SO, RABIU AB 2007 Change Detection
of Vegetation Cover, using Multi-temporal Remote Sensing Data and GIS Techniques. Geospatial Application Papers, Geospatial Media and Communications Pvt. Ltd. URL: http:// gisdevelopment.net/application/environment/ffm/ adia.htm (15 January 2015)
7. FORKUO EK, FRIMPONG A 2012 Analysis of Forest Cover Change Detection. International Journal of Remote Sensing Applications 2 (4): 82-92.
8. CHEHATA N, ORNY C, BOUKIR S, GUYON D, WIGNERON JP 2014 Object-based change detection in wind storm-damaged forest using high resolution multispectral images. Int J Remote Sens 35 (13): 4758-4777. DOI: http://dx.doi.org/10 .1080/01431161.2014.930199
10. FRASER RH, ABUELGASIM A, LATIFOVIC R 2005 A method for detecting large-scale forest cover change using coarse spatial resolution imagery. Remote Sens Environ 95 (4): 414-427. DOI: http:// dx.doi.org/10.1016/j.rse.2004.12.014
11. LIU HQ, HUETE AR 1995 A feedback based modification of the NDV I to minimize canopy background and atmospheric noise. IEEE T Geosci Remote 33 (2): 457-465. DOI: http://dx.doi. org/10.1109/36.377946
12. HAYES DJ, COHEN WB 2007 Spatial, spectral and temporal patterns of tropical forest cover change as observed with multiple scales of optical satellite data. Remote Sens Environ 106 (1): 1-16. DOI: http://dx.doi.org/10.1016/j.rse.2006.07.002 13. VIBRANTS AC, MCROBERTS RE, MOSER P, NICOLETTI
AL 2013 Using Satellite Image-Based Maps and Ground Inventory Data to Estimate the Area of the Remaining Atlantic Forest in the Brazilian State of Santa Catarina. Remote Sens Environ 130 (15): 87-95. http://dx.doi.org/10.1016/j.rse.2012.10.023 14. KENNEDY RE, TOWNSEND PA, GROSS JE, COHEN
WB, BOLSTAD P, WANG YQ, ADAMS P 2009 Remote sensing change detection tools for natural resource managers: Understanding concepts and tradeoffs in the design of landscape monitoring projects. Remote Sens Environ 113 (7): 1382-1396. DOI: http://dx.doi.org/10.1016/j.rse.2008.07.018 15. WANG F, XU YJ 2010 Comparison of remote
sensing change detection techniques for assessing hurricane damage to forests. Environ Monit Assess 162 (1-4): 311-326. DOI: http://dx.doi.org/10.1007/ s10661-009-0798-8
16. WANG W, QU JJ, HAO X, LIU Y, STANTURF A 2010 Post-hurricane forest damage assessment using satellite remote sensing. Agr Forest Meteorol 150 (1): 122-132. DOI: http://dx.doi.org/10.1016/j. agrformet.2009.09.009
17. KING DJ, OLTHOF I, PELLIKKA PKE, SEED ED, BUTSON C 2005 Modelling and Mapping Damage to Forests from an Ice Storm Using Remote Sensing and Environmental Data. Nat Hazards 35 (3): 321-342. DOI: http://dx.doi.org/10.1007/s11069-004-1795-4
18. CLANDILLON S, YESOU H, MEYER C 2003 Benefits of SPOT 5 HR and VHR Data for Forest Management and Windfall Damage Mapping. In: IEEE International Geoscience and Remote
Sensing Symposium 5: 3079-3081. IGARSS ’03, Toulouse, France. DOI: http://dx.doi.org/10.1109/ IGARSS.2003.1294689
19. OLTHOF I, KING DJ, LAUTENSCHLAGER RA 2004 Mapping deciduous forest ice storm damage using Landsat and environmental data. Remote Sens Environ 89 (4): 484-496. DOI: http://dx.doi. org/10.1016/j.rse.2003.11.010
20. SCHWARZ M, STEINMEIER C, WASER L 2001 Detection of Storm Losses in Alpine Forest Areas by Different Methodic Approaches Using High Resolution Satellite Data. In: Proceedings of the 21st EARSeL Symposium: Observing Our Environment from Space: New Solutions for a New Millenium, Paris, France, 14-16 May 2001. EARSeL European Association of Remote Sensing Laboratories, Münster, Germany pp 251-257 21. HUETE AR 2005 Global variability of terrestrial
surface properties derived from MODIS visible to thermal-infrared measurements. IGARSS 05 Geoscience and Remote Sensing Symposium, 25-29 July 2005. URL: http://dx.doi.org/10.1109/ IGARSS.2005.1526782 (20 November 2014) 22. WAN Z 2003 MODIS Land-Surface Temperature
products users’ guide. URL: http://www.icess.ucsb. edu/modis/LstUsrGuide/usrguide.html (10 January 2015)
23. HUETE AR, LIU HQ 1994 An error and sensitivity analysis of the atmospheric- and soil-correcting variants of the NDVI for the MODIS-EOS. IEEE T Geosci Remote 32 (4): 897-905. DOI: http://dx.doi. org/10.1109/36.298018
24. USGS Landsat URL: http://landsat.usgs.gov/ Landsat_Search_and_Download.php (10 January 2015)
25. EXELIS ENVI version 5.1 (http://www.exelisvis.com/ docs/FLAASH.html)
26. CROATIAN ENVIRONMENT AGENCY 2015 CORINE Land Cover Croatia. URL: http://www.azo.hr/ Default.aspx?art=1138&sec=500 (20 January 2015)
27. CIESLA W, BILLINGS R, COMPTON J, FRAMENT W, MECH R, ROBERTS M 2008 Aerial signatures of forest damage in the Eastern United States. The Forest Health Technology Enterprise Team (FHTET), USA, 112 p. URL: http://www.fs.fed.us/ foresthealth/technology/pdfs/AerialSignaturesEast. pdf (17 January 2015)
© 2015 by the Croatian Forest Research Institute. This is an Open Access paper distributed under the terms of the