Flexural Strength and Effect of Drilling
Parameters on Surface Roughness, Circularity of
Natural Fiber Composites
SaikrupaCheluka1, YadagiriGollapalli2, Sravya S3
1, 2, 3
Vignan Institute of Technology and Science, Hyderabad, India
Abstract: An attempt to draw advantages offered by natural composite materials, as in the last two decades developments in this field have grown from laboratory scale of fundamental research to industrial implementation .Laminates are made using polymer matrix, and reinforcement is done using natural fibers such as cotton, jute and sisal. Epoxy resin is used in preparation of these composites. The present work majorly focuses on determining the tensile and flexural strengths of these materials along with circularity and surface roughness of holes which were drilled on them. Major conclusions are drawn to reduce the weight of the components and from different test results to demonstrate feasibility of machining for practical applications.
Keywords: Natural fiber composites-cotton-jute-sisal-drilling-flexural strength- drilling- circularity- surface roughness
I. INTRODUCTION
The constituent materials made up of two or more materials are called composite material. When the individual components will stand back as different characteristics with various physical and chemical properties within the finalized structure. The reinforcement which is composed of composite material is kept in a matrix based on the reinforcement of a material will get a distinct shape. The used reinforcement will improves the mechanical properties of the particular matrix if design will happen properly, got the material with excellent strength than all other involved individual material properties. It may be preferable to many purposes as based on the requirement comparatively to traditional materials.
The novel applications of bio fiber reinforcements was emerging job Ferraria et al [1] investigated that the more stress in temporary vicinity are developed in the layer next to the bond interface in hemp hybrid fiber composite with propylene.battacharya[2] concluded that tensile strength and plastic waste composite doesn’t matter the fiber content.mitra et al [3] prepared un woven jute fiber with polymer like formaldehyde polymerized cashew nut shell liquid formaldehyde which will decreased the moisture absorbance content of jute. Ku H., Wang H., Pattarachaiyakoop N., Trada M. [5]investigated the tensile properties of natural fiber reinforced polymer composites. Novel applications of Natural fibers have become mesmeric to researchers, engineers and researchers as an alternative reinforcement for fiber reinforced polymer (FRP) composites.dkk et al concluded that the alkali treatment could be a great impact on the properties of composites .according to the experimentation the tensile &impact properties proven that there is a bad results with jute+cauaua composite, jute+curaua had better effect when combined alkalization+salinization treatment is done.Q.Liu et al[6] investigated that there is no effect of reinforcement design.but fiber volume fractionhad great effect on toughness. Khoathane et al. [7] concluded that the as the fiber loading increases the strength of the bleache hemp fiber reinforced composite increases fantastically.
In this experimental wok prepared bio composite laminates with various natural fibers. tensile After the work has been done s the procedure how laminates will react against different experiments like tensile, surface roughness and circularity test etc..
II. EXPERIMENTAL STUDY
A. Materials Used in the Study
1) Reinforcement: Cotton fiber Jute fiber Sisal fiber
2) Matrix: Epoxy (LY556) Hardener (HY951)
3) Consumables: Waxpol Acetone
4) Safety Equipment: Nose mask, Hand gloves
B. Experimental Procedure
Preparation of laminate Wet-lay or hand-lay fabrication technique is used in this process. The moulds and spacers are chosen according to the required length, breadth and thickness of the laminate are cleaned with the emery papers of different grades in order to obtain smooth surface. Then acetone is poured on the mould for cleaning as it is a good solvent and waxpol is rubbed on the mould, spacers and bolts so that it gives good surface finish. The Ellen bolts are used to fix the spacers to the moulds using Ellen keys. Waxpol is applied in the aligned in 0 and 90 degree directions so that the matrix do not stick to the mould surface. The next step is mixing of resin and hardener in this the resin and hardener are mixed as per the mixing ratio i.e., 10:1 and weighed accordingly. Epoxy resins contribute the strength, durability and chemical resistance to the composite and the hardener acts as a curing agent. This resin-hardener mixture is stirred till the heat is released because of initiation of exothermic reaction now the mixture is ready to apply on the fibres. As these are natural fibres, the fibres are dusted and lengthened according to the size of the laminate required. The fibres are placed on the mould and then the resin- hardener mixture is applied in the form of layers called laminas in order to obtain the laminate required thickness. Then the mould is closed and moved to the hydraulic press here the mould is placed in the punch plate and inserted into the hydraulic press and the settings are adjusted accordingly. The curing of the laminate takes place at room temperature for one complete day and then removed from the press and the bolts are removed using Ellen keys and then the laminate is loosened carefully. Thus the laminate is obtained.
(a) (b) (c) Fig.2.2.1 Preparation of cotton ,sisal ,jute laminate
Fig.2.2.2 Placing the enclosed mould in hydraulic press
Fig.2.2.3 cotton ,sisal jute natural fiber composite
Fig.2.2.4 drill bits Fig.2.2.5Specimens after drilling
The cutting speed and feed rate of the three holes on each specimen of cotton, sisal and jute laminates:
Holes Cutting speed (rpm) Feed rate (mm/min)
A 750 0.05
B 1000 0.09
C 1250 0.13
Table2.1 Parameters for drilling of holes on laminate
III. TESTING
Circularity test, surface roughness test are performed using CMM (co-ordinate measuring machine), surface roughness measurement instrument,
In order to implement the composites into the everyday life usage the mechanical properties are to be studied and compared for the safety and reliability of the same. Once they have all the mechanical properties the usage can be determined. Hence you might require tensile test and compression test for the data comparison. According to the ASTM standards the test specimens are prepared and experimented to get higher accuracy in determination of flexural strength. The initial values were measured for each test specimen. The graphs were obtained during the experimentation the values of load, elongation at peak and forces causing flexural stresses in specimen was found out. The flexural strength determined by considering the geometry of tested specimen.
The formulae for flexural strength (σf) of a rectangular cross-section
σf = 3FL/2 bd2
Following parameters were used in above mentioned equation,
σf = flexural strength
F =load at a given point on the load deflection curve, (N) L = support span
b = width test beam width d = tested beam depth
in this experimentation we have considered sisal ,jute, cotton based natural composites and performed compression test, flexural test, circularity and surface roughness test for better machining operations
Input parameters:
Table2.2 Input parameters of sisal, jute, cotton bio composite for compression test type Specimen input parameters
Shape Width Thickness Pre load value
Maximum load
Maximum deflection
Output parameters type Specimen output parameters
Load at peak Elongation at peak Compression strength Flexural strength sisal 0.960KN 2.160 mm 5.383 N/mm2 162.59 N/mm2
jute 1.680 KN 3.110 mm 8.496 N/mm2 231.01N/mm2
cotton 3.865 KN 1.580 mm 23.553 N/mm2 775.04 N/mm2 Table2.3 output parameters of sisal, jute, cotton bio composite
Graph: sisal
Fig.3.1 Load vs Cross head travel for compression test (sisal)
As the graph is concerned there is a gradual increase both in terms of load and elongation. At 0.960KN and at elongation of 2.160mm fracture occurs. After the fracture there is a rapid decline in terms of load application, but elongation continues until 7mm and the specimen finally breaks into two pieces.
The decline in terms of loads after the fracture point depicts the ductile nature of sisal fibre.
Graph: jute
Fig.3.2 Load vs Cross head travel for compression test (Jute)
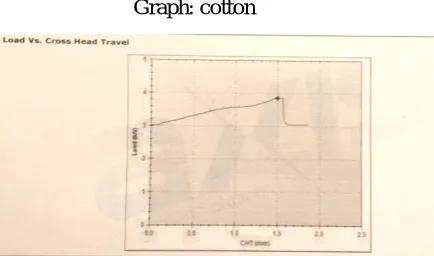
Graph: cotton
Fig.3.3 Load vs Cross head travel for compression test (Cotton)
Initially load is acted on the specimen, but there is no elongation until the load value reached till 3KN, from 3KN there is a gradual increase in terms of elongation and at peak load of 3.865KN and with an elongation of 1.8mm the specimen broke into two pieces. to determine the maximum tensile strength of a material we make use of tensile testing. The specimens are placed in the cross heads and pulled apart and the load and elongation at peak, tensile strength and yield strength is determined and graphs are plotted accordingly.
Table2.4 Input parameters of sisal, jute, cotton bio composite for tensile test
type Specimen output parameters
[image:5.612.56.583.299.706.2]Load at peak Elongation at peak Tensile strength UTS/YS sisal 5.815 KN 5.360 mm 43.989 N/mm2 -- jute 5.900 KN 4.510 mm 45.224 N/mm2 -- cotton 2.935 KN 5.670 mm 26.805 N/mm2 18.756
Table 2.5 output parameters of sisal, jute, cotton bio composite for tensile test
[image:5.612.175.420.603.710.2]Graph: cotton
Fig.3.4 Load vs Cross head travel for Tensile test (Cotton) Type Specimen input parameters
Shape Width Thicknes s
Initial G.L. for %
elongatio n
Pre load value
Maximum load
Maximum elongation
Cross section area
sisal Flat 20.09 mm 6.58 mm 50 mm 0 KN 100 KN 200 mm 132.192 mm2 jute Flat 20.04 6.51 mm 50 mm 0 KN 100 KN 200 mm 130.460
mm2 cotton Flat 20.09 mm 5.45 mm 50 mm 0 KN 100 KN 200 mm 109.491
As the graph is concerned load started acting gradually, at maximum load of 2.935KN and at an elongation of 5.670mm fracture occurred.
After the fracture the load is increased gradually until 56KN but there is no change in terms of elongation and at 56KN the specimen broke into two pieces.
The straight line in the graph shows that there is no elongation in terms of length but the load is gradually increased until 56KN.
Graph: jute
Fig.3.5 Load vs Cross head travel for Tensile test (jute)
Graph: sisal
Fig.3.6 Load vs Cross head travel for Tensile test (sisal)
As the graph is concerned load gradually increased with respect to elongation and at a peak load of 5.9KN and maximum elongation of 4.510mm fracture occurred. After the fracture at 5.4KN and at an elongation of 4.6mm the material broke into two pieces.
As the graph is concerned there is a gradual increase in terms of load with respect to elongation at a peak load of 5.815KN and at maximum elongation of 5.360mm fracture occurred.
Circularity Test Results S.no Material Cutting
speed
(rpm)
Feed rate( mm/min)
Point angle
(degrees)
Nominal diameter for each hole
Actual diameter for each hole
Difference
1 Sisal
750 1000 1250 0.05 0.09 0.13 118 118 118 0.0000 0.0000 0.0000 0.0390 0.0420 0.0592 0.0390 0.0420 0.0592
2 Cotton
750 1000 1250 0.05 0.09 0.13 118 118 118 0.0000 0.0000 0.0000 0.0185 0.0244 0.0533 0.0185 0.0244 0.0533
3 Jute
[image:7.612.67.547.87.340.2]750 1000 1250 0.05 0.09 0.13 118 118 118 0.0000 0.0000 0.0000 0.0220 0.0280 0.0469 0.0220 0.0280 0.0469 Table 2.6 Circularity values for sisal
With a cutting speed at 750 rpm, and a feed rate of 0.05 hole ‘A’ has the highest circularity with minimal error.
As cutting speed, feed is decreasing the difference value of circularity test is decreasing in nature. So the machining operations at lower cutting speed and feed is preferable. Surface roughness test results for sisal, jute, cotton
Holes A B C sisal -Surface roughness (μm) 1.35 2.885 3.332 jute-Surface roughness (μm) 2.531 2.9 2.960 cotton-Surfaceroughness (μm) 1.366 2.823 2.996
Table 2.7: Surface roughness of sisal
the surface roughness will increase when feed rate increases to strain hardening effect to obtain good surface finish along with higher accuracy, it’s essential to cut with low feed rates and with low chip loads. Comparing the three tables the hole with lowest surface roughness value obtained is of sisal fibre with 1.35μmas surface roughness
IV. CONCLUSIONS
In the present experimentation, investigations found that the tensile ,flexural strength ,hole quality and its drilling parameters of natural fiber polymer composites of sisal, jute, cotton .
[image:7.612.60.526.575.709.2]From the graphs it is clear that jute has higher tensile strength. Tensile strength increases with jute fiber reinforcement compared to other fibers. So composites made with jute fibers can be very useful for construction purposes, partition boards, walls, fabricated buildings constructed to be used in the time of natural calamities.
So cotton has both high flexural and compression strengths (the values of compression strengths are mentioned in the above tables) which projects that the material is strong compared to other laminates and can with stand heavy loads and loads that tend to reduce the size of specimens.
A. Circularity test Conclusions
Circularity decreases with increase in spindle speed, Spindle speed and change in point angle effects circularity, but in our project spindle speed is kept constant .Feed rate doesn’t have much effect on circularity.
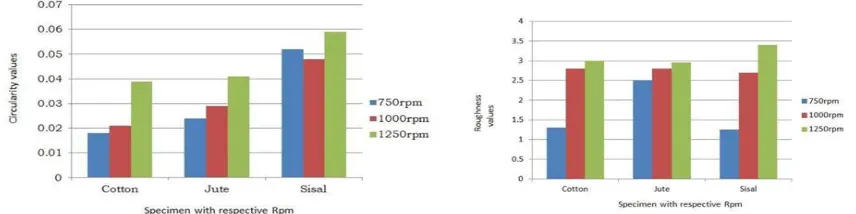
From our observation tables and graph, the best circularity of 0.0185 is obtained for cotton laminate with a speed of the spindle at 750rpm along with the feed rate of 0.05 mm/min.
[image:8.612.95.523.264.371.2]It can be concluded that to drill a better hole with least deviation from the nominal value that is to obtain good circularity, cotton laminate with the above mentioned parameters should be used.
Fig .3.9 Comparison of circularities of specimen, surface roughness of holes drilled on different specimen at different cutting speeds,
The graph is drawn comparing the difference between actual diameter and nominal diameter against the respective cutting speeds with the help of data present in the tables above(X axis-specimens with respective RPM; Y axis- Circularity) The graph is drawn by comparing the surface roughness of drilled holes with their respective cutting speeds (X axis- specimens with respective RPM; Y axis- surface roughness)
By comparing observation tables and graph of surface roughness, to obtain a hole with good surface finish and with less wear and low friction coefficients sisal components should be drilled with spindle speed of 750rpm and with a feed rate of 0.05. To satisfy environmental issues and lower cost requirements related to lower emissions and fuel consumption has to reduce the weight of components in Aeronautical industry. So to achieve these natural composites with fiber reinforcements are used .In these manufacturing units holes with good circularity and least surface roughness are at most required as drilling is a familiar operation in order to join the different parts with the help of fasteners such as bolt nuts, screws and rivets. Composites made from cotton fiber can be used in automotive manufacturing units and in semi-structural applications.
REFFERENCE
[1] Ferreira JM, Silva H, Costa JD, Richardson M (2005) Stress analysis of lap joints involving natural fibre reinforced interface layers. Composites Part B: Engineering 36: 1-7. [2] Ku H., Wang H., Pattarachaiyakoop N., Trada M. A review on the tensile properties ofnatural fiber reinforced polymer composites, Composites: Part B, 42 pp. 856–
873 (2011).
[3] Bledzki AK, Zhang W, Chate A (2001) Natural fiber reinforced [ microfoams. Compos Sci Technol 61: 2405-2411. [4] http://cat.inist.fr/?aModele=afficheN&cpsidt=16182404
[5] D.K.K.CavalcantiaM.D.BaneaaJ.S.S.NetoaR.A.A.LimaaL.F.M.daSilvabR.J.C.Carbasbc Mechanical characterization of intralaminar natural fibre-reinforced hybrid composites: Volume 175, 15 October 2019, 10714
[6] Liu Q., Hughes M. The fracture behaviour and toughness of woven flax fibre reinforcedepoxy composites, Composites: Part A, 39 pp. 1644–1652 (2008).
[7] Ku H., Wang H., Pattarachaiyakoop N., Trada M. A review on the tensile properties of natural fiber reinforced polymer composites, Composites: Part B, 42 pp. 856– 873 (2011).
[8] Singleton A.C.N., Baillie C.A., Beaumont P.W.R., Peijsc T. On the mechanicalproperties, deformation and fracture of a natural fibre/recycled polymer composite,Composites: Part B, 34 pp. 519–526 (2003).
[9] Bledzki A.K., Jaszkiewicz A. Mechanical performance of biocomposites based on PLAand PHBV reinforced with natural fibres – A comparative study to PP, Composites Science and Technology, 70 pp. 1687–1696 (2010).