ANNIKA GORETZKI
Student number University of Twente: s1359215 Student number Technical University of Berlin: 338456 E-Mail: [email protected]
MASTER THESIS
Double degree program
Technical University of Berlin and University of Twente
Master of Sc. in Innovation Management and Entrepreneurship Master of Sc. in Business Administration
PUBLIC, LIMITED VERSION
DEVELOPING A
PERFORMANCE
MEASUREMENT
METHOD IN ORDER TO
EVALUATE THE
BENEFITS AND COSTS
OF WEB APPLICATIONS
FIRST SUPERVISOR UNIVERSITY OF TWENTE: Dr. Efthymios Constantinides
Assistant Professor Marketing / E-media School of Management and Governance University of Twente
SECOND SUPERVISOR UNIVERSITY OF TWENTE: Dr. Michel L. Ehrenhard
Assistant Professor Entrepreneurial Leadership School of Management and Governance University of Twente
This thesis develops a new method to measure the performance of different types of online activities. It addresses the still quite immature, indecisive literature about web measurement and makes valuable contributions to theory and practice by answering research questions.
The thesis exposes that the ubiquity of the internet as well as the development of the information and communication technologies create new opportunities for marketers to address their target groups. In order to display the benefits of the resulting online activities, marketing departments of companies need to quantify the performance of their web applications. However, also the XX GmbH faces the common business problem that benefits, business relevance, efficiency and potential for improvement of used web applications remain uncertain. This is ascribable to a missing continuous monitoring, measurement, analysis and reporting procedure based on determined metrics for web performance measurement.
Even though online monitoring tools offer new ways for marketing measurement, this thesis argues that no standardized, accepted technique for web performance measurement existsand none of the present measurement approaches could fulfill all identified requirements to quantify web applications. Therefore, the thesis develops a method to assess the performance of different types of web applications based on a set of consistent web metrics. Thereby, theoretical knowledge and practical justification are combined iteratively in three research cycles. The data to develop the new web performance measurement tool is gathered from company documents, scientific literature, expert interviews and web monitoring. Based on the gained information, the structure of the new tool, named “web scoreboard”, is designed, the scores, subgoals and metrics are selected and a grading and weighting system is determined.
By using the single case study design with three selected web applications of XX as units of analysis, this thesis also proves the practical applicability of the new method. The web scoreboard indicates the performance of each web application regarding the benefits and the costs during the investigated period. Moreover, the thesis recommends a set of KPIs as well as improvement measures to address the key metrics and introduces a tool for strategic guidance.
Table of content
List of figures ... IV List of tables ... IV Abbreviations ... V Statement of original authorship and confidentiality ... VI Acknowledgements and keywords ... VII
1 Introduction – an overview of the thesis ... 1
1.1 Online market and web applications as background to the research ... 1
1.2 Web measurement as underlying management problem and research gap ... 1
1.3 Research questions answered in this thesis ... 2
1.4 Research aim – designing a web performance measurement tool... 3
1.5 Research design and methodology to develop the tool “web scoreboard” ... 3
1.6 Outline of the thesis ... 4
1.7 Delimitations of scope, key assumptions and their justifications ... 5
1.8 Conclusion of the introduction ... 5
2 Situation analysis deriving the management problem and research gap ... 6
2.1 Situation analysis online-market ... 6
2.1.1 Development of the medium internet, Web 2.0 and user behavior ... 6
2.1.2 Impact of the internet developments on companies and managers ... 7
2.2 Situation analysis of the on- and offline marketing performance measurement 7 2.3 Conclusion of the situation analysis ... 9
3 Case study XX GmbH ... 10
3.1 Facts and figures about the XX GmbH ... 10
3.2 Management problem and selection of XX as company case study ... 10
3.3 Web applications of XX and selection of the units of analysis ... 10
3.4 Conclusion of the case study selection ... 12
4 Methodology leading to the new web measurement method ... 13
4.1 Introduction to the methodology and overview of the research process ... 13
4.2 Data collection methods ... 13
4.3 Execution of the research cycles ... 15
5 Analysis of performance measurement methods – 1st research cycle ... 16
5.1 Introduction to performance measurement ... 16
5.4 Conclusion – justification to develop a new measurement method ... 21
6 Development of a new web performance measurement method – 2nd research cycle 22 6.1 Introduction to the second research cycle ... 22
6.2 Structure and categorization of the web scoreboard ... 22
6.3 Subgoals and metrics of the web scoreboard ... 23
6.3.1 Selection of metrics based on a literature review and expert interviews 23 6.3.2 Subgoals and metrics of web scoreboard’s external perspective ... 25
6.3.3 Subgoals and metrics of web scoreboard’s internal perspective ... 30
6.4 Conclusion and overview of the web scoreboard ... 32
7 Data analysis with a weighting and grading system – 3rd research cycle ... 34
7.1 Introduction to the necessity to develop a weighting and grading system .... 34
7.2 Weighting system – explanation and justification ... 34
7.3 Grading system – explanation and justification ... 36
7.4 Conclusion of the data analysis ... 38
8 Practical application of the new performance measurement method ... 40
8.1 Introduction to the practical application ... 40
8.2 Data collection via web analytics and monitoring tools ... 40
8.3 Resulting scores, key metrics and recommendations for improvement ... 42
8.3.1 Overview of resulting scores and overall score ... 42
8.3.2 Information score: key metrics and measures for improvement ... 43
8.3.3 Engagement score: key metrics and measures for improvement ... 44
8.3.4 Conversion score: key metrics and measures for improvement ... 45
8.3.5 General cost score: results and measures for improvement ... 46
8.4 Application of a KPI set for continuous, standardized reporting ... 47
8.5 Application of the General Electric Matrix for strategic recommendations . 48 9 Findings and contributions as well as limitations and further research ... 50
9.1 Summary of findings and contributions of the thesis ... 50
9.2 Limitations and further research ... 52
10Discussion, recommendations and conclusion ... 54
10.1Critical discussion and recommendations to apply the new method ... 54
10.2Conclusion ... 57
List of figures
Figure 1: Structure of the master thesis ... 4
Figure 2: Overview of the iterative research cycle process applied in this thesis ... 13
Figure 3: Five steps of a standardized measurement process ... 20
Figure 4: Calculation of the total scores based on the adjusted Fishbein Attitude Model ... 37
Figure 5: Draft of KPI PowerPoint chart for monthly reporting ... 48
Figure 6: Illustration of the adjusted General Electric Matrix ... 49
List of tables
Table 1: Research questions and the chapters in which they are explained and answered ... 2Table 2: Research question which is answered in chapter five ... 16
Table 3: Requirements identified in the expert interviews and the web analytics workshop .. 17
Table 4: Checklist requirement fulfillment of the top three examined measurement tools ... 21
Table 5: Research question which is answered in chapter six ... 22
Table 6: Overview of the literature used to identify a set of relevant metrics ... 24
Table 7: Web scoreboard with its structure, scores, subgoals and metrics ... 33
Table 8: Research question which is answered in chapter seven ... 34
Table 9: Weighting system of the web scoreboard ... 36
Table 10: Determined intervals Online-community as an example for the grading system .... 38
Table 11: Research questions which are answered in chapter eight ... 40
Table 12: Different data sources shown by the legend of the web scoreboard ... 41
Table 13: Overview of the resulting grades of the scores ... 43
Table 14: Detailed results of the web scoreboard ... 43
Table 15: Research questions and their summarized answers ... 51
Abbreviations
XX GmbH Company which is made unrecognizable due to the confidentiality agreement BVDW Federal association of Digital Economy
BITKOM Federal Association for Information Technology, Telecommunications and New Media
B2B Business-to-Business B2C Business-to-Consumer
Eurostat Statistical office of the European Union
EU27 Association of 27 countries of the European Union FTE Full-Time Equivalent
KPI Key Performance Indicator ROI Return on Investment R&D Research & Development SEM Search Engine Marketing SEO Search Engine Optimization SNP Social Networking Potential URL Uniform Resource Locator
Statement of original authorship and confidentiality
Statement of original authorship
I certify that the present master thesis is the result of my own work except where otherwise stated. The use of material from other sources has been properly and fully acknowledged by giving explicit references in the text.
Stuttgart, 15th of October 2013
Annika Goretzki
Confidentiality statement
The present master thesis contains company internal information and confidential data of the XX GmbH. Therefore, the thesis can just be used for evaluation purpose and the contents of this thesis are to remain confidential. Without the explicit permission of the XX GmbH the thesis – neither completely nor in parts – is not allowed to be published or accessible for third parties.
Stuttgart, 15th of October 2013
Acknowledgements and keywords
Acknowledgements
I would like to express my sincere gratitude to my first supervisor, Dr. E. Constantinides, for his professional guidance, useful critiques and enthusiastic encouragement. Despite his busy schedules, he has always made himself available to clarify my questions and I could not have thought of a better supervisor. Besides, a special thanks to Dr. M.L. Ehrenhard, for his good advice and useful comments.
My grateful thanks are also extended to my company supervisors, for their valuable support and constructive recommendations on this project. Finally, a big thank-you goes to the web application managers of XX for their patient guidance and assistance throughout the research process.
Keywords
1
Introduction – an overview of the thesis
1.1 Online market and web applications as background to the research
Development online market. The ubiquity of the internet, the development of information and communication technologies (Eurostat, 2012) and the accompanied knowledge transparency (Kotler, 2002) are changing the marketing of companies (Hanna et al., 2011; Pires et al., 2006) as well as the way to make business (Wirtz et al., 2010). Those trends foster the customer empowerment, give rise to various Web 2.0 applications (Bernoff & Li, 2008; Constantinides & Fountain, 2008; Hoffman & Fodor, 2010) and drive the expansion of user-generated content (Kozinets et al., 2010; Merz et al., 2009). This results in threats as well as new opportunities for marketers (Hoffman & Novak, 2012; Pires et al., 2006). To face the challenges and benefit from the technological, economic and social drivers (Kaplan & Haenlein, 2010), new media activities are judged by executives as a core element of companies’ marketing strategy (Hutter, 2012; McKinsey, 2012; Hanna et al., 2011). Online activities can increase the effectiveness of marketing and might have a powerful impact on the performance (Hanna et al., 2011; Kaplan & Haenlein, 2010; Engagementdb, 2009). Those facts highlight the business relevance of web applications but this increasingly important topic (BITKOM, 2012) still implicates several problematic issues (Kelly, 2013; Järvinen, 2012).
1.2 Web measurement as underlying management problem and research gap
Management problem XX GmbH. Those problems are also often discussed topics in the “XX GmbH”. Right now, “XX” uses various web applications – as websites, online-communities and web shops – to inform, communicate and make business with its target groups. The problem is that at the moment a continuous monitoring, measurement, analysis as well as reporting procedure of web activities does not take place. Through the lack of consistent measurement metrics and a missing set of defined KPIs, XX faces the common management problem that the benefits, business relevance, efficiency and potential for improvement of the used web applications remain uncertain.
Research gap. Research about web measurement is still quite immature (Murdough, 2009) and no standardized approach for a systematic and comprehensive assessment of the performance and financial impact of web applications is widely accepted (Kelly, 2013; Bremser & Chung, 2006; Divol et al., 2012; Welling & White, 2006a, 2006b). A literature review about web performance measurement shows that research remains indecisive about appropriate tools and indicators to evaluate the effectiveness and efficiency of different types of web applications. Thus, a universally applicable method needs to be designed.
1.3 Research questions answered in this thesis
Research questions. The management problem and research gap lead to the following central question: “What is an appropriate method to measure the performance of different types of
web applications?”. In order to structure this broad, general question in more specific
research issues, it can be divided into five research questions. Those subquestions help to narrow the focus of the thesis and by working on those questions, the answer to the central question is compiled step by step. Table 1 provides an overview of the five research questions. Their answer as well as their contribution to fulfill the research aim is explained in the respective chapter illustrated in Table 1.
Table 1: Research questions and the chapters in which they are explained and answered
Research question need to be answered Chapter
1) Which of the existing performance measurement methods is appropriate for web measurement? 5 2) Which metrics are appropriate to measure benefits and costs of different types of web applications? 6 3) How can the identified metrics for web measurement be weighted and graded? 7 4) How is it possible to test the practical applicability of the new method? 8 5) What is an appropriate format for standardized reporting and for strategic guidance? 8
1.4 Research aim – designing a web performance measurement tool
Research aim. Performance measurement of online activities is important as only if the development is monitored, the business relevance can be justified, improvement measures can be derived and the “trial and error mentality” can be lived (Haberich, 2013). As there exists no standardized, widely accepted technique in theory or practice (Kelly, 2013; Bremser & Chung, 2006; Divol et al., 2012; Welling & White, 2006a, 2006b) and none of the established performance measurement methods could fulfill the identified requirements for a web performance measurement, this thesis aims at designing a new performance measurement tool for online activities. The target is to develop a universally applicable method to assess the performance of different types of web applications based on a set of consistent web metrics. With the help of this measurement tool, the management of companies might exploit the full underlying potential of web applications in order to support marketing and sales. In addition, it is aimed at testing the designed method as well as recommending a set of KPIs and introducing a tool for strategic guidance to provide a format for a standardized reporting.
1.5 Research design and methodology to develop the tool “web scoreboard”
Single case study. The new performance measurement tool, named “web scoreboard”, is developed based on the single case study about the XX GmbH. Hereby, three different web applications are used as multiple units of analysis. Those selected applications represent the different types of online activities (i.e. web applications with the major objective of information, engagement or conversion). Based on a single organizational context, the thesis aims at generating knowledge which can be applied to solve a common problem (i.e. web performance measurement).
1.6 Outline of the thesis
[image:12.595.72.389.530.781.2]The thesis is composed of ten chapters which are illustrated in Figure 1. The first chapter gives an introduction to the most important issues of the thesis. By analyzing the situation of the online market and highlighting the importance and problems of performance measurement, the second chapter serves as a basis. Subsequently, the selection of the single case XX GmbH with the three web applications as units of analysis, is described. Chapter four gives an overview of the three research cycles which are used in the design process of the new method and explains the data collection methods. Based on identified requirements, existing measurement tools are evaluated in chapter five which verifies the necessity to develop a new method. The following chapter describes the categorization, scores, subgoals and metrics of the new method, labeled “web scoreboard”. The process of data analysis with the development of a grading and weighting system is explicated in chapter seven. Subsequently, the practical application of the web scoreboard is tested by implementing it to the three units of analysis. In this context the data collection as well as the achieved scores with their key metrics and respective improvement measures, are described. Further, a set of KPIs with a standardized reporting format is introduced and a tool for strategic recommendations is illustrated. Chapter nine summarizes the findings and contributions of the thesis and comes up with limitations and further research issues. In the end, chapter ten discusses the method of the web scoreboard, recommends conditions for its further application and concludes the thesis.
1.7 Delimitations of scope, key assumptions and their justifications
Key assumptions. The target groups of XX are B2B and B2C customers. The first key assumption is that the differences of those target groups do not play a role in developing the web scoreboard, hence they can be neglected. Besides, the web applications used to design the new method are addressing different regions. In order to justify this selection, another key assumption is that the addressed users do not have relevant dissimilarities in culture and in their online user behavior (Li & Bernoff, 2008). Further, the web scoreboard is set up in order to provide a measurement method for various types of online activities. Thus, it is supposed that the selected web applications with their different strategic goals represent diverse web activities.
Scope. Even though the tool is developed based on a single case study, its aim is to be applicable also to other web applications, divisions and companies. The data of XX’s web applications to test the web scoreboard was collected during one single month (1st until 30th of June 2013).
Writing style. Theoretical characterizations are given occasionally and the single case study about XX exemplifies the design and application of the new tool. The writing style of terms and the illustrations used in this thesis are geared to the way utilized at XX.
1.8 Conclusion of the introduction
2
Situation analysis deriving the management problem and research gap
2.1 Situation analysis online-market
2.1.1 Development of the medium internet, Web 2.0 and user behavior
Development of the medium internet. The medium internet has become a fixed component in the daily life of many people. In 2012, 72% of the EU27 households had access to the internet via a fast broadband connection (Eurostat, 2012). The faster internet connections and the ubiquity of the World Wide Web (WWW) through devices like Smartphones support the rapid progress of modern information and communication technologies (BVDW, 2013).
Web 2.0, social media and user behavior. In the framework of this progress terms as “Web 2.0”1 and “Social Media” are used. Web 2.0 describes the way of internet usage that does not focus anymore on technical functions but rather on the interactivity of internet users (Hassler, 2012; Li & Bernoff, 2008). Kaplan and Haenlein (2010) see the Web 2.0 as a platform that is collaboratively modified by users and based on which social media evolved. Social media is defined by Hoffman and Novak (2012) “as Web-based applications that permit creation, sharing, manipulation and consumption of user generated content” (p. 202). The power of social media has its origin in the external desire of humans, as social entities, to connect with each other and thereby create content (Blanchard, 2012; Li & Bernoff, 2008; Qualman, 2011). User generated content means “various forms of media content that are publicly available and created by end-users” (Kaplan & Haenlein, 2010, p. 61). Customers are no longer passive participants but actively engaging and contributing (Kozinets et al., 2010; Merz et al., 2009) as well as influencing with their user-generated content other consumer’s behavior (Kotler, 2002; Riegner, 2007). This can be done because people trust more in the evaluations of their peers (Qualman, 2011; Karpinski, 2005). Thus, recommendations of other users – often called Word-of-Mouth – are more effective than traditional marketing communication (Kozinets et al., 2010) since they are perceived by customers as a trustworthy and reliable source of information (Razorfish, 2008). This entails that the consumer now has the control and power over company brands (Qualman, 2011; Bernoff & Li, 2008; Constantinides & Fountain, 2008; Hoffman & Fodor, 2010). The internet has changed the buying and decision process of customers (TNS, 2011). Information about products is gathered through websites or published customer experiences in online-communities. After the buying decision is made, users can nowadays even purchase a lot of products online (Huizingh, 2002).
1
2.1.2 Impact of the internet developments on companies and managers
Impact of the changing technologies on marketing. Due to those rapid developments of the modern communication and information technologies, the transparency of markets and the change in user behavior, firms need to adjust their activities to stay competitive in the long run (Nielsen Company, 2009). The new technologies are and will be also very important for the role of marketers in the firm and the operation of marketing concepts (Tapp & Hughes, 2004). This is proven by the fact that marketing has changed less in the past 100 years altogether than during the last five years (Turner & Shah, 2011). Besides, web applications increase constantly in importance in the B2C as well as in the B2B area (BVDW, 2012a).
Advantages of web applications2. Web applications provide multiple advantages. First of all, they can generate consumer insights faster and at lower costs than traditional methods, make co-creation possible, develop new business models and bring the firm closer to the market (Gillin & Schwartzman, 2011; Stelzner, 2012). Furthermore, especially social media activities can help businesses to develop beneficial trust-based relationships to customers (Bulut & Mandaric, 2012; Constantinides & Zinck Stagno, 2012) and bring new clients to the firm (Kelly, 2013). In addition, key advantages of the interactive social media tools are the possibility to listen, interact and collaborate (Bulut & Mandaric, 2012) as well as to influence each stage in the buying decision process of the consumer (Divol et al., 2012). Overall, the internet can provide benefits regarding costs and time as well as competitive advantage by creating long-term customer relationships and loyalty of the market (Li & Bernoff, 2008; Nambisan, 2002). Even though the WWW has changed the way of interaction and offers various possibilities, the company needs to set the framework (Hoffman & Fodor, 2010) and need to listen and react (Qualman, 2011) in order to participate successfully in online activities (Hoffman & Novak, 2012; Kaplan & Haenlein, 2010). Finally, managers need to keep in mind that trust is crucial for the success of online applications (Sterne, 2010).
2.2 Situation analysis of the on- and offline marketing performance measurement
Performance measurement. According to Neely et al. (1995) performance measurement is defined as “the process of quantifying the efficiency and effectiveness of action” (p. 80). In general, performance measurement is a broad topic which crosses functional boundaries (Neely, 1999) and the literature about this important research field is diverse (Marr &
2
Schiuma, 2003; Neely et al., 1995). Having its origin in the beginning of the 20th century, the research field of performance measurement had a revolution in the mid 1990s (Neely, 1999).
Problems and development of marketing performance measurement. For all activities in the company, managers need to prove an enhancement in the value for the firm. As the budget is allocated to the activities that reach the determined goals in the most efficient way, marketers need to show their ROI as well. Apart from the general problem in marketing, namely to attribute success to single activities (Meffert et al., 2008), the problem is that ROI calculations do not work for on- and offline marketing activities, like social media (Gillin & Schwartzman, 2011; Kelly, 2013). This is the case because the results of those efforts are primarily no quantifiable, intangible assets – like market awareness, customer engagement, continuous feedback and product development (Farris et al., 2010; Gillin & Schwartzman, 2011; Welling & White, 2006a). Those long-term, nonmonetary benefits are not quantifiable but very valuable for a firm (Meier & Zumstein, 2013) as they might be the step before a customer generates financial outcome (Blanchard, 2012; Blanchard, 2009) and serve as a basis for long-term financial success and commitment (Kaplan & Norton, 2004). Performance measurement has been developed in order to display the effects of immaterial, intangible assets and make them measurable. Thereby, the business relevance of specific activities (Artz, 2010) can be justified. In the mid 1990s managers started to focus more on marketing performance management (Meffert et al., 2008; Neely, 1999). Nowadays, it is a widely discussed research field (Artz, 2010) and of keen interest in the e-business literature (Bremser & Chung, 2006).
Problems of marketing measurement in the online surrounding. The online environment provides novel possibilities to measure the effects of marketing activities (Gillin & Schwartzman, 2011; Kelly, 2013). Here the customer behavior is traceable and visible (Hennig-Thurau et al., 2010; Welling & White, 2006a) and real-time feedback on the effectiveness of marketing efforts is provided (Farris et al., 2010; Hassler, 2012). Nevertheless, no standardized, widely accepted approach for a systematic and comprehensive measurement of the performance and financial impact of web applications exists in theory and practice (Bremser & Chung, 2006; Divol et al., 2012; Welling & White, 2006a, 2006b).
for this phenomena have be identified. Firstly, with the help of online technologies as web analytics and social media monitoring (see chapter 8.2), firms can document habits and preferences of customers (Phippen et al., 2004). Secondly, companies can gently influence the interactions and react to negative mentions, if they monitor what is going on in their web applications (Hassler, 2012; Sterne, 2010). Thirdly, the transformation of intangible assets into tangible, quantifiable figures in a structured way helps firms to focus their resources on those applications which have the greatest chance to acquire a return and to guarantee a long-term success (Gillin & Schwartzman, 2011; Meffert et al., 2008). Fourthly, by having a periodical data analysis, deviation in the monitored figures can be detected in order to identify measures for improvement (Meier & Zumstein, 2013) and to guide decision making (Haberich, 2013). Fifthly, as the efforts for developing, implementing and maintaining web applications can be very high, measurement can give managers the confidence they need to legitimate financial and human investments in online activities as marketing tools (Divol et al., 2012). Lastly, as the achievement of the determined goals can be monitored, the success of the improvement measures can be pursued afterwards (Meier & Zumstein, 2013).
2.3 Conclusion of the situation analysis
3
Case study XX GmbH
3.1 Facts and figures about the XX GmbH
Excluded due to the confidentiality agreement
3.2 Management problem and selection of XX as company case study
This thesis aims at developing a new measurement method based on a single case study about the XX GmbH. A case study approach helps to get an overall understanding of the complexity of the underlying problem (Yin, 2009; Benbasat et al., 1987). Furthermore, case studies are used to study a problem in-depth and in a real-life context (Boyer & Swink, 2008; McCutcheon & Meredith, 1993; Meredith, 1998; Wacker, 1998). The case study is based on an embedded view to validate the results and to support the development of the new measurement method.
This company is sampled because it faces a common, important business problem: Measuring the performance of web applications and thereby quantifying the benefits and costs of online activities as well as justifying their business relevance (Kelly, 2013; Etlinger & Li, 2011; Visible, 2011; Hanna et al., 2011; Hoffman & Fodor, 2010; Mangiuc, 2009; Stelzner, 2012). More precisely, it approaches the novel opportunities offered by the internet ubiquity and developments of modern technologies these days so that it applies various web applications to reach its different target groups. Even though it is crucial to monitor if the return justifies the efforts, so far its online activities are not measured in a uniform way. This missing web measurement is a problem faced by a majority of firms nowadays. Based on a baseline study, supported by eleven expert interviews with the web application managers of XX, three web applications are selected as representative units of analysis to develop a new performance measurement. The interview questions and a list of the interview partners including their positions can be found in Appendix 3 and Appendix 4. The three web applications and their choice will be described in the following.
3.3 Web applications of XX and selection of the units of analysis
Strategic goals and different types of XX’s online activities. XX exemplifies that the various types of online activities can be clustered according to their main objective in three different fields, namely:
Meaning, XX categorizes all its online activities to the strategic goal which is most likely to be fulfilled by the respective web application (see Appendix 5). To guarantee that the newly developed method comprises various types of web applications so that it can be used to measure the performance of different online activities in the end, appropriate web applications are chosen which represent the three strategic objectives of online activities. Therefore, three representative applications are selected which are expected to be strong at fulfilling three different strategic goals. Firstly, the Website (A) which substitutes online activities aiming mainly at information. Secondly, the Online-community (B) which is expected to be strong in engagement and thereby represents web applications aiming at engagement. Thirdly, the Web Shop (C) which is expected to perform well in conversion.
A: Website. On this Website the potential customers can inform themselves about XX’s products, services and the latest news. Therefore, the major strategic objective of “A” is information. This is important as if the customers know the brand and its benefits, a long-term pull effect can be created (Kotler & Pfoertsch, 2010). The relaunched version of this relatively established web application is online since spring 2013. In Appendix 6, the Homepage of the Website is pictured. So far no monitoring took place but it is urgently necessary in order to pursue the relaunch effects.
customers’ loyalty. Besides, members can evaluate posted ideas of others with a “like” and “dislike” button.
C: Web Shop. A web shop is defined as a web-based software system which offers products, receive orders and coordinates payment and delivering modalities (Meier & Zumstein, 2013). The potential customers can order products directly via the online Web Shop. Therefore, the major strategic objective of “C” is conversion. In Appendix 8, a picture of the Web Shop’s landing page is displayed.
3.4 Conclusion of the case study selection
4
Methodology leading to the new web measurement method
4.1 Introduction to the methodology and overview of the research process
[image:21.595.73.526.427.607.2]Research process. The research process of this thesis is based on an iterative combination of theoretical knowledge and practical justification. This approach is used in the design-theory research (e.g. Cole et al. (2005), Hevner et al. (2004), Pries-Heje and Baskerville (2008), Sein et al. (2011)). The goal of this research field is to provide solutions to important business problems (Hevner et al., 2004; Pries-Heje & Baskerville, 2008). Action Design Research goes one step further and aims at generating knowledge which can be applied to solve a common problem, based on a single organizational context (Sein et al., 2011). In this thesis, XX exemplifies the common problem of web performance measurement. In order to design a method which solves the identified problem, an interactive cycle between building/developing and evaluating/justifying is necessary (Hevner, 2007; Pries-Heje & Baskerville, 2008). Sein et al. (2011) provide guidance for this process of building, intervention and evaluation. Based on this suggested process, the research cycles of the thesis are established. An overview of the thesis’s research process is provided in Figure 2 and a timeline is displayed in Appendix 9.
Figure 2: Overview of the iterative research cycle process applied in this thesis
Source: Own illustration based on Pries-Heje and Baskerville (2008) and Sein et al. (2011).
4.2 Data collection methods
Here, it consists of: (1) reviewing company documents and scientific literature, (2) conducting expert interviews, (3) monitoring web data (see green, yellow and orange fields in Figure 2).
Expert interviews. As interview partners, the web application managers of XX have been selected. The choice and the regional scope were recommended by the company supervisors. The interviews were conducted informally, i.e. an outlook invitation for a one hour meeting was sent, including the relevant interview questions. During the meeting the interviewee answered the questions orally and the collected answers were evaluated afterwards. Overall, the three rounds of interviews were conducted in the period of 11th of April until 22nd of July 2013. The respective questions are provided in Appendix 4, Appendix 11 and Appendix 14. In the first interviews, the aim has been firstly, to gain insights into XX’s web applications in order to identify appropriate representatives for different types of online activities and secondly, to identify requirements for a web performance measurement tool (see chapter 5.2). In the second round, especially the preselection of the subgoals and metrics has been adapted and verified (see chapter 6.3.1). In the third round, particularly the weighting system has been justified (see chapter 7). Moreover, all issues were discussed and justified by the company supervisors in regular feedback and status-update meetings.
Literature review. A systematic literature review has been conducted to address three different positions in the research cycles. Details about the literature reviews which served as a theoretical foundation to develop the web scoreboard, will be explained in the respective chapters (for the first literature review see chapter 5.3, for the second see chapter 6.3.1 and for the third see chapter 7). The academic search service “Web of Knowledge” and the bibliographic database “Scopus” as well as “Google Scholar” were used for the literature reviews. The following keywords helped to identify relevant literature for the first, second and third research cycle: performance measurement, performance measurement systems, marketing measurement, performance measurement marketing, web measurement, online measurement, online marketing measurement, internet marketing measurement, Web 2.0, new media, social media, value of social media, effectiveness of social media, web analytics, web metrics, online performance metrics, weighting systems, grading systems, factor weights, evaluation systems, grading models, scoring models. Besides, in the references of the found literature it was also searched for additional relevant publications. The software tool “EndNote” was applied to manage the literature bibliography and the citations.
4.3 Execution of the research cycles
First cycle. In the initial phase, insights resulting from expert interviews as well as generated in a web analytics workshop, were used to identify requirements for a web performance measurement tool. The interviews with eleven web application managers of XX as well as the workshop are further described in chapter 5.2. Besides, to guarantee that the web scoreboard can be used for different web applications in the end, eligible applications needed to be selected which represent various types of online activities. Thus, apart from internal company documents also the first round of expert interviews was used to gain insights about XX’s web applications. The results of this baseline study are explained in chapter 3.3. In the next step, based on the identified requirements, a literature reviewwas conducted in order to evaluate if an existing measurement method can be used to measure web performance (see chapter 5.3). The necessity to develop a new method was verified by the justification of the research gap and because none of the identified existing measurement approaches could fulfill all requirements. Thus, a first alpha version of the web scoreboard was designed.
Second cycle. After the initial structure of the web scoreboard has been set in its first version, an extensive literature review was conducted in order to find appropriate subgoals and metrics as well as to justify the categories and scores of the external and internal perspective. The identified metrics and subgoals have been preselected based on various criteria, resulting in a list of 55 metrics. In the second round of expert interviews, the preselection was evaluated and adapted in order to generate the final list of 38 metrics, displayed in the beta version of the web scoreboard. This second research cycle is described in chapter 6.3.1.
Third cycle. In the next step, existing literature was scanned in order to find adequate approaches to determine appropriate weights and grading intervals. Thereby, an eligible way to interpret the collected data of the web scoreboard was detected. After a weighting and grading system has been designed, it was verified by the company supervisors and web application managers in the third round of the expert interviews. This third research cycle which resulted in the final version of the web scoreboard is explained in chapter 7.
5
Analysis of performance measurement methods – 1
stresearch cycle
5.1 Introduction to performance measurement
Based on the identified management problem, chapter five explains the determination of requirements for a web performance measurement tool by conducting expert interviews and gaining insights from a web analytics workshop. According to those requirements, existing business and marketing performance measurement methods in the off- and online surrounding are investigated. Hereby, the aim is to answer research question number one (see Table 2).
Table 2: Research question which is answered in chapter five
By scanning the existing measurement methods in the literature, three of them – balanced scorecard, marketing dashboard and set of metrics – are detected as the most probable ones to fulfill the previously identified twelve conditions. Thus, they are analyzed in the following in detail. Furthermore, in the conducted literature review the existing measurement techniques are scanned in order to find appropriate elements as a basis for the new tool. Moreover, in this chapter a standardized measurement procedure is ascertained and the “General Electric Matrix” is described in order to provide a holistic theoretical foundation. Overall, answering research question number one contributes to the research aim by identifying what would be an optimal performance measurement method for online activities.
5.2 Requirements for a web performance measurement method
Identification of requirements. Based on the management problem, specific requirements for a web performance measurement method have been identified. Therefore, expert interviews with eleven web application managers of XX were conducted. The interview questions are provided in Appendix 4. Besides, a web analytics workshop with an external agency helped to gain insights into the required measurement tool. Apart from this, the company supervisors were asked about the conditions which a web measurement tool needs to meet. By asking experts in the initial step of the research process, the business problem and need was concretized in specific requirements for a web measurement method.
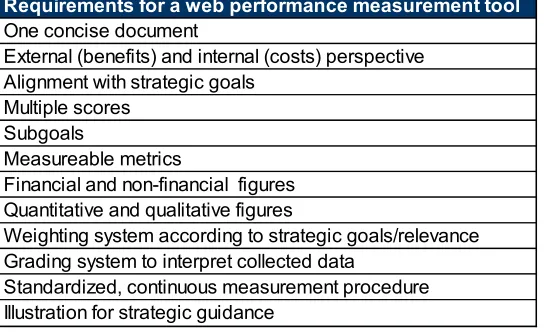
Requirements. In total, twelve requirements for a web performance measurement method have been identified. First of all, the tool needs to consist of understandable, standardized, financial and non-financial, quantitative and qualitative figures. Those precise, measureable,
Research question need to be answered
differently weighted web metrics should enable a monitoring of the determined subgoals. Those subgoals need to be allocated to multiple determined scores. The defined scores should be aligned with the strategic business goals of online activities and represent the external (benefits) as well as the internal (costs) perspective. An appropriate weighting and grading system should help to evaluate and interpret the collected data in an eligible way. Everything needs to be displayed in one concise document. Besides, a standardized measurement process is necessary which can be continuously applied. In addition, the tool should provide the possibility to derive strategic recommendations.
Table 3: Requirements identified in the expert interviews and the web analytics workshop
5.3 Existing performance measurement methods – advantages and limitations
Literature review about existing methods. Based on the direction which was given by the identified requirements, a literature review about existing business and marketing performance measurement systems in the off- and online surrounding was conducted in the next step. This first literature review aimed at different things. Firstly, the identified research gap of a lacking web performance measurement method needed to be justified. Secondly, it was aimed at checking if one of the existing performance measurement systems could fulfill the previous identified requirements. Thirdly, by reviewing existing techniques, basic elements for a new performance measurement tool should be detected.
Selection of examined methods. As the identified research gap already indicated, the amount of scientific measurement tools in the online surrounding was limited. The identified existing performance measurement systems published in the time frame from 1992 – 2013 have been preselected based on the predefined, specific requirements. This resulted in a list of 14 methods which is provided in Appendix 10. By having a closer look to the preselected
Requirements for a web performance measurement tool
One concise document
External (benefits) and internal (costs) perspective Alignment with strategic goals
Multiple scores Subgoals
Measureable metrics
Financial and non-financial figures Quantitative and qualitative figures
Weighting system according to strategic goals/relevance Grading system to interpret collected data
methods, three of them – balanced scorecard, marketing dashboard and set of metrics – seemed to be possible candidates to fulfill the requirements. Apart from a description of the methods, Appendix 10 also states briefly the reasons why the other eleven techniques are not further examined. Besides, by analyzing the methods, several elements which could be used as a basis for the design of a new tool have been detected. The methods might provide valuable input for the required comprehensive structure and performance indicators of a new web measurement method. Thus, the top three candidates with their reasons for selection, their advantages and their possibility to fulfill the conditions are examined in the following.
Balanced scorecard. One of the most influential performance measurement systems is the “balanced scorecard” (Evans, 2004; Marr & Schiuma, 2003).3 It is developed by Kaplan and Norton (1992) and can be transformed to the e-business environment (Van Grembergen & Amelinckx, 2002). Thus, it has been selected for further examination as a possible framework for a web measurement tool. It considers quantitative figures and qualitative variables to guarantee a holistic judgment and balanced perspective of a firm’s performance. It is a modern, comprehensive, capable system which can be adapted flexibly to the specific company requirements (Meffert et al., 2008) and has received significant attention in marketing (Homburg et al., 2012). This approach addresses the problem that the complexity of a firm’s performance cannot be captured in one single performance indicator. Therefore, the system uses a classification into four categories (financial, customer, internal processes, learning and growth (Kaplan & Norton, 1992)) which consist of multiple criteria (Epstein & Manzoni, 1998). A limitation of the balanced scorecard is that it is internally focused and does not take competitors and customers into account. Besides, it is a snapshot of the current situation (Pauwels et al., 2009). Due to those characteristics, it fulfills six out of twelve requirements (see Table 4). Thus, the system is not sufficient as a single web measurement tool but provides valuable basic elements for a new method.
Dashboards. The recently introduced “marketing dashboard” can be defined as a performance management tool that provides managers a consistent overview of the firm’s key marketing metrics to reach organizational goals (Farris et al., 2010; Pauwels et al., 2009; Velcu-Laitinen & Yigitbasioglu, 2012). Dashboards allow “the user to identify, explore, and communicate problem areas that need corrective action” (Yigitbasioglu & Velcu, 2012, p. 4) and thereby support marketers in monitoring, planning, assessing and reporting performance.
3
Besides, dashboards help to handle the increasing complexity of market data (Pauwels et al., 2009) and to solve problems (Velcu-Laitinen & Yigitbasioglu, 2012). Due to those reasons it has been selected to be examined in detail. In comparison to the balanced scorecard, a dashboard builds a bridge between the internal and external perspective by relating the benefits and the costs at one display (Pauwels et al., 2009). To consider both perspectives is important for managers (Bremser & Chung, 2006; Neely et al., 1995). This can be seen as a valuable input for the new method which also should be separated into those two perspectives. Another benefit of a dashboard is that it provides various managers of different departments and locations the chance to measure equally and share the data (Pauwels et al., 2009). Overall, this method fulfills eight out of the twelve required conditions. Thus, it cannot be used as a single web measurement method. However, due to the various advantages and the fact that a common recommendation for managers is to create a dashboard (Farris et al., 2010), dashboards provide precious input for the basic structure of a newly designed method.
Metrics. “Metric” is a term that comes from the Greek language and means “measurement” (Meier & Zumstein, 2013). In general, a metric is a measuring system with standardized figures which facilitates to compare observations (Farris et al., 2010). It is “used to implement strategy, manage operations and track performance over time” (Bremser & Chung, 2006, p. 396). Metrics in the online environment are called “web metrics”. The collection, measurement, analysis and interpretation of web metrics is called “web analytics” and is recently a booming business (Meier & Zumstein, 2013; Weischedel & Huizingh, 2006). Thus, this technique was chosen for further examination. Web metrics enable to measure the performance of web applications (Meier & Zumstein, 2013), to show the user behavior, to uncover potential for improvement (Weischedel & Huizingh, 2006), to compare (Straub et al., 2002) and to audit activities (Phippen et al., 2004). Due to those advantages a set of metrics needs to be determined for a newly designed measurement tool. The measured metrics need to be precise, understandable (Kelly, 2013) and aligned with the strategic goals (MarketingSherpa, 2010) to capture the interest of the managers and executives (Blanchard, 2012). Further, metrics should be weighted according to their relevance (Hassler, 2012). Overall, this technique fulfills seven out of the twelve required conditions. However, the elements and advantages of a set of metrics should be considered in the design process of a new method.
strategic business units (SBUs) or major product lines” (Zhou & Zuo, 2010, p. 120). An enhanced version of this four box “BCG matrix” is the “General Electric Matrix”, also called McKinsey-Portfolio. It consists of nine blocks and has been developed also in the 1970s by the consulting company McKinsey and General Electric. This technique is used in strategy or product management in order to help firms with their product portfolio decisions. Its original version considers industry attractiveness and business strengths but as a variable and multifunctional model it can be configured in various ways (McKinsey, 2008). The general idea behind it is to classify the investigated product or services – as the web applications – according to their performance into nine different fields. Based on this classification three different strategic decisions can be recommended: “Invest”, “Select”, “Divest”. In this thesis the underlying principle of the General Electric Matrix serves as a theoretical foundation and an adjusted version is used to interpret the results of the web performance measurement method (see chapter 8.5).
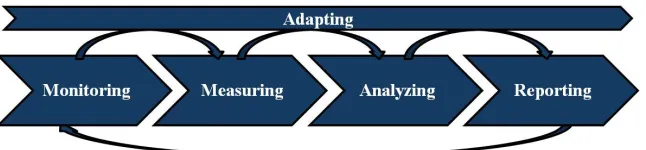
[image:28.595.75.398.614.689.2]Measurement procedure. A standardization of the web measurement process is crucial to be successful in new media (Novak & Hoffman, 1997; Pauwels et al., 2009). Literature identified different issues that need to be undertaken in web measurement. Thus, in the development of a new method it needs to be considered that it enables managers to make five steps (see Figure 3). Firstly, to monitor, meaning to listen goal-oriented, collect and sort measureable data. Secondly, to measure, meaning to transform the collected data into a precise number (Blanchard, 2012). Thirdly, to analyze, meaning to interpret the figures in order to evaluate success and failure and determine the room for improvement (Pauwels et al., 2009). Fourthly, to report, meaning to indicate the results to managers on a periodical basis, optimally with the help of predefined key metrics or KPIs (Phippen et al., 2004). Fifthly, to adapt, meaning to constantly implement the derived improvement measures (Pauwels et al., 2009).
Figure 3: Five steps of a standardized measurement process
5.4 Conclusion – justification to develop a new measurement method
[image:29.595.71.529.428.631.2]Justification of new method. In general, a variety of methods is used to assess performance and various performance measurement systems are proposed in the marketing literature. Each of those techniques has its advantages and drawbacks. Three measurement methods – balanced scorecard, marketing dashboard and set of metrics – have been identified in the literature review as being the methods which are most likely to fulfill the previous detected requirements. They have in common that they contain a set of financial and non-financial figures (Artz, 2010) and summarize the performance of the investigated object in a single, concise document (Epstein & Manzoni, 1998). Nevertheless, none of the existing performance measurement methods reviewed could fulfill all identified requirements (see Table 4). Hereby, research question number one is answered: none of the existing measurement tools is appropriate to measure the performance of different types of web applications. Thus, under consideration of the required issues a new measurement method, labeled “web scoreboard”4 is developed in an exploratory process. This will be explained in detail in the following chapter six.
Table 4: Checklist requirement fulfillment of the top three examined measurement tools
4
The first idea of a web scoreboard was developed by Dr. Efthymios Constantinides (University of Twente) in 2000. Based on the theoretical foundation of the General Electric Matrix the original aim was to develop a performance measurement tool for different types of websites.
Checklist requirements for web measurement tool
Requirements for a web performance measurement tool scorecard ...dash- metrics scoreboard
One concise document
External (benefits) and internal (costs) perspective Alignment with strategic goals
Multiple scores Subgoals
Measureable metrics
Financial and non-financial figures Quantitative and qualitative figures
Weighting system according to strategic goals/relevance Grading system to interpret collected data
Standardized, continuous measurement procedure Illustration for strategic guidance
Appropriate web performance measurement tool
6
Development of a new web performance measurement method – 2
ndresearch cycle
6.1 Introduction to the second research cycle
Chapter five resulted in the finding that a new performance measurement method needs to be developed; this chapter introduces the initial design of the new tool and thereby represents the second research cycle. The determination of the structure and scores used in the new method, labeled “web scoreboard” is explained. Besides, the selection and characteristics of suitable subgoals and metrics are described in detail. Hereby, research question number two (see Table 5) is answered which helps to fulfill the research aim by providing – with an appropriate set of metrics to measure the benefits and costs of different types of web applications – a main part of the newly designed method.
Table 5: Research question which is answered in chapter six
6.2 Structure and categorization of the web scoreboard
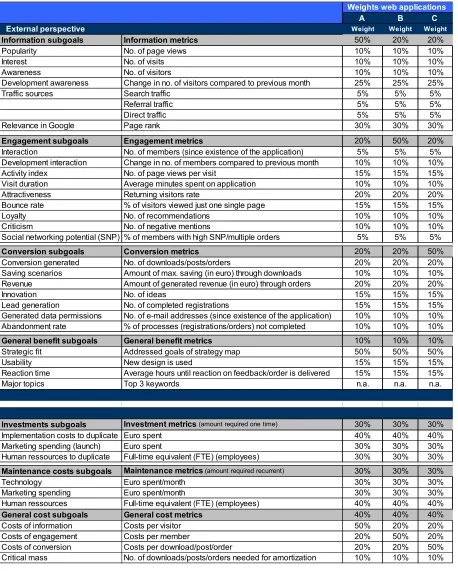
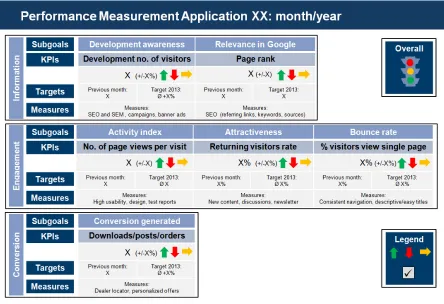
Structure. According to the identified requirements, the new measurement tool, i.e. the web scoreboard, consists of an external perspective illustrating the return and benefits of the web applications and an internal perspective illustrating the investments and costs of the applications. In total seven scores, 36 subgoals and 38 metrics are chosen to measure the performance of online activities. The web scoreboard is set up in a concise Excel file.
External perspective. Defining scores according to the strategic goals of a web application is seen as a reasonable way to structure performance measurement (Evans & King, 1999; Welling & White, 2006a). The scores of the web scoreboard’s external perspective are determined pursuant to the strategic aims of the different types of online activities because the verification of the business relevance can best be done by measuring the contribution to the determined business goals of each web application (Johnson & Misic, 1999). Thus, the resulting scores can be taken to check the goal achievement and thereby to justify the business relevance. Besides, a fourth score is included to address comprehensive objectives:
1) Information; 2) Engagement; 3) Conversion; 4) General benefits
Research question need to be answered
Internal perspective. Additionally to the benefits also information regarding the costs is very important (Mangiuc, 2009). Therefore, the internal perspective of the web scoreboard is classified according to the expenses incurred with applying an online activity.
1) Investments; 2) Maintenance; 3) General costs
Those categories are defined as scores. Based on this, recommendations might be given how much efforts are needed to apply an application not just in the initial phase but also over time.
Scores. Scores are judged in literature as a good way to guarantee an overview of the results and to ease the measurement process, especially for management reporting. Further, it is recommended that the scores are broken down in subgoals and measurable metrics which are weighted differently (Hassler, 2012). Thus, also the determined scores of the web scoreboard are broken down in subgoals. To enable the monitoring of those subgoals appropriate, measureable metrics are selected which are represented by financial and non-financial, quantitative and qualitative figures. The selection is explained in the following.
6.3 Subgoals and metrics of the web scoreboard
6.3.1 Selection of metrics based on a literature review and expert interviews
another 17 metrics (see Appendix 12) have been removed. This selection process which combines theory and practice, represents the second research cycle of this thesis and its outcome is the beta version of the web scoreboard.
Table 6: Overview of the literature used to identify a set of relevant metrics
In general, the literature review showed that a lot of Web 2.0 applications, e.g. online-communities and web shops, can be analyzed with the same metrics like Web 1.0 activities, e.g. websites. However, as it comes to specific requirements, additional metrics need to be monitored (Hassler, 2012). This leads to the fact that some of the metrics cannot be monitored for each web application as they measure a specific feature of a particular type of web application. Finally, each selected subgoal and metric is explained in the following. Here specific attention is given to the special attributes of websites, online-communities and web shops as those types of web applications are selected to develop and test the newly designed method. If specific information or an illustration of more complex metrics is necessary, the three units of analysis are exemplified representatively.
Authors Year Topic Type of source
Bremser & Chung 2006 Provide a framework for developing performance measurement metrics for e-business Journal Article
BVDW 2013 Provides metrics to measure social media performance Report
Dickinger & Stangl 2011 Suggest a formative approach with eight dimensions to measure website performance Journal Article
Divol et al. 2012 Provide metrics to measure social media performance Journal Article
Evans & King 1999 Provides metrics to measure website performance Journal Article
Evanschitzky et al. 2004 Provide metrics to measure e-business performance Journal Article
Farris et al. 2010 Provide metrics to measure marketing performance Book
Gillin & Schwartzman 2011 Provide metrics to measure social media performance and how they can be measured Book
Happe 2008 Provides metrics to measure social media performance Webpage
Hassler 2012 Provides metrics to measure websites and classifies them in four dimensions Book
Hoffman & Fodor 2010 Provide metrics (based on the steps of the brand funnel) to measure social media ROI Journal Article
Huizingh 2002 Provides metrics to measure website performance Journal Article
Hung & McQuenn 2004 Provide metrics to measure e-business performance Journal Article
Kelly 2013 Provides metrics to measure social media performance Book
Lovett 2011 Provides metrics to measure social media performance Book
MarketingSherpa 2013 Provides metrics to measure e-business performance Webpage
Meffert et al. 2008 Provide metrics to measure marketing performance Book
Meier & Zumstein 2013 Provide metrics to measure website performance and classifies them in four dimensions Book
Metrics 2013 Provides metrics to measure website performance Webpage
Phippen et al. 2004 Provide metrics to measure website performance Journal Article
Qualman 2011 Provides metrics to measure social media performance Book
Sterne 2010 Provides metrics to measure social media performance Book
Turner & Shah 2011 Provide metrics to measure social media performance Book
Van der Heijden 2003 Provides metrics to measure website performance Journal Article
Visible 2012 Defines the Top 7 metrics to measure social media ROI Electronic Article
Welling & White 2006 Review literature (27 studies) on the website measurement Journal Article
Wolfinbarger & Gillin 2001 Provide metrics to measure e-business performance Journal Article
6.3.2 Subgoals and metrics of web scoreboard’s external perspective
Information score and its respective subgoals and metrics.
a) Popularity measured by number of page views:
Page views, also called page impressions, is defined as each call up of a page done by a visitor. The number of page views displays the traffic of a web application (Visible, 2012; Divol et al., 2012) and measures its popularity (Hassler, 2012; Sterne, 2010).
b) Interest measured by number of visits:
Visits are defined as “the number of times individuals request a page on the firm’s server for the first time” (Farris et al., 2010, p. 328). One visit is set-up as 30 minutes time span (Hassler, 2012) and measures the customers’ interest (Hoffman & Fodor, 2010).
c) Awareness measured by number of visitors (Visible, 2012):
Visitors are counted as “the number of individuals requesting pages from the firm’s server during a given period” (Farris et al., 2010, p. 328) and often are identified by the usage of cookies (Hassler, 2012). This metric helps to give answer about the awareness which is the “percentage of total population that is aware of the brand” (Farris et al., 2010, p. 30) and the first step on the way to a profitable customer experience.
d) Development awareness measured by change in number of visitors compared to previous month:
One of the major goals of marketing is to increase the brand awareness (Kelly, 2013). To pursue the development of awareness is crucial because the trend line is often more significant than the absolute number (Hassler, 2012; Sterne, 2010).
e) Traffic sources measured by search traffic, referral traffic and direct traffic:
For a marketer it is important to know where the traffic of a web application comes from (Gillin & Schwartzman, 2011; Metrics, 2013). In general, traffic sources are classified in three categories: search traffic, referral traffic and direct traffic. As the objective of a web application is to keep a balance between those three traffic sources (Metrics, 2013), it is important to look at all of them. Firstly, search traffic is the traffic that is generated when people use a search engine as Google, Yahoo or Bing to access a web application
web application] via an inbound link”5 (Gillin & Schwartzman, 2011, p. 82). Thirdly, direct traffic is generated by users typing the URL of the web application into a web browser (Metrics, 2013) or coming from an e-mail link (Gillin & Schwartzman, 2011). A high percentage of direct traffic means that a web application is memorable and the brand is strong (Hassler, 2012). This is especially important for interactive web applications like online-communities which need returning, active members. Nevertheless, it always needs to be considered that in the long-run new visitors are essential (Metrics, 2013).
f) Relevance in Google measured by page rank:
The page rank is available for homepages and single web pages and is determined by Google on a scale between one to ten (Hassler, 2012) by analyzing various factors in an unpublished algorithm (Gillin & Schwartzman, 2011). Google is the major source for search engine traffic (Metrics, 2013). Therefore, the relevance in this search engine
measured by the page rank is crucial for the success of a web application as it is one major influencing factor on how easy it is found by internet users (Hassler, 2012).
Engagement score and its respective subgoals and metrics.
a) Interaction measured by number of members (since the existence of the application): The number of members is a valuable metric for interaction (Lovett, 2011; Sterne, 2010) as it shows the number of users who are interested in a relationship with the company. The number of members is measured in total, meaning how many members are counted since the existence of the application. For a website this figure is not available. In an online-community a member is a user who registered successfully. A web shop counts those users who registered successfully for a customer account to buy products.
b) Development of interaction measured by change in number of members compared to previous month:
Aside from the overall number of members the member development is measured. This is done because persistently pursue the trend line is essential as the progress is more
significant than the absolute number of actual members (Sterne, 2010). c) Activity index measured by number of page views per visit:
Page views per visit is a useful indicator for engagement (Gillin & Schwartzman, 2011; Sterne, 2010) because it shows how profound a visitor uses a web application and how
5