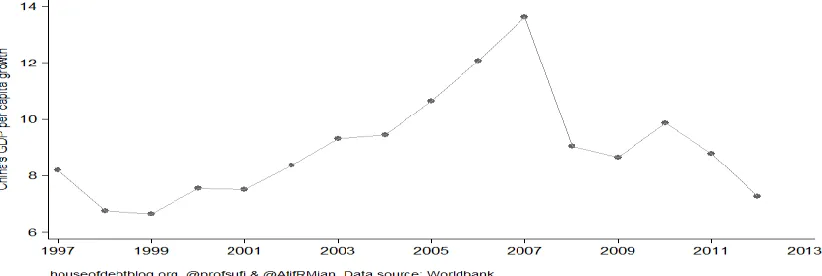
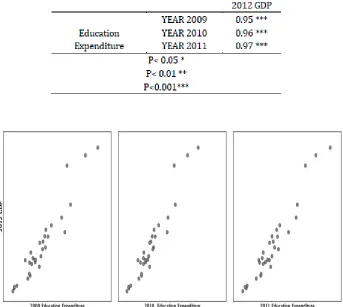
Education Investment and Economic Returns in 2010 2012 China
Full text
Figure


Related documents
Time series and tabulated average values of mechanical thrust, power, torque, and rotational speed as well as electrical variables of generator power, electromagnetic torque,
So far researchers of this study know that there is no rich study which has been conducted yet covering the understanding of existing image of Sea beach
Confidence intervals provide information about the range of values of the slope consistent with our data.. This is much more useful than simply using the
Ellipsis, Head, Tail, Filler, Backchannel, Phrasal Chunk.. Q1) Why teach Spoken grammar?.. - Help speakers and listeners
In this study, time of neck pain onset was not associated with the pain related disability six months after a car collision when neck pain intensity at baseline was included as
terms available at
The findings revealed that potential consumers base their decisions on posted reviews; they are exposed to negative reviews that affect their purchase decisions, incoherently to
We evaluated students’ performance on these assignments, using an adapted version of the Association of American College & Universities (AACU) Information Literacy VALUE Rubric
