Mapping What They Know: Concept Maps as an Effective
Tool for Assessing Students’ Systems Thinking
Jaklin Tripto, Orit Ben-Zvi Assaraf, Miriam Amit
Department of Science and Technology Education, Ben Gurion University of the Negev, Beer Sheva, Israel Email: [email protected]
Received December 1, 2012; revised January 2, 2013; accepted January 15,2013
ABSTRACT
In 2006 a new biology curriculum called “Human Biology: Emphasizing the Role of Homeostasis” was introduced into the Israeli high school system. Complex systems like those that make up the human body have become increasingly important as a focus of high school education. This study examines the effectiveness of the concept map as a assess- ment tool for students’ systems thinking, a tool that provides researchers with a detailed picture of the systems thinking development taking place within individual students. The content of the students’ concept maps was translated into in- formation about students’ system thinking using the Systems Thinking Hierarchy (STH) model, a model in which sys- tem thinking is categorized according to eight hierarchical characteristics or abilities. The goal was to use the maps to characterize Israeli high school students’ understanding of the body’s systemic nature. To do this, we identified the ex- tent to which the students understand three central elements of systems, namely hierarchy, homeostasis, and dynamism, and then analyzed this understanding according to its place within the hierarchical stages of the STH model. The exten- sive qualitative data analysis of 48 concept maps made by 11th grade biology majors suggest that the strength of the concept map is in its ability to describe the first two levels of system thinking (analysis and synthesis). However, it proved less successful in eliciting evidence of the third and highest level, particularly of students’ understanding of pat- terns, of homeostasis and their capacity for temporal thinking.
Keywords: Human Body System; Systems Thinking; Concept Map
1. Introduction
Systems in Science Education Today
In 2006 a new biology curriculum called “Human Biol- ogy: Emphasizing the Role of Homeostasis” was intro- duced into the Israeli high school system. One of the ar- guments against the previous curriculum was that it taught human biology as separate components, which led to compartmentalized learning. As [1] has noted, to un- derstand (biological) systems we must “shift our notion of ‘what to look for’ in biology from a mere examination of the system’s components, to an understanding of its structure and dynamics. This is due to the fact that a sys- tem is not just an assembly of genes and proteins; its properties cannot be fully understood merely by drawing diagrams of their interconnections” (p. 1662). It was thought that unifying human biology around homeostasis would provide students with a more complete picture of the human body, allowing them to integrate its multiple components. Homeostasis also enables a deeper under- standing of the complexity of the human body, as it ex- plains both the interactions between the body and its en- vironment, and the processes that occur on its different
organizational levels.
when the only interactions that exist in a system are among its individual elements, important macroscopic descriptions can still be applied to the system as a whole and are critical for understanding its patterns; d) system- level patterns can emerge without any force explicitly striving for the pattern, through the self-organized activ- ity of many interacting elements; and e) the same system pattern can often be found in diverse domains, and it is useful to describe systems in sufficiently general terms such that these commonalities can be revealed [8].
The innovation of our study was in its use of concept maps as a tool with which to characterize, in the best and fullest possible way, students’ system thinking [9]. It also stands out in the relatively large size of its population (48) and in the advanced state of their biology studies. Through an extensive analysis of their concept maps, this study assessed the system thinking of a large group of high school biology majors-students who have completed two years of extended biology studies that include in- depth study and discussion of the human body. Their curriculum was based on a systems approach; it included concepts on both the macro and the micro levels, and at this point in their studies the students are expected to make connections between the two, and to understand the importance of the human body as a system. In this article we summarize our results and use them to assess the overall benefits and limitations of the concept map as a tool for teaching and assessing students’ system thinking.
2. Theoretical Background
2.1. The Body as a Biological System
Biological knowledge of the human body consists of a wide variety of facts and principles. Nevertheless, in the context of systems this multitude is customarily centered upon the following three system characteristics: a) hier- archy, b) homeostasis, and c) dynamism. Thus, it is ref- erences to these specific elements (defined below) that we look for in our analysis of students’ system compre- hension.
Hierarchy—To understand biological systems, stu-dents must comprehend their levels of organization, since a system is characterized by hierarchies and it is impossi- ble to understand one organization level without under- standing the level beneath it [10]. Such hierarchies have two general relationships: between the macro and micro [11,12] and between different levels in the hierarchy of the human body [13]. Kresh (2006) describes the rela- tionships between systems and their components in terms of a dual status, pointing out that a living system’s com- ponents also function at the same time as “subwholes”, i.e. smaller, complete systems in themselves. Thus, at any given time, entities within the hierarchical structure of life (from microscopic entities such as cells and mole-
cules, to larger ones such as organs, families and tribes) exist both as “dependent parts” of a larger system, and as “independent wholes” with subordinated parts of their own (p. 6) [14]. This means that to understand biosys- tems one must refer to interactions occurring both be- tween the system’s parts and between various systems.
Homeostasis—refers both to the maintenance of a sta- ble internal environment and to the regulatory processes (operating via feedback) leading to that stability, and these meanings can be difficult to assimilate for many students. Understanding homeostasis is difficult because some processes are hidden to the eye and/or involve dy- namic perception [15,16]. For example, preserving sta- bility is (partly) based on temperature regulation. Thus, students know that when it is hot we perspire (i.e. they are aware of the proximate reason leading to the change), but the physiological processes responsible for this result are more difficult to visualize and comprehend [17].
Dynamism—Hmelo-Silver, Holton, & Kolodner (2000) and Whitner (1985) define a dynamic system as a coher- ent whole comprised of components interacting with each other both within single systems and between sys- tems. The mechanism responsible for this interaction is based upon matter transportation between all the levels of a body’s hierarchy from the single cells to the entire body. Moreover, [18] also raises the importance of syn- ergic properties of a system, which emerge from the sys- tem’s dynamic nature. Wilson (2006) suggests that a major obstacle to dynamic thinking is connected to the ability to follow matter as it is transported through a sys- tem [19]. Even college students find it difficult to under- stand this process in plants, which prevents a basic com- prehension of photosynthesis. Additionally, [20] have re- ported a lack of understanding about genetic systems amongst high school students stemming from their in- ability to relate to causal/mechanistic explanations.
2.2. Understanding Complex Systems—Problems and Solutions
As the complexities and difficulties described above show understanding the structural and behavioral aspects of complex systems is a challenging intellectual endeavor for both scientists and science students [2]. Teachers too have become increasingly aware of both the importance of studying complex systems and the difficulty students have in understanding them, and several methods have consequently been developed for improving the accom- plishments of students in this area. Studies suggest that the main difficulty of systems learning is the significant effect of individuals’ prior knowledge on learning out- comes, both quantitatively and qualitatively [20-23]. Computer based simulations of complex phenomena are becoming an increasingly common method of generating
within students the necessary prior knowledge of what a system is and how it works [24]. Computer simulations have many distinct advantages when it comes to ac- quainting students with the basic components, functions and behaviors that make up a system. In a simulation, the learner is presented with and explores a sophisticated model (built by an expert) of a subject domain, and can adjust various parameters of the model and explore the consequences of these changes to the system as a whole in an immediate and visible manner generally unavail- able in “real” systems outside the classroom. While the ability to run simulations (or pre-built models) interac- tively is a vast improvement over static textbook-based learning with its emphasis on formulae and the manipu- lation of mathematical tokens, [25] has pointed out that they do have some limitations too. For instance, systems designed for computer models by experts and the causes and effects the systems present are “channeled” accord- ing to the phenomenon these experts wish to stress. Without access to the underlying structures controlling the system as a whole (but only to specific causes and effects) learners cannot explore the implications of chang- ing these structures on the behavior of the system. A central conjecture of Shore’s research is that for learn- ers to make powerful use of models, they must first build their own models and design their own investigations [25]. A number of powerful computer modeling envi- ronments have been designed to address this idea and support users in building their own useful models (e.g., STELLA—[26,27], Starlogo—[28,29], Agentsheets— [30], KidSim—[31] STELLA—a Structural Thinking, Experiential Learning Laboratory with Animation [26] is a modeling environment in which learners can both build and manipulate system models. Another program that enables modeling for dealing with understanding com- plex systems is NetLogo. NetLogo [32] is a modeling language and environment that supports creating, ex- ploring and analyzing agent-based models, exploring models of chemical systems, which integrate multiple re- presentations (visual representations of both the micro- and macro-levels and symbolic representation of its pro- perties) [33-37].
Working to design various approaches to computer- ized learning environments has brought forth a need for a more general consensus as to the basic conceptual frame- work through which we wish to present systems to stu- dents. One idea for such a framework is the Systems Thinking Hierarchy (STH) model developed by [9]. This is the model we used to assess students’ understanding of systems. Ben-Zvi Assaraf & Orion (2005) suggested that thinking about and understanding a system can be cate- gorized according to eight hierarchical characteristics or abilities, which are evinced by students in an ascending order [9]. These eight characteristics compose the STH
model, which was developed following a study of 8th grade students. The model’s characteristics are arranged in ascending order of advancement into three sequential levels: 1) analyzing the system components (characteris- tic 1); 2) synthesizing system components (2, 3, 4, 5); and 3) implementation (6, 7, 8). Each lower level is the basis for developing the next level’s thinking skills.
The characteristics are as follows (for examples spe- cific to human body systems, see Appendix 1):
1) Identifying the components and processes of a sys-tem (level A);
2) Identifying simple relationships among a system’s components (level B);
3) Identifying dynamic relationships within the system (level B);
4) Organizing the systems’ components, processes, and their interactions, within a framework of relationships (level B);
5) Identifying matter and energy cycles within the sys- tem (level B);
6) Recognizing hidden dimensions of the system (i.e. understanding phenomena through patterns and interrela- tionships not readily seen) (level C);
7) Making generalizations about a system and identi- fying patterns (i.e. a) Hierarchy b) Homeostasis c) Dy- namism—matter transitions) (level C);
8) Thinking temporally (i.e. employing retrospection and prediction) (level C).
2.3. Concept Maps as a Research Tool in Science Education
Concept maps are graphical tools for organizing and representing knowledge. They are one of several tech- niques recommended by National Science Education Standards to promote student thinking, because “Students need opportunities to present their abilities and under- standing and to use the knowledge and language of sci- ence to communicate scientific explanations and ideas” [38]. Concept maps were developed in 1972 in the course of Novak’s research program at Cornell, where he sought to follow and understand changes in children’s knowl- edge of science, but found it difficult to identify specific changes in the children’s understanding of science con- cepts using only interview transcripts [39]. The necessity of finding a better way to represent children’s conceptual understanding led to the idea of representing children’s knowledge in the form of a concept map. Thus was born a new tool not only for use in research, but also for many other uses.
sist of spatially grouped nodes with key-words representing concepts, connection lines representing the semantic con- nection of concepts, labels on the connection lines to specify the kind of the semantic connection, and arrows on the connection lines to specify the directions of the relationships or to guide the reader through the map [41]. In this manner, concept maps function as an external net- work-like representation of students’ knowledge struc- tures.
The use of concept mapping is often linked to the “constructivist” view of learning, since a concept map makes a good starting-point for constructivist teaching. Hmelo-Silver & Azevedo (2006), for example, claim that in order to think systematically, students must be “scaf- folded” for systems thinking [42]. Ben-Zvi Assaraf & Orion (2010) emphasize that to do this we must first gain insight into how students may best be “scaffolded”, and into how their domain knowledge relates to their models of system thinking [43]. In this they echo [5] and [12], who also raise the question of what prior knowledge should be in place before we begin to engage students in the exploration of emergent systems. In this context, concept maps can be a powerful tool for researchers, providing them with this sought-after prerequisite infor- mation about what students’ know and how they think. For example, by identifying misconceptions and recog- nizing different learning styles, concept maps allows researchers to examine the way learners restructure their knowledge [40,44-46]. Because concept maps focus on the structure and the links that the student perceives, mapping is a means of eliciting the relationships that each student perceives among concepts [47,48].
In addition to being a means of assessment, concepts maps can also actively promote students’ learning and knowledge intergration. Novak & Gowin (1984) argued that writing concept maps leads students to increase the precision of their understanding of the concepts [40]. Since concept maps represent frameworks or models that people use to organize their knowledge [49], they can highlight commonalities across different domains, or in this case, different systems [50]. Therefore, they may support learning by guiding students to see the common frameworks in different problem domains. In complex learning systems, conceptual representations can improve understanding of the interrelationships in the system by highlighting key aspects.
2.4. Concept Maps as a Tool for Identifying and Assessing Systems Thinking
Several science education studies have used pre and post instructional CMs to assess students’ conceptual under- standing [44,51,52]. Cognitive mapping and systems thinking share the properties of structure, dynamism and
hierarchy, and research indicates that increases in the number of concepts, connections and diversity in CMs are a reliable parameter for gauging students’ systemic thinking [47,52]. In Biology science education [53], who investigated how students using concept maps under- stood the topic of blood sugar levels, reported that stu- dents comprehended the macro level better than they did the micro level. In another study, Concept Maps were used to characterize the system thinking skills among students in 10th grade in the context of human body, with similar results [54]. In the Earth science education litera- ture, several previous studies used pre and post instruct- tional concept maps to assess students’ conceptual un- derstanding of natural systems. Related examples include [18], who studied marine life; [52], who studied the Wa- ter cycle; [55], on the interactions between polar Earth systems and [49], who studied global atmospheric chan- ge.
In addition to reflecting students’ system thinking, concept maps have also been shown to facilitate that learning complex systems. Odom & Kelly (2000), for instance, explored the effectiveness of concept mapping, expository instruction, and a combination concept map- ping/learning cycle in promoting conceptual understand- ing of diffusion and osmosis [56]. Similarly, [57] tested the effect of concept map construction on conceptual understanding in college chemistry laboratories. The au- thors reported that students had a strong positive attitude towards using concept maps for a better understanding of chemistry laboratory concepts.
3. Research Goals
The goal of this paper is to characterize the concept map as a tool to test system thinking in the context of the hu- man body. To do this, I will identify (by means of the concept map) the extent to which the students understand the three central elements described above (hierarchy, homeostasis, dynamism), analyzing the data produced by the maps using the hierarchical stages of the STH model.
The primary research question below is broken down into three more specific research questions, correspond- ing to the three levels of the STH model:
a) How—according to their concept maps—are the different components of the STH model manifested amongst high school biology students?
b) How and to what extent do the students identify the components and processes that exist in the human body system?
c) How and to what extent do the students identify dynamic relations within the system?
d) How and to what extent do the students generalize, identify patterns in the system, and identify the hidden and time dimensions of the system?
4. Experimental Design & Methods
4.1. Research Population
The research population consisted of 48 11th grade boil- ogy students (boys and girls). It was homogenous to the extent that all of the students were studying for a ma- triculation diploma, but its cultural and social-economic background varied from a medium to a high social-eco- nomic class. All of these students studied the same cur- riculum, since Israel has a centralized education system. The biology syllabus for this age group centers around a curriculum entitled “Biology of the Human Body” (em- phasizing homeostasis) through a system approach. It includes three subtopics:
Homeostasis;
The cell;
Ecological systems;
The students were given the concept map assignment when they had completed all three subjects.
4.2. Methods and Tools
Making the concept maps involved the following three stages: First, the students were asked to write 15 con- cepts and associate each with words related to the human body. Second, the students were asked to connect, within any single sentence, two concepts. They could use the same concept more than once. Third, students were asked to make a new concept map concerning the human body.
We used the analysis of the students’ concept maps to look for the following system thinking components: the ability to identify the system’s components and processes (reflected by the number of concepts in the map and the presence of the different human body systems among these concepts); The ability to identify dynamic rela- tionships within the system (reflected in the number of linkages); the ability to organize components and place them within a framework of relationships (reflected in the number of represented generalization concepts, which reflect a more holistic perception of the system using a concept map); the number of macro level elements rep- resented; the number of micro level elements represented; the representation of retrospection and prediction. Our analysis was validated by the judgment of two additional experts in the field of science education.
Appendix 1 shows a step-by-step description of how concept maps can be read as indicators of system think- ing, based on the correlation of their contents to the STH model. The description is divided according to the mod- el’s three basic levels, and further subdivided into the model’s eight individual characteristics. (Note: The fifth characteristic “identifying matter and energy cycles” is not featured here, as it is not relevant to human body systems.)
5. Results
The results are organized around the three research ques- tions (which also reflect the three levels of the STH thinking model). They relate how each component of the system thinking model was expressed in the students’ concept maps, using concrete examples from two repre- sentative concept maps belonging to students Tami and Eli.
5.1. Level A
The ability to identify the components of a system and the processes within the system: The data from the con- cept maps showed that the students focused overwhelm- ingly on concepts relating to the body’s structure, with 741 of a total 922 concepts referring to structure and only 181 referring to process. Furthermore, the distribution of the concepts within the structure category showed that a great many of the total 741 concepts related to structures on the Structures level, such as “lungs” or “heart” (num- bering 257 in all). Structures on the molecular level, like “oxygen” and “glucose” were also well represented (at 233). Far less prominent was the Cell level (i.e. concepts like “cell” and “nucleus”) and the Systems level (“diges- tive system,” “respiratory system”), which numbered only 118 and 108 concepts respectively, and the Tissue level with only 50 concepts. Most of the components mentioned on Tami’s map are at the structure level, and references to micro elements are less prominent. In Eli’s map, however, half of concepts refer to the structure level while the cell level is not represented at all.
The connections between the concepts were also di- vided into those that referred to processes (e.g. “insulin is secreted by the pancreas”) and those that were essentially descriptive (for example “the circulatory system includes the heart”). Out of a total 1021 connections, 448 fell into the former category, and 573 belonged to the latter.
5.2. Level B
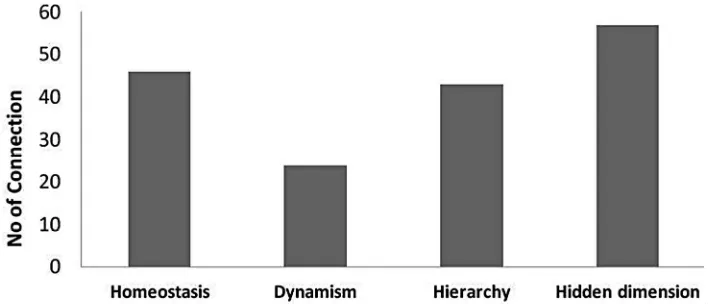
AJOR meostasis, dynamism) were distributed as follows: Ho- meostasis was the most prominent of the three (46 con- nections), constituting general descriptions of the body’s inner stability (such as “some homeostasis regulates wa- ter”) (Appendix 1). Hierarchy was next with 43 connec- tions, which included statements like “the human body is composed of body systems” (Appendix 1). Dynamism was rarest of the three, with only 24 connections (Ap- pendix 1).
but—unlike Eli’s map—it includes no references to mat- ter transmission (Appendix 1).
On the whole, our analysis revealed 279 junctions, with an average of 6 per map. A comparison between Eli and Tami’s maps shows that though the number of con- cepts in Tami’s map is a high 51 to Eli’s 21, the number of junctions is much closer (11 in Tami’s vs 10 in Eli’s). Eli’s map presents a well-branched system of connec- tions (Figures 1 and 2).
6. Discussion and Conclusions
5.3. Level CThe goal of this study was to assess the effectiveness of the concept map as a tool to test system thinking in the context of the human body. Systems thinking is an essen- tial skill in learning biology. Our results indicate the many difficulties students have in forming a holistic un- derstanding of the human body. The nature of these dif- ficulties is reflected by the concept maps, through the conclusions that may be drawn from how the students characterized the human body as a system—their choices and their limitations—especially regarding the properties The ability to recognize hidden dimensions of the sys-
[image:6.595.107.493.359.539.2]tem—to understand natural phenomena; (7) The ability to make generalizations (and identify patterns)—to solve problems based on understanding systems’ mechanisms. (8) The ability to think temporally (no evidence of this found in these maps). Of the 448 connections referring to processes, 57 referred to the human body systems’ hid- den dimensions (for example, “carbon dioxide is a pro- duct of cellular respiration”) (Appendix 1). References to the three system patterns we identified (hierarchy, ho-
Figure 1. The distribution students of abilities in identifying the components in the human body system (N = 741).
Figure 2. The distribution of student’s abilities in generalizing and identifying patterns in the human body system (N = 170).
[image:6.595.121.475.565.717.2]that involve higher levels of thinking. In addition to re- vealing students’ difficulties, the maps reflect the role that students’ domain knowledge plays in their under- standing of dynamic systems. Though students may pos- sess considerable domain knowledge, they do not neces- sarily possess the ways of thinking that can help them use it to analyze phenomena appropriately. Concept map analysis can provide insight into which elements of the domain knowledge students acquire throughout their bio- logy education is successfully “put to use” in their under- standing of complex systems, and how this application comes about. Based on our results, the strength of the concept map is in its ability to describe the first two lev- els of system thinking (analysis and synthesis). How- ever, it proved less successful in eliciting evidence of the third and highest level, particularly of students’ under- standing of patterns, of homeostasis and their capacity for temporal thinking.
The students’ concept maps emphasized the systems’ structural components (most at the organ level) over the processes taking place within that system, likely because these were more difficult to grasp. This result is similar to both [42] and [21] who also noted students’ tendency to concentrate on system parts, with little understanding of the way such parts interact within the system. In hu- man biology, phenomena are interconnected at the ana- tomical, physiological and biochemical levels. This means that systemic thinking must account for these in- terconnections and the underlying mechanisms that drive a system [58]. Our subjects, however, had great difficulty in describing the mechanisms underlying the interactions between body components. Understanding mechanisms requires that a subject connect at least three components in a web of interaction, unlike processes, which can con- nect as few as two components. Possibly, the emphasis placed on learning structure and processes without ex- plicit connections to mechanisms may create difficulties for students in integrating mechanisms into their con- ceptual structure [4,59].
The maps also showed that students had difficulty representing the dynamic nature of the human body. This difficulty has been recorded by other researchers as well, and may stem from the fact that their studies rarely ex- pose them to the dynamic nature of a system, but mainly to its structures [60]. Others cite the high level of ab- straction required to understand the dynamism of sys- tems, due to the fact that their microscopic-and therefore not easily visible-level of their interactions [13,61].
Our subjects’ concept maps barely mentioned “ho- meostasis” in their explanations—a result that also agree with those of other studies. These show that, due to its complexity, homeostasis is difficult to understand for students from high school to university age [15,62,63]. Simply put, homeostasis requires one to comprehend
several processes taking place simultaneously, while re- lating each to the other. Studies attempting to discover the reason homeostasis poses such a challenge have con- cluded that understanding the mechanisms that maintain a stable inner environment is beyond an individual’s life experience, and requires abstract thinking. The ability to think abstractly is in turn based on the capacity to achi- eve a certain level of higher order thinking. Indeed, [15] found a correlation between students’ cognitive level and the extent to which they were able to comprehend ho- meostasis. Understanding homeostasis requires several cognitive abilities, such as discerning that multiple phe- nomena occur simultaneously and comprehending that every process is comprised of several stages. It is worth noting, however, that concept maps are not necessarily well suited to reveal this pattern, because it cannot be expressed through statements derived from the combina- tion of only two concepts. It therefore only appears if students explicitly mention the term “homeostasis”, or processes clearly related to it, like “sugar regulation” or “water volume regulation”.
Both Eli and Tami’s maps lack an expression of think- ing within the time dimension. Thinking temporally is based on the ability to make predictions, and to think retrospectively [64]. For example, one of the problems that the subjects addressed in this program was eating disorders. Coping with eating disorders requires an abil- ity to think temporally, since it connects processes that occurred in the past to their continuing effects on the body in future. This level of thinking requires an aware- ness of interactions upon a timeline, and an understand- ing of how processes develop over time. Concept maps may not be suited to representing this particular ability, and accurately assessing and representing it will there- fore require the addition and integration of narrative qualitative research tools such as interviews.
REFERENCES
[1] H. Kitano, “Systems Biology: A Brief Overview,” Sci- ence, Vol. 295, No. 5560, 2002, pp. 1662-1664.
doi:10.1126/science.1069492
[2] M, J. Jacobson and U. Wilensky, “Complex Systems in Education: Scientific and Educational Importance and Implications for the Learning Sciences,” Learning Sci- ences, Vol. 15, No. 1, 2006, pp. 11-34.
doi:10.1207/s15327809jls1501_4
[3] R. Lesh, “Modeling Students Modeling Abilities: The Teaching and Learning of Complex Systems in Educa- tion,” Learning Sciences, Vol. 15, No. 1, 2006, pp. 45-52. doi:10.1207/s15327809jls1501_6
[4] R. P. Verhoeff, A. J. Waarlo and K. T. Boersma, “Sys- tems Modelling and the Development of Coherent Un- derstanding of Cell Biology,” Science Education, Vol. 30, No. 4, 2008, pp. 543-568.
[5] Y. Kali, N. Orion and B. Eylon, “The Effect of Knowl- edge Integration Activities on Students’ Perception of the Earth’s Crust as a Cyclic System,” Science Teaching, Vol. 40, No. 6, 2003, pp. 545-565. doi:10.1002/tea.10096 [6] L. Tran, “Children and Adults’ Understanding of Ocean
and Climate Sciences,” 2009.
http://www7.nationalacademies.org/bose/NOAA_Educati on_Review_Homepage.html
[7] M. Chi, “Commonsense Conceptions of Emergent Proc- esses: Why Some Misconceptions Are Robust,” Learning Sciences, Vol. 14, No. 2, 2005, pp. 161-199.
doi:10.1207/s15327809jls1402_1
[8] R. L. Goldstone and U. Wilensky, “Promoting Transfer by Grounding Complex Systems Principles,” Learning Sciences, Vol. 17, No. 4, 2008, pp. 465-516.
doi:10.1080/10508400802394898
[9] O. Ben-Zvi Assaraf and N. Orion, “Development of Sys- tem Thinking Skills in the Context of Earth System Edu- cation,” Science Teaching, Vol. 42, No. 5, 2005, pp. 518- 560. doi:10.1002/tea.20061
[10] M. C. P. J. Knipples, “Coping with the Abstract and Complex Nature of Genetics in Biology Education: The Yo-Yo Teaching and Learning Strategy,” CD-[beta] Press, Utrecht, 2002.
[11] R. G. Duncan and B. J. Reiser, “Reasoning across Onto- logically Distinct Levels: Students’ Understandings of Molecular Genetics,” Science Teaching, Vol. 44, No. 7, 2007, pp. 938-959. doi:10.1002/tea.20186
[12] D. A. Penner, “Explaining Systems Investigating Middle School Students’ Understanding of Emergent Phenom- ena,” Science Teaching, Vol. 37, No. 8, 2000, pp. 784- 806.
doi:10.1002/1098-2736(200010)37:8<784::AID-TEA3>3 .0.CO;2-E
[13] C. E. Hmelo-Silver, D. L. Holton and J. L. Kolodner, “Designing Learning about Complex Systems,” Learning Science, Vol. 9, No. 1, 2000, pp. 247-298.
[14] J. Y. Kresh, “Integrative Systems View of Life: Perspec- tives from General Systems Thinking,” In: S. Thomas Deisboeck and J. Yasha Kresh, Eds., Topics in Biomedi- cal Engineering International Book Series, 2006, pp. 3- 29.
[15] S. Westbrook and E. A. Marek, “A Cross Age Study of Student Understanding of the Concept Homeostasis,”
Journal of Research in Science Teaching, Vol. 29, No. 1, 1992, pp. 51-61.
[16] E. Jungwirth and A. Dreyfus, “After This, Therefore Be- cause of This: One Way of Jumping to Conclusions,”
Biological Education, Vol. 26, No. 2, 1992, pp. 139-142. doi:10.1080/00219266.1992.9655260
[17] J. Budding, “Working with Personal Knowledge in Biol- ogy Classrooms on the Theme of Regulation and Homeo- stasis in Living Systems,” Nato ASI Series of Computer and Systems Sciences, Vol. 148, 1996, pp.126-134. [18] P. A. Whitner, “Gestalt Therapy and General System
Theory,” University of Toledo, Ohio, 1985.
[19] C. D. Wilson, C. W. Anderson, M. Heidemann, J. E. Merrill, B. W. Merritt, G. Richmond, D. F. Sibley and J.
M. Parker, “Assessing Students’ Ability to Trace Matter in Dynamic Systems in Cell Biology,” Cell Biology Edu- cation, Vol. 5, No. 4, 2006, pp. 323-331.
doi:10.1187/cbe.06-02-0142
[20] M. H. Brown and R. S. Schwartz, “Connecting Photo- synthesis and Cellular Respiration Preservice Teachers’ Conceptions,” Science Teaching, Vol. 46, No. 7, 2009, pp. 791-812. doi:10.1002/tea.20287
[21] C. E. Hmelo-Silver and M. G. Pfeffer, “Comparing Ex- pert and Novice Understanding of a Complex System from the Perspective of Structures, Behaviors, and Func- tions,” Cognitive Science, Vol. 28, No. 1, 2004, pp. 127- 138. doi:10.1207/s15516709cog2801_7
[22] K. Thompson and P. Reiman, “Patterns of Use of an Agent-Based Model and a System Dynamics Model: The Application of Patterns of Use and the Impacts on Learn- ing Outcomes,” Computers and Education, Vol. 54, No. 2, 2010, pp. 392-403. doi:10.1016/j.compedu.2009.08.020 [23] U. Wilensky and M. Resnick, “Thinking in Levels: A
Dynamic Systems Approach to Making Sense of the World,” Science Education and Technology, Vol. 8, No. 1, 1999, pp. 3-19. doi:10.1023/A:1009421303064
[24] M. Evagorou, K. Korfiatis, C. Nicolaou and C. Constan- tinou, “An Investigation of the Potential of Interactive Simulations for Developing System Thinking Skills in Elementary School: A Case Study with Fifth-Graders and Sixth-Graders,” Science Education, Vol. 31, No. 5, 2009, pp. 655-674. doi:10.1080/09500690701749313
[25] T. H. Shore, L. M. F. Shore and I. G. C. Thornton, “Con- struct Validity of Self- and Peer Evaluations of Perform- ance Dimensions in an Assessment Center,” Applied Psychology, Vol. 77, No. 1, 1992, pp. 42-54.
doi:10.1037/0021-9010.77.1.42
[26] B. Richmond and S. P. Stella, “High Performance Sys- tems,” Hanover, New Hampshire, 1990.
[27] N. Roberts, “Teaching Dynamic Feedback Systems Thinking: An Elementary View,” Management Science, Vol. 24, No. 8, 1978, pp. 836-843.
doi:10.1287/mnsc.24.8.836
[28] L. B. Resnick, “From Protoquantities to Operators: Building Mathematical Competence on a Foundation of Everyday Knowledge,” In: G. Leinhardt, R. Putnam and R. A. Hattrup, Eds., Analysis of Arithmetic for Mathe- matics Teaching, Lawrence Erlbaum, Hillsdale, 1992, pp. 373-429.
[29] U. J. Wilensky, “Connected Mathematics: Building Con- crete Relationships with Mathematical Knowledge,” 1993.
[30] A. Repenning, “Agentsheets: A Tool for Building Do- main-Oriented Dynamic Visual Environments,” Confer- ence on Human Factors in Computing Systems, Amster- dam, 24-29 April 1993, pp. 142-143.
[31] D. C. Smith, A. Cypher and J. Spohrer, “Kidsim: Pro- gramming Agents without a Programming Language,”
Communications of the ACM, Vol. 37, No. 7, 1994, pp. 54-67. doi:10.1145/176789.176795
[32] U. Wilensky, “GasLab: An Extensible Modeling Toolkit for Exploring Micro-and Macro-Views of Gases,” In: N.
Roberts, W. Feurzeig and B. Hunter, Eds., Computer Modeling and Simulation in Science Education, Springer- Verlag, Berlin, 1999.
doi:10.1007/978-1-4612-1414-4_7
[33] D. Ardac and S. Akaygun, “Effectiveness of Multimedia Based Instruction That Emphasizes Molecular Represen- tations on Students’ Understanding of Chemical Change,”
Science Teaching, Vol. 41, No. 4, 2004, pp. 317-337. doi:10.1002/tea.20005
[34] R. Kozma, “Students Collaborating with Computer Mod- els and Physical Experiments,” In: C. Hoadley, Ed., Com- puter Support For Collaborative Learning Mahwah, Erl- baum, Mahwah, 2000, pp. 314-322.
[35] J. W. Russell, R. B. Kozma, T. Jones, J. Wykoff, N. Marx and J. Davis, “Use of Simultaneous-Synchronized Mac- roscopic, Microscopic, and Symbolic Representations to Enhance the Teaching and Learning of Chemical Con-cepts,” Chemical Education, Vol. 74, No. 3, 1997, pp. 330-334. doi:10.1021/ed074p330
[36] J. Snir, C. L.Smith and G. Raz, “Linking Phenomena with Competing Underlying Models: A Software Tool for In- troducing Students to the Particulate Model of Matter,”
Science Education, Vol. 87, No. 6, 2003, pp. 794-830. doi:10.1002/sce.10069
[37] M. J. Van and J. T. De, “Supporting Students’ Learning with Multiple Representations in a Dynamic Simula- tion-Based Learning Environment,” Learning and In- struction, Vol. 16, No. 3, 2006, pp. 199-212.
doi:10.1016/j.learninstruc.2006.03.007
[38] National Research Council, NRC, “National Science Edu- cation Standards,” National Academy, Washington, 1996.
[39] J. D. Novak and D. Musonda, “A Twelve-Year Longitu- dinal Study of Science Concept Learning,” American Educational, Vol. 28, No. 1, 1991, pp. 117-153.
[40] J. D. Novak and D. B. Gowin, “Learning How to Learn,” Cambridge University Press, Cambridge, 1984.
doi:10.1017/CBO9781139173469
[41] M. A. Ruiz-Primo, R. J., Li, M. Shavelson and S. E. Schultz, “On the Validity of Cognitive-Interpretations of Scores from Alternative Concept-Mapping Techniques,”
Educational Assessment, Vol. 7, No. 2, 2001, pp. 99-141. doi:10.1207/S15326977EA0702_2
[42] C. E. Hmelo-Silver and R. Azevedo, “Understanding Complex Systems: Some Core Challenges,” Learning Sciences, Vol. 15, No. 1, 2006, pp. 53-61.
doi:10.1207/s15327809jls1501_7
[43] O. Ben-Zvi Assaraf and N. Orion, “Four Case Studies, Six Years Later: Developing System Thinking Skills in Junior High School and Sustaining Them over Time,”
Science Teaching, Vol. 47, No. 10, 2010, pp. 1253-1280. doi:10.1002/tea.20383
[44] B. L. Martin, J. J. Mintzes and I. E. Clavijo, “Restructur- ing Knowledge in Biology: Cognitive Processes and Metacognitive Reflections,” Science Education, Vol. 22, No. 3, 2000, pp. 303-323.
doi:10.1080/095006900289895
[45] C. L. Mason, “Concept Mapping: A Tool to Develop Reflective Science Instruction,” Science Education, Vol.
76, No. 1, 1992, pp. 51-63. doi:10.1002/sce.3730760105 [46] W. M. Roth, “Students Views of Collaborative Concept
Mapping,” An Emancipator Research Project, Science Education, Vol. 78, No. 1, 1994, pp. 1-34.
doi:10.1002/sce.3730780102
[47] R. White and R. Gunstone, “Probing Understanding,” Falmer, London, 1992.
[48] E. C. Zele, “Improving the Usefulness of Concept Maps as a Research Tool for Science Education,” Science Edu- cation, Vol. 26, No. 9, 2004, pp. 1043-1064.
doi:10.1080/1468181032000158336
[49] R. Davis, H. Shrobe and P. Szolovits, “What is a Knowl- edge Representation?” Al Magazine, Vol. 14, No. 1, 1993, pp. 17-33.
[50] L. R. Novick and C. E. Hmelo, “Transferring Symbolic Representations across Nonisomorphic Problems,” Ex- perimental Psychology: Learning Memory, and Cogni- tion, Vol. 20, No. 6, 1994, pp. 1296-1321.
doi:10.1037/0278-7393.20.6.1296
[51] J. A. Rye and P. A. Rubba, “An Exploration of the Con- cept Map as an Interview Tool to Facilitate the externali- zation of Students’ Understandings about Global Atmos- pheric Change,” Science Teaching, Vo. 35, No. 5, 1998, pp. 521-546.
doi:10.1002/(SICI)1098-2736(199805)35:5<521::AID-T EA4>3.0.CO;2-R
[52] C. J. Songer and J. J. Mintzes, “Understanding Cellular Respiration: An Analysis of Conceptual Change in Col- lege Biology,” Science Teaching, Vol. 31, No. 6, 1994, pp. 621-637. doi:10.1002/tea.3660310605
[53] S. N. Chang and M. H. Chiu, “Probing Students’ Concep- tions Concerning Homeostasis of Blood Sugar via Con- cept Mapping,” Proceedings of the Annual Meeting of the National Association for Research in Science Teaching, Vancouver/Canada, 1-4 April 2004.
[54] O. Ben-Zvi Assaraf, J. Dodick and J. Tripto, “High School Students’ Understanding of the Human Body System,” Research Science Education, Vol. 43, 2013, pp. 33-56.
[55] O. Ben-Zvi Assaraf and I. Orpaz, “The Life at the Poles; Study Unit Developing Junior High School Students’ Ability to Recognize the Relations between Earth Sys- tems,” Science Education, Vol. 40, No. 4, 2010, pp. 525- 549.
[56] A. L. Odom and P. V. Kelly, “Integrating Concept Map- ping and the Learning Cycle to Teach Diffusion and Os- mosis Concepts to High School Biology Students,” Sci- ence Education, Vol. 85, No. 6, 2000, pp. 615-635. [57] P. G. Markow and R. A. Lonning, “Usefulness of Con-
cept Maps in College Chemistry Laboratories: Students’ Perceptions and Effects on Achievement,” Science Teach- ing, Vol. 35, No. 9, 1998, pp. 1015-1029.
doi:10.1002/(SICI)1098-2736(199811)35:9<1015::AID-T EA4>3.0.CO;2-G
Copyright © 2013 SciRes. AJOR [59] R. P. Verhoeff, “Towards Systems Thinking in Cell Bi-
ology Education,” Ph.D. Science and Mathematics Edu- cation, Universiteit Utrecht, Utrecht, 2003.
[60] L. Stern and J. E. Roseman, “Can Middle-School Science Textbooks Help Students Learn Important Ideas?” Re- search in Science Teaching, Vol. 41, No. 6, 2004, pp. 538-568. doi:10.1002/tea.20019
[61] F. Safayeni, N. Derbentseva and A. J. Canas, “A Theo retical Note on Concepts and the Need for Cyclic Concept Maps,” Science Teaching, Vol. 42, No. 7, 2005, pp. 741-766. doi:10.1002/tea.20074
[62] R. Davis, H. Shrobe and P. Szolovits, “What is a Knowl- edge Representation?” Al Magazine, Vol. 14, No. 1, 1993, pp. 17-33.
[63] W. D. Simpson and E. A. Marek, “Understandings and Misconceptions of Biology Concepts Held by Students Attending Small High Schools and Students Attending Large High Schools,” Science Teaching, Vol. 25, No. 5, 1988, pp. 361-374. doi:10.1002/tea.3660250504
[64] U. Wilensky and K. Reisman, “Thinking like a Wolf, a Sheep or a Firefly: Learning Biology through Construct- ing and Testing Computational Theories—An Embodied Modeling Approach,” Cognition and Instruction, Vol. 24, No. 2, 2006, pp. 171-209.
Appendix 1
Correlation between Concept Maps and the STH Model
Below is a step-by-step description of how concept maps can be read as indicators of system thinking, based on the correlation of their contents to the STH model. The de- scription is divided according to the model’s three basic levels, and further subdivided into the model’s eight in- dividual characteristics. (Note: The fifth characteristic “identifying matter and energy cycles” is not featured here, as it is not relevant to human body systems.)
Level A: Analysis of System Components
Characteristic # 1: Identifying components and processes in the human body system. Characterizing system think- ing at the components and processes level requires the following steps:
1) Selecting a suitable characteristic into which all the concepts written by the population may be pooled. In this study we chose “hierarchy in nature”.
2) Dividing this “master-characteristic” into the cate- gories—“Structure” and “Process”
3) Further dividing each of these into the sub-catego- ries of “Microscopic” and “Macroscopic” levels.
4) Sorting the concepts written by the students into each of the categories now present under the master- characteristic “hierarchy in nature”.
5) Counting all of the concepts provided by the popu- lation to arrive at an overall amount of concepts.
6) Counting the number of concepts in each category. 7) Calculating distributions for the estimation of the students’ relative ability to represent system components vs system processes.
For a more thorough insight into the students’ treat- ment of components vs processes, the maps should also be analyzed according to the connections students made between the concepts. This necessitates the following:
a) Counting all the connections made by the student. A connection is a word describing a connection between two concepts. For instance: (The veins) transfer (blood) from the (heart) to the (body). The underlined words represent the connections drawn between the concepts.
b) Analyzing the contents of the connections to derive statements. “Veins transfer blood from the heart to the body”.
c) Sorting the resulting statements and removing those that are irrelevant to the study topic.
d) Sorting the statements into process/non-process re- lated. A process-related statement refers to a string of actions or changes that are assigned a certain order with- in a gradual development. On the other hand, a merely descriptive statement would refer statically to an object’s state or appearance.
e) Calculating distributions to compare process/non- process-oriented statements.
Level B: Synthesis of System Components
Characteristic # 2: Identifying simple relationships be- tween system components. Evidence in concepts maps of relationships between system components can be gath- ered by identifying both the concepts in the students’ body of knowledge, and the manner of their organization into meaningful connections. To do this one must:
a) Analyze the connections and translate them into statements.
b) Identify statements that address relationships be- tween components, i.e. statements that address the effect of element “x” upon element “y”.
Characteristic # 3: Identifying dynamic relationships in systems. This ability can be measured by the examina- tion of the connection a student has formed between two concepts.
a) Analyze connections and translate them into state- ments.
b) Identify statements that express dynamism—i.e. statements in which the student refers to the transmission of a certain substance within the human body system.
Characteristic # 4: Organizing components and proc- esses within a framework of relationships. Students’ abi- lity to connect a single component to a large number of other components can be assessed by examining the number of junctions on their concept map. A “junction” is a concept that has connections to at least three other concepts on the map. The number of junctions students mark between their concepts provides insight into the level of knowledge integration they have undergone. For this reason, the junctions in each map are to be counted.
Level C: Implementation
Copyright © 2013 SciRes. AJOR Characteristic # 7: Identifying hidden dimensions. To
assess this characteristic, the statements derived from the map must be sorted, and those that refer to internal pat- terns and connections that are invisible on the body’s surface must be identified.
Characteristic # 8: Temporal thinking. This includes
both retrospective thinking (backwards) and projection (forwards). To identify a students’ understanding that interactions taking place in the present can bring about and influence future events, those statements from the map in which there are temporal references must be iden- tified.
Examples of the STH Model from Tami and Eli’s concept map
STH model Examples from Tami's concept map:
a) Junctions Hormones, Homeostasis, Glucose regulation, food, digestive system, blood, blood vessels, body systems, cell respiration, circulatory system, blood cells.
b) Interaction
between components
Thrombocytes are responsible for clotting; White blood cells have a role in the immune system; White blood cells produce antibodies; Hormones are responsible for homeostasis
c) Pattern Homeostasis
Hormones are responsible for homeostasis; Glucose regulation is part of homeostasis; Water regulation is part of homeostasis; Temperature regulation is part of homeostasis
d) Pattern Hierarchy
e) Pattern Dynamism
None
The human body is composed of body systems; the digestive system is one of the body’s systems; the circulatory system is one of the body’s systems; the respiratory system is one of the body’s systems; The nervous system is one of the body’s systems; Duodenum is an organ the digestive system; Stomach is an organ the digestive system; Mouth is an organ the digestive system; Cells build organs; Organs build body systems; Kidneys are an organ in the Urinary system; Lungs are an organ in the respiratory system; Blood is composed of plasma
f) Hidden dimensions
Hormones are secreted from glands; White blood cells produce antibodies; Carbon dioxide is the result of cell respiration; Glucose is a raw material in cell respiration; Oxygen is a raw material in cell respiration; Water is a product of cell respiration; DNA is in the nucleus; Nuclei are found in all cells
Concepts Connections Junctions Macro Structures Micro Cell level molecule patterns Hidden dimension
51 50 11 10 9 14 17 8
STH model Examples from Eli concept map:
a) Junctions Blood, capillaries, circulatory system, heart, arteries, energy, sugar concentration in blood, homeostasis, urea + water, insulin/ glucagon.
b) Interaction
between components
Energy – the circulatory system uses it to do its job; The brain directs the maintaining of homeostasis; The concentration of sugars in the blood is maintained by the secretion of insulin/glucagons; Energy is used to help the urinary system do its job.
c) Pattern Homeostasis
The concentration of urea and water in the body is regulated by homeostasis; Homeostasis is maintained by the concentration of sugars in the blood; Homeostasis of sugar concentration in the blood is powered by the secretion mechanism of insulin/Glucagon; The brain directs the maintaining of homeostasis; Insulin works through positive and negative feedback; The concentration of sugars in the blood is maintained by the secretion of insulin/glucagons; positive/ negative feedback is maintained by homeostasis.
d) Pattern Hierarchy
The circulatory system includes capillaries; The circulatory system includes veins; The circulatory system includes arteries; The circulatory system includes the heart.
e) Pattern Dynamism
Oxygen enters the body through the lungs; waste material is moved through the circulatory system—urea and water; urea and water are transferred from the circulatory system to the urinary system.
f) Hidden dimensions
Urea and water are transferred from the circulatory system to the urinary system; Glucogen is stored in the liver; insulin is secreted by the pancreas; glucose is a source of energy; glucose breaks down and becomes the concentration of sugars in the blood; oxygen is a source of energy.
Concepts Connections Junctions Macro Structures Micro Cell Level Molecule Patterns Hidden Dimension