Exploring Label Dependency in Active Learning for Phenotype Mapping
Shefali Sharma1, Leslie Lange2, Jose Luis Ambite1, Yigal Arens1, Chun-Nan Hsu1,3 1Information Sciences Institute, University of Southern California, Marina del Rey, CA 90292, USA
2Department of Genetics, University of North Carolina, Chaple Hills, NC 27599, USA 3Institute of Information Sciences, Academia Sinica, Taipei 115, Taiwan
Abstract
Many genetic epidemiological studies of hu-man diseases have multiple variables related to any given phenotype, resulting from dif-ferent definitions and multiple measurements or subsets of data. Manually mapping and harmonizing these phenotypes is a time-consuming process that may still miss the most appropriate variables. Previously, a su-pervised learning algorithm was proposed for this problem. That algorithm learns to de-termine whether a pair of phenotypes is in the same class. Though that algorithm ac-complished satisfying F-scores, the need to manually label training examples becomes a bottleneck to improve its coverage. Herein we present a novel active learning solution to solve this challenging phenotype-mapping problem. Active learning will make pheno-type mapping more efficient and improve its accuracy.
1 Introduction
Phenotypes are observable traits of an individual or-ganism resulting from the presence and interaction of its genotype with the environment. Phenotypes potentially related to human health are of interest in genetics and epidemiology, including common clin-ical conditions, inheritance disorders, as well as var-ious risk factors such as diet. Substantial amounts of genomic data, including genome-wide genotyp-ing from GWAS (Genome-Wide Association Stud-ies) (Hardy and Singleton, 2009; Consortium, 2007) and sequencing, are being produced in conjunction
with the collection of carefully defined and mea-sured phenotypes to study the role of genetic vari-ations in a wide variety of inherited traits and disor-ders for many decades.
Recently, there is an emerging need to re-use these valuable phenotype-genotype association data to boost the statistical power and improve sensitiv-ity and specificsensitiv-ity of the search of associations be-tween various disorders and genetic variations. New paradigms of genomic studies may be fostered once a map of related phenotypes is easily accessible. In fact, one of such new paradigms, PheWAS (Phe-nome Wide Association Studies), has been devel-oped and producing interesting findings (Denny et al., 2010; Pendergrass et al., 2011) with the help of phenotype mapping and harmonization. Unlike GWAS, which focus on calculating the association between the variation of hundreds of thousands of genotyped single nucleotide polymorphisms (SNPs) and a single or small number of phenotypes, Phe-WAS uses an extensive range of detailed pheno-typic measurements for comprehensively exploring the association between genetic variations and notypes. The investigation of a broad range of phe-notypes has the potential to identify pleiotropy, re-veal novel mechanistic insights, generate new hy-potheses, and define a more complete picture of ge-netic variations and their impact on human diseases.
To facilitate integration of genomic data sets, the research community needs to categorize compara-ble phenotype measurements and match them across multiple genomic studies to identify data sets of interest as well as potential future collaborations. While the naming strategy for genetic variants is
largely standardized across studies (e.g. rsnumbers for single nucleotide polymorphisms or SNPs), this is often not the case for phenotype variables. Due to the lack of a standardized terminologies or other controlled vocabularies, it becomes increasingly dif-ficult to find studies with comparable phenotypes as the genomic data accumulate. A researcher search-ing for the availability of comparable phenotypes across multiple studies is confronted with a veritable mountain of variables to sift through. Even within a study, there are often numerous versions of se-mantically equivalent phenotypic variables. Manu-ally mapping and harmonizing these phenotypes is a time-consuming process that may still miss the most appropriate variables.
Previously, (Hsu et al., 2011) have developed a supervised learning algorithm that learns to deter-mine whether a pair of phenotypes is semantically related from their descriptors. Though that algo-rithm accomplished satisfying F-scores, the need to manually label training examples becomes a bottle-neck to improve its coverage. Moreover, the algo-rithm treats each pair independently, but pairs that consist of common phenotypes are not independent. Exploring this dependency may potentially improve its performance. In this paper, we investigate how to apply active learning to solve this challenging phenotype-mapping problem. Application of effec-tive aceffec-tive learning techniques will make pheno-type mapping more efficient and improve its accu-racy and, along with intuitive phenotype query tools, would provide a major resource for researchers uti-lizing these genomic data.
Active learning queries a user for labels of unla-beled phenotypes that may improve the learning of phenotype mapping the most and thereby reduce the need of labeling efforts. To select the most useful training examples to query, different selection strate-gies have been proposed in the past (Settles, 2010):
• Uncertainty SamplingIn this strategy, an ac-tive learner chooses an instance that is the most uncertain for the current model to label (Lewis and Catlett, 1994).
• Query-By-committeeThis strategy (Seung et al., 1992) is also known as maximum dis-agreement(Ayache and Qu´enot, 2007; Di and Crawford, 2011) because the idea is to choose
an instance for which a committee of models disagrees the most among its members about its label.
• Expected Model ChangeThe general princi-ple of this strategy is to choose an instance to query when if its label is available, the model will be changed the most (Settles and Craven, 2008).
• Expected Error ReductionActive learning is useful when the selected instance reduce the er-ror the most and this strategy looks for an in-stance that can achieve this ultimate goal di-rectly.
• Variance Reduction Inspired by the bias-variance analysis of the generalization perfor-mance, the variance reduction principle seeks to query for instances that reduce the variance of the model the most. A similar approach is applied in theoptimal experimental design in statistics (Federov, 1972). However, usually this also requires to solve expensive optimiza-tion problems.
• Density-Weighted Methods By considering the distribution of the instances, this strategy addresses an issue of uncertainty sampling and query-by-committee where outliers are likely to be selected but contribute limitedly to im-proving the learning (Fujii et al., 1998; Das-gupta and Hsu, 2008).
The method reported here basically follows the maximum disagreement principle of query-by-committee to select unlabeled pairs of phenotypes to query. A committee must be formed in order for this strategy to be applied, but it has been shown that even a small committee works well in practice. Vari-ous approaches can be applied to create committees. For example, co-testing (Muslea et al., 2006) applies this principle by combining forward and backward parsing models for information extraction. A key to the success of this strategy is that member models in the committee complement strengths and weak-nesses.
from exploring linkages of the labeled and unlabeled phenotypes. The most useful pairs to query are those whose assignments from the two different sources disagree with the highest confidence.
Exploring linkages may improve classifier learn-ing when the classes of instances depend on each other. This idea has been studied in the context of classification of network data, such as pages on the Web, co-reference resolution, word sense disam-biguation, and statistical relational learning (see e.g., (Macskassy, 2007; McCallum and Wellner, 2005; Popescul et al., 2003)).
In this paper, we present an algorithm that im-plement our idea. This algorithm can be divided into two major steps. The first step of the algo-rithm explores the linkages and the second step pri-oritizes pairs of phenotypes to query. By identify-ing maximum disagreement pair instances between the model classification results and exploring link-ages between labeled and unlabeled phenotype vari-ables, our active learner queries users for labels of unlabeled phenotypes that may improve the map-ping the most and therefore will reduce the need of labeling efforts. Our experimental results show that exploring linkages can perfectly infer the match-or-not labels for a large number of pairs, and that ac-tive learning from maximum disagreement pairs im-proves the performance faster than from randomly selected pairs, suggesting that active learning by ex-ploring linkages is a promising approach to the prob-lem of phenotype mapping.
2 Phenotype Mapping
2.1 Problem Definition
Phenotype mapping is a task of searching for all databases of participating studies to find a set of phe-notype variables that match a requested variable that the researcher is interested in. This is similar to the definition given in (Hsu et al., 2011) where the task is defined as the assignment of every phenotype vari-able from each participating study to one of a set categories, or classes, which corresponds to the “re-quested variable.”
Table 1 shows a fragment of the phenotype map-ping results of the phenotype variables that we matched manually from a consortium of cohort stud-ies for a set of 70 requested variables. In this
frag-ment, we show the phenotype variables assigned to one of the requested variables, the phenotype class
‘hypertension’. The real ID of a phenotype in a Cohortis given in columnVariable. In this ex-ample, seven cohort studies have a total of 13 phe-notype measurements related to hypertension.
Column Description is the main clue for au-tomatic matching. The variable descriptions usu-ally contain less than 10 words. As we can see in Table 1, the description contains abbreviations (e.g., ’HTN’, ’HBP’,dx), aliases (e.g., ’High Blood Pressure’vs. Hypertension), mea-surement criteria (e.g., DBP>90 MMHG, sys GE 140, per JNC7,JNC VI), and tokens irrelevant to our task. As a result, word-by-word string sim-ilarity or sophisticated edit-distance based metrics can only match a small number of them. These ex-amples are phenotypes that share similar semantics and are manually mapped to the same classes but their descriptions contain few or no common words. It is impossible for a model solely using the given descriptions to figure out that they refer to related phenotypes without bringing to bear additional in-formation.
Other challenges of the phenotype problem in-clude: not knowing in advance how many classes there are, unavailability of comprehensive catego-rization of phenotypes, and that the solution should scale well for a large number of phenotypes.
2.2 Supervised Learning for Phenotype Mapping
Requested
Cohort Variables Variable Description
ARIC Hypertension HYPERT06 HYPERTENSION, DEFINITION 6
CARDIA Hypertension Y01DBP HYPERTENSION BASED ON DBP> 90 MMHG CARDIA Hypertension Y01HTN HIGH BLOOD PRESSURE
CARDIA Hypertension Y01HTNTP TYPE OF HYPERTENSION
CFS Hypertension htn HTN: abnormal bp (sys GE 140 or dia GE 90) or meds CFS Hypertension htndx HTN: self report of MD dx of HTN
CHS Hypertension HYPER CALCULATED HTN STATUS
FHS Hypertension A70 HISTORY OF HYPERTENSION
FHS Hypertension B373 HYPERTENSION-ON TREAT OR ELEVATED BP
FHS Hypertension C332 HBP status
JHS Hypertension HTN017 Hypertension Status Per JNC7 MESA Hypertension HIGHBP1 HYPERTENSION: SELF-REPORT
MESA Hypertension HTN1C Hypertension by JNC VI (1997) criteria
Table 1: Example variables of phenotype class’hypertension’
match each other. The other type is the weighted Jaccard where appearence of tokens and bi-grams in both or one of the descriptions of a given phe-notype pair is used as the features. The training al-gorithm for MaxEnt will virtually assign to each to-ken or bi-gram a weight when it appears in the de-scriptions of an input phenotype pair. Weighted Jac-card is superior to string similarity features because string similarity metrics treat all tokens equally and the information provided by these metrics is limited. Therefore weighted jaccard was shown to outper-form string similarity features by a large margin in the experimental evaluation.
Before the feature extraction step, descriptions will be augmented with the definitions given in the Merriam-Webster Medical Dictionary (2006)1. For example, ’hypertension’ will be augmented with its definition in the dictionary’abnormally high arterial blood pressure’ and converted into ’hypertension abnormally high arterial blood pressure’. Aug-mented’hypertension’will have many shared tokens with ’high blood pressure’. This augmentation step was proven to be effective in boosting recall, as semantically equivalent pairs described by totally different sets of tokens can be matched.
(Hsu et al., 2011) also reported a transitive in-ference method to take advantage of the transitive relationship of matched phenotype pairs. The idea is that if v1 and v2 are a match, so are v2 andv3,
1www.m-w.com/browse/medical/a.htm
thenv1andv3must be a match, too. Applying tran-sitive inference did improve the performance, but when all possible transitive relations are explored, the performance degraded because false positives accumulated. The transitive inference method does not fully explore the dependency between pairs that share common phenotype variables. A more sophis-ticated approach is required.
3 Methods
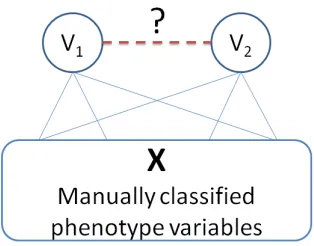
Figure 1 illustrates our active learning idea. The idea is that, given a training set of phenotype variables Xmanually matched with class labels and a test set of unlabeled phenotype variables, the first step is to infer the class of each unlabeled variable by explor-ing the pairwise match scores assigned by the model trained by the training set. When we obtain a plausi-ble class assignment to each unlabeled variaplausi-ble, we can classify each pair of unlabeled variablesv1and v2 by the trained model again to determine if they are a match or not and compare the result with their plausible class assignments.
Figure 1: Inferernce of match between unlabeled pheno-type variables by exploring their linkages to labeled pairs
3.1 Assigning Phenotype Categories
ProcedureLabelAis to assign a class label to each unlabeled test variable by matching them to labeled training variables. LetAdenote the set of all pairs between a test variable and a training variable. For each variable, the output contains an element of the variable, its assigned class label (may be null) and a score (log-likelihood). Function I(.) in line 2 is the indicator function that returns 1 if its parameter is true and 0 otherwise. H is the model learned by calling the supervised training procedure. In line 7, PvxH is the probability that variables v and x are a match estimated byH. In line 8,LabelAassignsv to a classc, which is the class of the training variable xthat maximizesPvxH. That is to assign the class of x as that ofv ifPvxH is the largest. Other selection can be used. For example, for each classc, we can estimatePvxH for all training variablesxinc, and se-lectcas the class ofvif 1nP
logPvxH, the geometric mean of the probabilities, is the largest. These selec-tion criteria are based on different assumpselec-tions and we will empirically compare which one is a better choice. In fact, any type of average can potentially be considered here.
3.2 Prioritizing Unlabeled Pairs
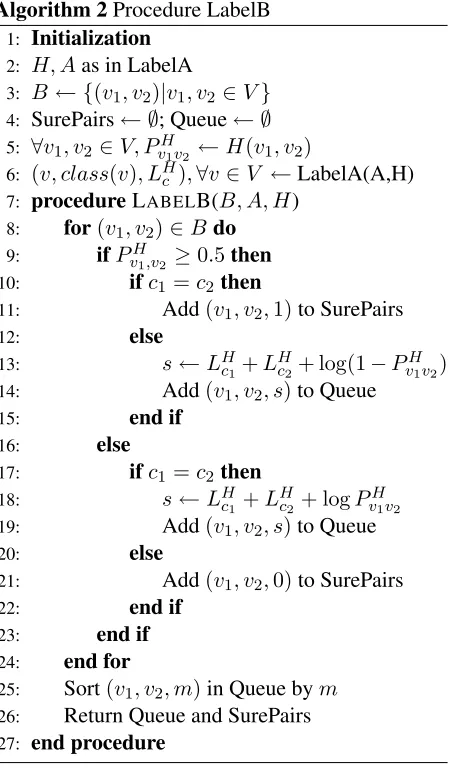
ProcedureLabelBorders pairs of test variables to query for match-or-not and class labels. Let B be the set of all pairs of test variables. LabelB also generates a set called SurePairs. For each pair inB,LabelBchecks if the modelHconsiders the pair as a match (PvxH ≥0.5) or not, and then checks if the pair is assigned byLabelAto the same class
Algorithm 1Procedure LabelA 1: Initialization
• Training variablesXwith their class anno-tatedclass(x) =c∈C,∀x∈X
• Test variables V with unknown class class(v),∀v∈V
2: H ← T rain({(x1, x2, m)|x1, x2 ∈ X, m = I(class(x1) =class(x2))})
3: A← {(v, x)|v∈V ∧x∈X}
4: procedureLABELA(A, H) 5: Output← ∅
6: forv∈V do
7: ∀x∈X, PvxH ←H(v, x) 8: c←arg maxc(PvxH) 9: LHvx←maxC(logPvxH)
10: ifLHvx<−2then
11: c←null,
12: s←log(1−2LHvx)
13: else
14: s←LHvx
15: end if
16: Add(v, c, s)to Output
17: end for 18: Return Output 19: end procedure
or not. If it is a match and assigned to the same class, or not a match and assigned to different classes, that is, if H and LabelA agree, then the pair will be moved toSurePairs, otherwise, the pair will be moved to Queue. For a disagreed pair, LabelB
also estimate the degree of disagreement by the sum of the log-probabilities of the class assignments (LHc1 andLHc2) and the match-or-not by the model (Pv1v2H ).
SurePairscan then be used for training.
We can then query for true labels of pairs in
Queue. We can either query whether a pair is a match or not or query for their class label. After a certain number of queries, we can repeat the pro-cedure to compute a new set of SurePairs and
Algorithm 2Procedure LabelB 1: Initialization
2: H, Aas in LabelA
3: B ← {(v1, v2)|v1, v2∈V} 4: SurePairs← ∅; Queue← ∅
5: ∀v1, v2 ∈V, Pv1v2H ←H(v1, v2)
6: (v, class(v), LcH),∀v∈V ←LabelA(A,H) 7: procedureLABELB(B, A, H)
8: for(v1, v2)∈Bdo 9: ifPv1,v2H ≥0.5then
10: ifc1=c2then
11: Add(v1, v2,1)to SurePairs
12: else
13: s←LHc1+LHc2+ log(1−Pv1Hv2)
14: Add(v1, v2, s)to Queue
15: end if
16: else
17: ifc1=c2then
18: s←LHc1+LHc2 + logPv1v2H 19: Add(v1, v2, s)to Queue
20: else
21: Add(v1, v2,0)to SurePairs
22: end if
23: end if 24: end for
25: Sort(v1, v2, m)in Queue bym 26: Return Queue and SurePairs 27: end procedure
4 Results
4.1 Data
We manually selected 1,177 phenotype variables from a total of 35,041 in the databases of seven co-hort studies as shown in Table 1 and assigned them to one of 70 requested variables that are common trait classes related to a large consortium study of cardiovascular disorders. These seven cohorts in-clude ARIC (the Atherosclerosis Risk In Communi-ties study www.cscc.unc.edu/aric/), CAR-DIA (the Coronary Artery Risk In Young Adults studywww.cardia.dopm.uab.edu), CFS (the Cleveland Family study dceweb1.case.edu/ serc/collab/project_family.shtml), CHS (the Cardiovascular Heart Study www. chs-nhlbi.org/), FHS (Framingham Heart Study www.framinghamheartstudy.org/),
Method / Model Precision Recall F-score String similarity
MaxEnt 0.5557 0.0660 0.1179
Weighted Jaccard
MaxEnt 0.8791 0.4848 0.6250
w/ dictionary 0.9200 0.6104 0.7339 w/ transitive infer. 0.7735 0.6612 0.7129
[image:6.612.75.301.57.444.2]w/ both 0.7728 0.8402 0.8051
Table 2: Performance results of supervised learning
JHS (Jackson Heart Study jhs.jsums.edu/ jhsinfo/), and MEC (the Multi-Ethnic Cohort
www.crch.org/multiethniccohort/,
www.uscnorris.com/mecgenetics/). From these 1,177 phenotypes, 21,886 pairs are considered matches, that is, they are positive pairs with both phenotype variables in the same class. 670,190 pairs are negatives.
4.2 Result of Supervised Learning
We divided all pairs in our data set by half into train-ing and test sets and evaluate different options of the supervised learning algorithm with different options as described in (Hsu et al., 2011). The results as shown in Table 2 are consistent with the conclusions given in (Hsu et al., 2011). That is, weighted Jaccard features with dictionary augmentation plus transitive inference yields the best performance.
We also performed a split-by-variable test, where the set of all variables is divided into three equal parts. Two of them are used for training and the other for testing. This is closer to the realistic appli-cation scenario and provides a better estimation of the generalization performance of a trained model. The results are given as the first two rows in Table 3.
4.3 Result of Active Learning
We implemented the two algorithms and evalu-ate the performance. We still applied split-by-variable to divide the data with 13 for testing and 23 for training. We measured the performance when
Method/Model Precision Recall F-score w/o dictionary 0.8344 0.4106 0.5504 w/ dictionary 0.6310 0.5287 0.5753 Test onA 0.7956 0.5243 0.6321 GM SurePairs
(62622) 0.8772 0.5909 0.7061 Model (62622) 0.9577 0.2936 0.4494 MP SurePairs
[image:7.612.73.297.52.194.2](74229) 0.8845 0.6196 0.7287 Model (74229) 0.9660 0.2875 0.4431
Table 3: Performance results of splitting by variables. Numbers in the parentheses show the number of pairs in
SurePairs.
query sequence.
To ensure a fair comparison, we always use the set A, the pairs between a labeled and unlabeled pheno-type variables, as the hold-out set for testing in all performance evaluations. Note that pairs in the setA never appear in eitherSurePairsorQueue, be-cause pairs inSurePairs orQueueare selected from the set B, which contains the pairs between unlabeled phenotype variables. The third row of Ta-ble 3 shows the performance of the model tested only onA.
We implemented two versions of procedure
LabelAthat are different in the methods they used to assign a class to an unlabeled variable. The first,
MP, is to use the maximum probability and the other,
GM, is to use the maximum geometric mean of the probabilities (see Section 3.1).
We start by evaluating the quality of
SurePairs. GM produced 62,622 pairs (1,642 positives) while MP had 74,229 pairs (1,816 positives). The match-or-not labels assigned by
LabelBfor both methods turn out to be perfectly correct, suggesting that combining model training and linkage exploration can effectively infer the match-or-not labels.
AddingSurePairsto the training set boosts F-scores, as shown in Table 3, which also shows that, in contrast, if we add the same number of pairs to the training set, but assign them match-or-not labels with the trained model, they will degrade F-scores.
Next, we added pairs in Queue to the training set, 280 pairs at a time, and measured the F-scores
achieved by the resulting model. Figure 2 shows the learning curves of three different ways to order
Queueproduced withGM: descreasing, increasing, and random scores. The decreasing-score one per-formed the best by improving F-scores the fastest, confirming that higher-scored pairs are more useful. The end points of the three curves do not meet be-cause we have not exhausted all training examples.
Similarly, we evaluated decreasing and random ordering of Queue produced by applying MP. We note that MP already produced a large set of
SurePairs. As a result, less pairs are inQueue
[image:7.612.327.522.286.399.2]compared to that byGM. Therefore, after 9 passes, all pairs are exhausted and no obvious difference can be observed between decreasing and random ordering in the end.
Figure 2: Learning curves of active learning: class as-signment by maximum geometric mean of probabilities
Figure 3: Learning curves of active learning: class as-signment by maximum probabilities
5 Conclusions and Future Works
[image:7.612.325.523.465.581.2]phenotypic measures. This paper presents our ac-tive learning approach that will be implemented as a component of new informatics tools for the research community to categorize phenotype measurements from genomic studies.
We show that comparing class assignment by ex-ploring linkages and by the model can be effective in both improving the match-or-not assignments and ordering unlabeled pairs as queries for active learn-ing. It is interesting that when two sources of class assignment agree, the pairs’ match-or-not assign-ments are perfectly correct. How generalizable for this result deserves further investigation. We note that in order to perform a fair comparison, no pair between labeled and unlabeled phenotype variables are used for training. In a real application, they can be added to either SurePairs orQueue by ex-tending procedureLabelBto include them.
Acknowledgments
We thank Cheng-Ju Kuo and Congxing Cai for their help in producing the results reported in Section 4.2. This research is supported by NHLBI-NIH grant 1UH2HL108780-01.
References
St´ephane Ayache and Georges Qu´enot. 2007. Evaluation of active learning strategies for video indexing. Signal Processing: Image Communication, 22(78):692 – 704. Special Issue on Content-Based Multimedia Indexing and Retrieval.
The Wellcome Trust Case Control Consortium. 2007. Genome-wide association study of 14,000 cases of seven common diseases and 3,000 shared controls.
Nature, 447(7145):661–678, June.
Sanjoy Dasgupta and Daniel Hsu. 2008. Hierarchical sampling for active learning. In Machine Learning, Proceedings of the Twenty-Fifth International Confer-ence on Machine Learning (ICML-08), pages 208– 215.
Joshua C. Denny, Marylyn D. Ritchie, Melissa A. Bas-ford, Jill M. Pulley, Lisa Bastarache, Kristin Brown-Gentry, Deede Wang, Dan R. Masys, Dan M. Ro-den, and Dana C. Crawford. 2010. Phewas: demon-strating the feasibility of a phenome-wide scan to discover gene-disease associations. Bioinformatics, 26(9):1205–1210.
Wei Di and Melba M. Crawford. 2011. View gen-eration for multiview maximum disagreement based
active learning for hyperspectral image classification.
Geoscience and Remote Sensing, IEEE Transactions on, PP(99):1 –13.
Valeriˇi V. Federov. 1972. Theory of Optimal Experi-ments. Academic Press.
Atsushi Fujii, Takenobu Tokunaga, Kentaro Inui, and Hozumi Tanaka. 1998. Selective sampling for example-based word sense disambiguation. Compu-tational Linguistics, 24(4):573–597.
John Hardy and Andrew Singleton. 2009. Genomewide association studies and human disease. New England Journal of Medicine, 360(17):1759–1768.
Trevor Hastie, Robert Tibshirani, and Jerome H. Fried-mann. 2009. The Elements of Statistical Learning (2nd Edition). Springer-Verlag, New York, NY, USA. Chun-Nan Hsu, Cheng-Ju Kuo, Congxing Cai, Sarah A.
Pendergrass, Marylyn D. Ritchie, and Jose Luis Am-bite. 2011. Learning phenotype mapping for integrat-ing large genetic data. InProceedings of BioNLP 2011 Workshop, BioNLP ’11, pages 19–27, Portland, OR, USA. Association for Computational Linguistics. David D. Lewis and Jason Catlett. 1994. Heterogeneous
uncertainty sampling for supervised-learning. In Pro-ceedings of the International Conference on Machine Learning (ICML-94), pages 148–156.
Sofus A. Macskassy. 2007. Improving learning in net-worked data by combinng explicit and mined links. In
Proceedings of the National Conference on Artificial Intelligence (AAAI-07), page 590.
Andrew McCallum and Ben Wellner. 2005. Conditional models of identity uncertainty with application to noun coreference. In Lawrence K. Saul, Yair Weiss, and L´eon Bottou, editors,Advances in Neural Information Processing Systems 17, pages 905–912. MIT Press, Cambridge, MA.
Merriam-Webster. 2006. Medical Dictionary. Merriam-Webster, Springfield, MA, USA.
Ion Muslea, Steve Minton, and Craig A. Knoblock. 2006. Active learning with multiple views.Journal of Artifi-cial Intelligence Research, 27:203–233.
S. A. Pendergrass, K. Brown-Gentry, S. M. Dudek, E. S. Torstenson, J. L. Ambite, C. L. Avery, S. Buyske, C. Cai, M. D. Fesinmeyer, C. Haiman, G. Heiss, L. A. Hindorff, C. N. Hsu, R. D. Jackson, C. Kooper-berg, L. Le Marchand, Y. Lin, T. C. Matise, L. More-land, K. Monroe, A. P. Reiner, R. Wallace, L. R. Wilkens, D. C. Crawford, and M. D. Ritchie. 2011. The use of phenome-wide association studies (phewas) for exploration of novel genotype-phenotype relation-ships and pleiotropy discovery. Genetic Epidemiol-ogy, 35(5):410–422.
In In Workshop on Learning Statistical Models from Relational Data at the International Joint Conference on Articial Intelligence (IJCAI-2003).
Burr Settles and Mark Craven. 2008. An analysis of active learning strategies for sequence labeling tasks. InProceedings of the Conference on Empirical Meth-ods in Natural Language Processing (EMNLP), pages 1069–1078. ACL Press.
Burr Settles. 2010. Active learning literature survey. Computer Science Technical Report 1648, University of Wisconsin-Madison, January.