Response variability in Attention Deficit Hyperactivity Disorder:
evidence for neuropsychological heterogeneity
Katherine A. Johnson1,2; Simon P. Kelly1,3; Mark A. Bellgrove1,2,4; Edwina Barry2; Marie Cox2; Michael Gill2; Ian H. Robertson1
1
School of Psychology and Trinity College Institute of Neuroscience, Trinity College Dublin, Dublin 2, Ireland
2
Schools of Psychiatry and Genetics and Trinity College Institute of Neuroscience, Trinity College Dublin, Dublin 2, Ireland
3
Cognitive Neurophysiology Laboratory, Nathan S. Kline Institute, Orangeburg, New York 10962, United States of America
4
Cognitive Neuroscience Laboratory, School of Behavioural Science, University of Melbourne, Australia
Correspondence should be addressed to Katherine Johnson ([email protected])
Dr Katherine Johnson
Trinity College Institute of Neuroscience University of Dublin
Ireland
Tel: +353 (0) 1 608 8569 Fax: +353 (0) 1 671 2006
Running head: Response variability in ADHD
Shortened title: Response variability in ADHD
Key words: Sustained attention; response time; fast Fourier transform; frontal cortex; endophenotype
Abstract word length: 206
Paper word length: 5000 Number of figures: 4
Number of tables: 1
Abstract
Introduction
Increased variability in response time (RT) performance on cognitive tasks is one of the most consistent findings in research into attention deficit hyperactivity disorder (ADHD) (Hurks et al., 2005; Leth-Steensen, King Elbaz, & Douglas, 2000). Increased RT
variability is consistent with explanatory accounts of ADHD that emphasise sub-optimal energetic states (Sergeant, 2005) and deficient extinction processes (Sagvolden, Aase, Johansen, & Russell, 2005). Variability in RT has also been proposed as a possible endophenotype with the potential to index genetic vulnerability to the disorder (Castellanos & Tannock, 2002; Kuntsi & Stevenson, 2001). Two recent molecular genetic studies have reported associations between performance variability measured on tasks of sustained attention and the 10-repeat allele of a variable number of tandem repeats (VNTR) within the dopamine transporter gene (DAT1) in ADHD (Bellgrove, Hawi, Kirley, Gill, & Robertson, 2005; Loo et al., 2003). These studies are noteworthy as the dopamine transporter is the main site of action of methylphenidate (MPH) and treatment with MPH reduces performance variability in ADHD (Castellanos et al., 2005). Recent neuropsychological lesion studies and functional brain imaging have
frequent lapses of attention, as indexed by greater variability, which may underpin deficits such as sustained attention in ADHD (Castellanos et al., 2005).
The existence of a sustained attention deficit in ADHD remains controversial, in part because of the inconsistent demonstration of deficits in performance over the course of the task (time-on-task) (Heinrich et al., 2001; van der Meere, Shalev, Borger, & Gross-Tsur, 1995; van der Meere, Wekking, & Sergeant, 1991). Nevertheless, meta-analytic studies of neuropsychological function in ADHD demonstrate that deficits in sustained attention are of moderate to large effect size (Willcutt, Doyle, Nigg, Faraone, &
Pennington, 2005). Neuropsychological heterogeneity within samples of children with ADHD (Nigg, Willcutt, Doyle, & Sonuga-Barke, 2005) has likely contributed to
dysfunctional in ADHD (Silk et al., 2005; Sowell et al., 2003). Not surprisingly, a number of studies have indicated that children with ADHD have manifest difficulties on different versions of the SART (O'Connell, Bellgrove, Dockree, & Robertson, 2004; Shallice et al., 2002). Performance on the SART has been linked to allelic variation within a number of catecholaminergic candidate genes for ADHD (DAT1)(Bellgrove, Hawi, Kirley et al., 2005), (DRD4) (Bellgrove, Hawi, Lowe et al., 2005).
Castellanos et al recently proposed a novel method for analysing RT data in order to capture any periodic patterns that may exist within the moment-by-moment fluctuations in response time performance in ADHD (Castellanos et al 2005). The analysis technique employed – the fast Fourier transform (FFT) – provides an alternate view of a series of RT data. It measures the power of periodic changes in RT at different temporal
frequencies, or in other words, the degree to which periodic patterns of a certain time-scale exist within the RT data series (see Figure One for further explanation). Applied to RT data, any periodically recurring patterns of responding within the data series are manifest as peaks of power at particular frequencies. Importantly, all information contained in the original RT time series remains after the FFT transformation. For instance, integrating power over the entire frequency range (by calculating the area under the spectrum) equates to the overall variance in the data, i.e., the square of the standard deviation of RT. Thus breaking up the frequency range into sections enables the measurement of components of variability defined by specific time-scales.
0.03 Hz were removed from the data using a methodology to smooth the data (detrending using cubic splines). Thus more gradual components of variability, including incidences of slowing of RT over the task block, were not examined.
In the present study using the SART, we sought to extend the principle of variability analysis through spectral techniques and thus further explore the underlying nature of RT variability in ADHD. RT data on the fixed sequence SART is highly suitable for FFT analysis for several reasons. The repetitive structure and fixed ISI allows a priori characterization of discrete points and ranges on the frequency scale in terms of the behaviour underlying them; this deterministic structure allows valid group averaging and between-group comparisons. Also, the long duration of a SART block (225 trials, 5.5 min) affords the examination of very low frequencies, encompassing slow cycles or even gradual, incremental slowing or speeding over the course of the task. This ability to separate types of variability according to temporal characteristics is what distinguishes the FFT analysis from traditional measures of mean and standard deviation of RT. Moreover, these newer techniques may yield potentially interesting measures for use in molecular genetic studies of ADHD.
It has been suggested that fluctuating top-down control, as indexed by increased RT variability, may be a partial explanation for impaired sustained attention (Bellgrove, Hawi, Kirley et al., 2005; Castellanos et al., 2005; Stuss et al., 2003). Working from the hypothesis that neuropsychological heterogeneity within ADHD samples may conceal clinically important deficits, we adopted a heterogeneity reduction technique recently advocated by Nigg and colleagues (Nigg et al., 2005). Impairment on the SART was defined as a commission error score that was 1.5SD above the mean commission error rate for control participants. This cut-off is consistent with criteria used to define
clinically significant impairment, in for example, inattention or hyperactivity/impulsivity. If a score was greater than 1.5 standard deviations (SD) from the control commission error rate - the primary index of sustained attention - the child was placed into an “impaired ADHD” subgroup. A score within 1.5 SDs of the control mean defined an “unimpaired ADHD” subgroup. It was of interest whether neuropsychologically
impaired and unimpaired ADHD groups would differ from controls in terms of sustained attention and the spectral content of the time-series data, using measures of peak
amplitude and area under broad portions of the power spectra.
Methods
Participants
Data from 22 ADHD children had previously been published (Bellgrove, Hawi, Kirley et al., 2005)
Exclusion criteria for participation in the study included known neurological conditions, pervasive developmental disorders, serious head injuries and below average intelligence (below 70 on the WISC-III). Control children were also excluded if they had first degree relatives with ADD or ADHD.
The ADHD participants were recruited as part of an ongoing genetic study (Kirley et al., 2002). Children with ADHD were either referred by consultant psychiatrists or recruited through support groups. Diagnosis was confirmed by psychiatrists using the parent form of the Child and Adolescent Psychiatric Assessment (CAPA) (Angold et al., 1995). All ADHD children met DSM-IV diagnosis for ADHD (American Psychiatric Association, 1995). Eighty-two percent of the ADHD participants had a diagnosis of ADHD
of Social Position (Hollingshead, 1965). Consent was obtained from parents of all children and the experimental work was conducted under the approval of local ethical committees in accordance with the Declaration of Helsinki.
Insert Table 1 about here
Apparatus and Procedure
Participants were presented with a repeating fixed sequence of digits (1 – 9) on a laptop computer. A single digit appeared on the screen for 313 ms; a mask was then presented for 125 ms, after which a response cue (a bold cross) appeared for 63 ms, followed by a second mask for 375ms and a fixation cross for 563 ms. The total inter-stimulus interval was 1439 ms (digit onset to digit onset). Participants were instructed to respond, using a button press, to every digit (go-trial) except ‘3’ (no-go trial). They were asked to respond when the response cue appeared on screen 125 ms after the digit was extinguished, or 438 ms from the start of the trial. The response cue was used to limit the impulsive response style of the ADHD children and to reduce any speed/accuracy trade-offs (Bellgrove, Hawi, Kirley et al., 2005). Participants performed 225 trials, representing 25 runs of the 1 to 9 sequence, lasting approximately 5.5 minutes.
Data Analysis
The 225 RTs per participant were analysed for errors of commission (responses made on the no-go digit 3), omission (non-responses on the go-trials). Mean and standard deviation of the RTs on the go-trials were calculated.
(see Figure 1). Due to the natural 1-9 frequency of the predictable, fixed-sequence SART, meaningful interpretation of group averaged spectra could be made, as spectral peaks coincided across participants.
Datapreparation for FFTs: To calculate the FFTs, a continuous stream of data was needed. RTs for the digit 3 were linearly interpolated from the RTs at digits 2 and 4. Similarly, RTs of less than 100 ms (errors of omission and extremely short responses) were replaced with values interpolated from the RTs of the preceding and following digits. For the fast-frequency area under the spectra (FFAUS) and principle SART peak analyses (see below), individual RT data were detrended, subtracting out any linear components, which were analysed separately. We reasoned that very low frequency shifts in the data might be related to meaningful gradual changes in response time over the course of the task (for instance, slowing in RT over the task). For this reason, linear detrending was employed rather than higher-order detrending that might involve cubic splines, as in (Castellanos et al., 2005)).
Any segments of 75 data points where there were over 10 errors of omission (not
necessarily occurring together) were excluded in the FFT. Subsequently, for the full-run analyses, 19 impaired-ADHD children, 37 unimpaired-ADHD children and 29 controls were included in the FFAUS and principle SART peak analyses. For the half-by-half analyses, the exclusion criteria left 16 impaired-ADHD, 36 unimpaired-ADHD and 28 controls in the analysis.
In relating measurements from the FFT spectra to components of variability, a distinction was made between variance arising from task structure (e.g. strategic speeding and slowing at particular points within the 1-9 sequence) and that arising from true variability not related to the sequence. The former is measured by taking the power at a discrete frequency in the spectrum, while the latter is measured by calculating the area under the spectrum (AUS) over a broad band of interest.
32 unimpaired-ADHD and 29 control children were included in the SFAUS analysis. The data were not detrended in the SFAUS analysis, as the linear components of the RT variation over the entire task were of analytical interest. In a separate test, the linear component in isolation was analysed by fitting regression lines to the RTs of each participant using a first order polynomial fit (linear). The slope of theregression line was then calculated.
The peak power at a particular point in the spectra measures consistency and distinctness of a particular RT pattern. Healthy adult control subjects show a significant slowing in RT on digit 1 relative to digits 9 and 2 in preparation for the upcoming no-go response on the SART (Dockree et al., 2004). If this average pattern is consistently reproduced on every 1 – 9 sequence, we would expect to find a peak in the spectra at the principle SART peak (PSP) of 0.0772 Hz (reciprocal of 9 digits x 1.439 second inter-stimulus interval). The power of the PSP was calculated and divided by the FFAUS, normalising for trial-to-trial variability. This measure reflected any sequence-specific variance. These 8 dependent variables were calculated per participant and averaged per group. All measures were analysed using analysis of variance (ANOVA), t-tests, regression and Bonferroni-adjusted pair-wise comparisons where appropriate.
Results
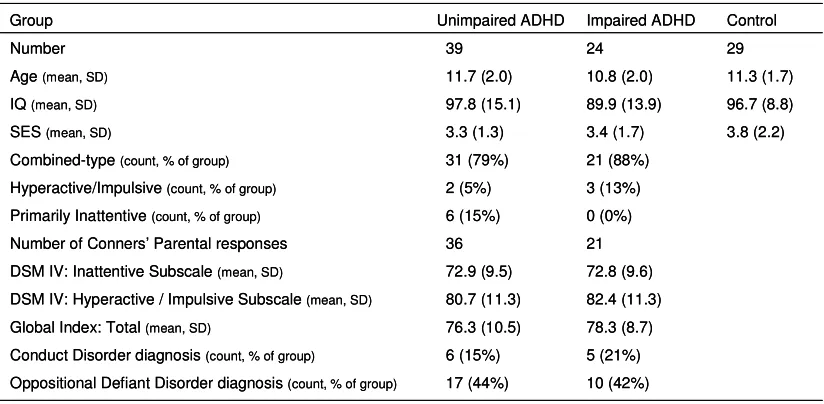
was no significant difference between the impaired- (mean 89.8, SD 13.9), unimpaired-ADHD (mean 97.8, SD 15.1) and control (mean 96.7, SD 8.8) groups in terms of IQ. There was no significant difference in age between the impaired- (mean 10.8, SD 2.0 yrs), unimpaired-ADHD (mean 11.7, SD 2.0 yrs) and control (mean 11.3, SD 1.7 yrs) groups. There were no significant differences between the impaired and unimpaired ADHD children on the Conner’s Parent’s Rating Scale Global Index, Inattentive sub-scale or the Hyperactive sub-scale (see Table One). Most children in the impaired- and unimpaired-ADHD groups were diagnosed with the Combined-type unimpaired-ADHD. Using chi-square tests, the number of children in the impaired- and unimpaired-ADHD groups did not vary in terms of oppositional defiant disorder diagnosis or conduct disorder diagnosis. The control, impaired- and unimpaired-ADHD groups also did not differ in terms of socio-economic class, as determined by the parental occupation sub-scale of the Hollingshead Index of Social Position (Hollingshead, 1965).
Validity of the FFT-based model of variability
The ability of the variability components derived from the FFT analysis (SFAUS, FFAUS and PSP) to predict SD of RT was analysed using linear multiple regression. A significant association was found between the three components and the SD of RT, [R2 = 0.905 (adjusted R2 = 0.901); F(3,69) = 220.13, p < 0.001]. This suggests that the three components account for over 90% of the predicted value of the SD of RT.
Linear Regression of RT
The slope of the regression line, fitted to the RTs of each participant, was calculated and analysed with one-sample t-tests to test if the slope of the regression lines varied
was significantly different from zero [t(1,23) = 2.8, p < 0.01], and this positive slope indicated a significant slowing in RT over the SART. The slope of the regression lines of the control group (mean 0.0, SD 5.2) and the unimpaired-ADHD group (mean 0.6, SD 5.7) were not significantly different from zero. To investigate if there was a difference in the slope of the regression lines between the three groups, a one-way ANOVA was calculated and a significant Group difference was found, [F(2,89) = 3.88, p < 0.024, ηp2 = 0.08]. Pair-wise comparisons suggested that the mean RT regression slope of the
impaired-ADHD group was significantly steeper than that of the control group (p < 0.034) and there was a trend towards a difference between the two ADHD groups (p > 0.063). The unimpaired-ADHD and control groups did not differ significantly.
Insert Figure 1 about here
Slow Frequency Area Under Spectra
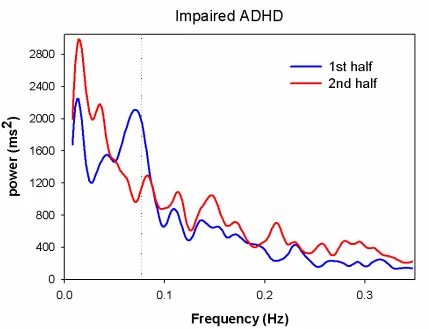
The group average FFT spectra are shown in Figure 1. Group averages of the SFAUS, specific for the frequency bands slower than one SART cycle, were calculated. A one-way ANOVA suggested a significant Group main effect, [F(2,70) = 4.90, p < 0.01, ηp2 = 0.12]. Pair-wise comparisons suggested that the SFAUS of the impaired-ADHD group was significantly greater than that of the unimpaired-ADHD group (p < 0.08), or control group (p=0.05). There was no significant difference between the control and unimpaired-ADHD groups.
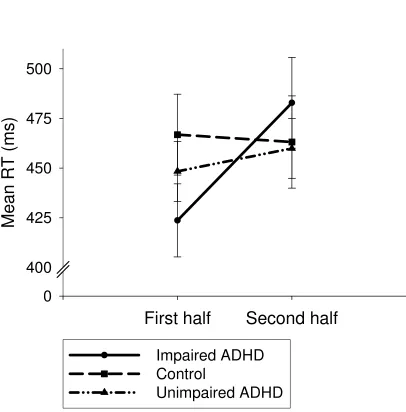
Mean RT
in their mean RTs, when compared across the entire task. The group means were within the 63 ms response cue, demonstrating that participants complied with instructions. Since RT slowed over time for the impaired-ADHD group, the mean RT scores were calculated for the first and second halves of the task and analysed using a Group by Half two-way ANOVA (see Figure 2). The number of data points in each half were equated by eliminating the first 9 RTs arising from the task. There was a significant main effect for Half [F(1,89) = 10.4, p < 0.002, ηp2 = 0.10], which was modified by a significant Group by Half interaction, [F(2,89) = 6.5, p < 0.002, ηp2 = 0.13]. There was no
significant Group difference. Pair-wise comparisons showed that the interaction arose from the increase in mean RT for the impaired-ADHD group between the two halves of the SART task (1st half: mean 424, SD 90 ms; 2nd half: mean 483, SD 112 ms), (p < 0.001). This increase did not occur with the unimpaired-ADHD (mean 448, SD 94 ms; 460, SD 94 ms) and control groups (mean 467, SD 110 ms; 463, SD 125 ms). There were no other significant interactions.
Insert Figure 2 about here
Standard Deviation of RT
To investigate if variability in RT varied over the two halves of the task, the SD of RT scores were calculated for the first and second halves of the task. This was analysed with a Group by Half two-way ANOVA. Significant main effects of Group [F(2,89) = 13.1, p < 0.001, ηp2 = 0.23] and Half were found [F(1,89) = 26.5, p < 0.001, ηp2 = 0.23]. These were modified by a significant Group by Half interaction [F(2,89) = 3.2, p < 0.044, ηp2 = 0.07] (see Figure 2). Pair-wise comparisons indicated that all three groups were
more variable than the other two groups, which did not differ. The differential increase in variability in the second half of the impaired-ADHD group gave rise to the interaction.
Fast Frequency Area Under Spectra
The FFAUS was calculated for each half of the trial and compared using a Group by Half two-way ANOVA. A significant Half main effect was found [F(1,74) = 8.05, p < 0.006, ηp2 = 0.10]. The RTs in the second half were significantly more variable than those in the first half. A significant Group main effect was found [F(2,74) = 5.69, p < 0.005, ηp2 = 0.13]. The impaired-ADHD group was significantly more variable than either the ADHD group (p < 0.025) or the control group (p < 0.004). The unimpaired-ADHD and control groups did not differ. No interaction was found. For all three groups, the level of fast variability increased in the second half of the task, but the impaired-ADHD group was not differentially more variable than the other groups in the second half.
Sequence-specific variance (Principle SART Peak)
Insert Figure 3 about here
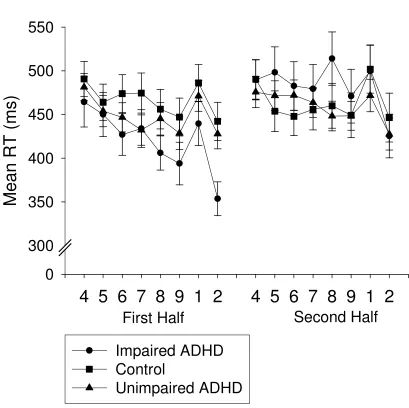
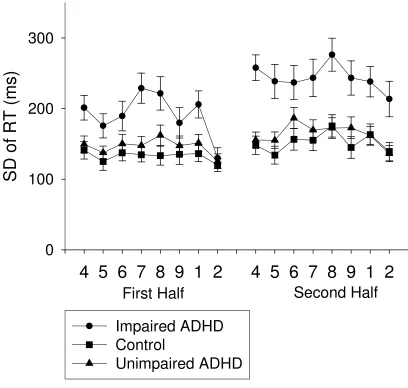
To identify the pattern of responding to the SART task that corresponded to the PSP, the mean RT at each SART digit was calculated for the two halves of the task. As seen in Figure 4, the speeding on digit 2 was the most striking and common pattern amongst the three groups and the mean RT on this digit was analysed using a Group by Half two-way ANOVA. A significant Group by Half interaction was found [F(2,89) = 3.83, p < 0.025, ηp2 = 0.08]. Pair-wise comparisons indicated that the mean RT at digit 2 for the
impaired-ADHD group was significantly faster in the first half (mean 357 ms, SD 94) than the second half (mean 426 ms, SD 120), (p < 0.001). The unimpaired-ADHD and control groups did not vary across the two halves. The mean RT on digit 2 of the impaired-ADHD group was significantly faster than that of the unimpaired-ADHD (p < 0.038) and control groups (p < 0.015) in the first half. There was no difference between the groups in the second half.
Insert Figure 4 about here
significantly greater than the unimpaired-ADHD (p < 0.005) and control groups (p < 0.013).
Commission Errors
The number of commission errors made in each half was analysed using a Group by Half two-way ANOVA. There was a significant main effect of Group for the number of commission errors made, [F(2,89) = 76.4, p < 0.001, ηp2 = 0.63], with the
impaired-ADHD group (mean 6.1, SD 2.2) making significantly more commission errors compared with the unimpaired-ADHD (mean 2.3, SD 1.3) and control groups (mean 2.3, SD 1.6). The unimpaired-ADHD and control groups did not differ. There was also a significant main effect of Half, [F(1,89) = 7.04, p < 0.009, ηp2 = 0.07], with all groups making more commission errors in the second half (mean 3.6, SD 2.4) compared with the first half (mean 3.0, SD 2.4). There was no significant interaction.
Omission Errors
Clinical measures
The three Conners’ indices did not correlate significantly with any of the dependent measures.
Discussion
differentially more variable. This result was mirrored in the error rates. The impaired-ADHD group always made more errors of commission (by definition) and omission than the other groups, demonstrating a robust sustained attention deficit. All three groups made more errors in the second half of the task, compared with the first half, but the error rates of the impaired-ADHD group did not differentially increase in the second half (no interaction). We suggest that the impaired-ADHD group demonstrated a deficit in sustained attention throughout the course of the task, which was not differentially influenced by a time-on-task or arousal effect. Overall, these results suggest that the impaired-ADHD group displayed two key deficiencies – an arousal deficit over the 5.5 minute task and a sustained attention deficit, demonstrated in fast, moment-to-moment variability. These results suggest that the application of FFT analysis techniques is informative and discriminative about the underlying nature of response variability in ADHD.
In terms of the current models of ADHD, the hypothesised arousal deficit is consistent with the cognitive-energetic (Sergeant, 2005) and dynamic developmental (Sagvolden et al., 2005) models of ADHD. The sustained attention deficit is consistent with the ADHD model of executive dysfunction (Barkley, 1997; Pennington & Ozonoff, 1996) and again the dynamic developmental model (Sagvolden et al., 2005). An anatomical basis for the arousal and sustained attention systems is discussed below.
minutes) (Epstein et al., 2003; Shallice et al., 2002) and some have found no change (Loo et al., 2003; van der Meere & Sergeant, 1988). In studies examining RTs over shorter testing periods (~5 minutes), differences in slow shifts in RT performance between ADHD and control children have either not been tested (Bellgrove, Hawi, Kirley et al., 2005; O'Connell et al., 2004) or have not been found (Heinrich et al., 2001). In the current study, reducing the heterogeneity of the ADHD group (through sub-division according to commission errors) allowed a clearer dissociation in performance of the ADHD groups over this shorter timeframe. The progressive slowing in RT by the
impaired ADHD group may be due to a gradual decrease in arousal levels over the course of the 5.5 minute period. This would be consistent with a disruption to a lower-level arousal system, possibly involving the reticular formation, the noradrenergic locus coeruleus (Nigg, 2005) and/or the anterior cingulate (Critchley, Melmed, Featherstone, Mathias, & Dolan, 2002; Paus et al., 1997).
The traditional measures of mean and SD of RT blend the entire range of temporal characteristics of RT variability and so by their very nature do not allow a parcellation of temporally distinct forms of variability. The impaired-ADHD group was more variable in RT than the other groups and this variability increased differentially in the second half of the trial. This increased variability in RT (SD of RT) reflects a combination of the slowing in RT over the task and the increased fast-frequency trial-to-trial variability in RT of the impaired-ADHD group. The differential effect in the second half is likely a reflection of the low-frequency component.
The FFAUS measure reflects fast-frequency trial-to-trial variability without
performance of the impaired-ADHD group on the fast-frequency variability, commission and omission errors is suggestive of a loss of executive functional control, possibly involving the right hemisphere frontoparietal system (Robertson & Garavan, 2004), which may then be responsible for deficits in sustained attention (Bellgrove, Hawi, Kirley et al., 2005). All three groups increased their fast-frequency trial-to-trial variability over the course of the task. The lack of a differential change in RT and error rate performance in the impaired-ADHD group over the length of the SART suggests that delay-aversion and/or motivational difficulties were not differentially affecting this group. Sustained attention may operate over short time periods, for example at 0.05 Hz (20 seconds) for a self-paced task such as the CPT (Castellanos et al., 2005), or at 0.0772 Hz (13 seconds) for the response-cued SART. A deficit in sustained attention in the impaired-ADHD group may be related to a deficit in frontoparietal circuitry in ADHD (Silk et al., 2005; Sowell et al., 2003). Neuroimaging of children with ADHD performing this sustained attention test will help to clarify the exact areas of dysfunction. ADHD may therefore be associated with deficits in bottom-up (sub-cortical arousal) and top-down (fronto-parietal) systems that are necessary for cognitive control.
As hypothesised by Nigg and colleagues (Nigg et al., 2005), there was a large degree of overlap in the performance of the control and ADHD children. Sixty-two percent of the total ADHD group fell into the unimpaired-ADHD group and this group did not differ from the control group on any measure. ADHD children may present with similar
clinical symptoms but may have deficits in different pathways in the brain (Castellanos et al., 2005). By sub-grouping according to a commission error rate, a deeper
In conclusion, the impaired-ADHD group showed a progressive increase in mean RT and increase in SD of RT over the course of the 5.5 minute SART, which we suggest is related to a deficit in arousal. This group also showed a consistently poor performance in fast-frequency variability in RT and in commission and omission error rates, which did not worsen differentially compared with the other two groups over the course of the task. These deficits may be due to particular difficulties in sustaining attention over much shorter time-periods and may be reflective of frontoparietal dysfunction.
Acknowledgements
References
American Psychiatric Association. (1995). Diagnostic and Statistical Manual of Mental Disorders (4 ed.). Washington, DC: American Psychiatric Association.
Angold, A., Predergast, M., Cox, A., Harrington, R., Simonoff, E., & Rutter, M. (1995). The Child and Adolescent Psychiatric Assessment (CAPA). Psychological Medicine, 25, 739-753.
Barkley, R. A. (1997). Behavioral Inhibition, Sustained Attention, and Executive Functions: Constructing a Unifying Theory of ADHD. Psychological Bulletin, 121(1), 65-94.
Bellgrove, M. A., Hawi, Z., Kirley, A., Gill, M., & Robertson, I. H. (2005). Dissecting the attention deficit hyperactivity disorder (ADHD) phenotype: Sustained attention, response variability and spatial attentional asymmetries in relation to dopamine transporter (DAT1) genotype. Neuropsychologia, 43(13), 1847-1982. Bellgrove, M. A., Hawi, Z., Lowe, N., Kirley, A., Robertson, I. H., & Gill, M. (2005).
DRD4 gene variants and sustained attention in attention deficit hyperactivity disorder (ADHD): effects of associated alleles at the VNTR and -521 SNP. American Journal of Medical Genetics. Part B, Neuropsychiatric Genetics: the Official Publication of the International Society of Psychiatric Genetics, 136(1), 81-86.
Bellgrove, M. A., Hester, R., & Garavan, H. (2004). The functional neuroanatomical correlates of response variability: evidence from a response inhibition task. Neuropsychologia, 42(14), 1910-1916.
Castellanos, F. X., Sonuga-Barke, E. J., Scheres, A., Di Martino, A., Hyde, C., & Walters, J. R. (2005). Varieties of Attention-Deficit/Hyperactivity Disorder-related intra-individual variability. Biological Psychiatry, 57(11), 1416-1423.
Castellanos, F. X., & Tannock, R. (2002). Neuroscience of attention-deficit/hyperactivity disorder: the search for endophenotypes. Nature Reviews Neuroscience, 3(8), 617-628.
Conners, C. K. (1997). Conners' rating scales - revised: Technical manual. New York: Multi-Health Systems Inc.
Critchley, H. D., Melmed, R. N., Featherstone, R. N., Mathias, C. J., & Dolan, R. J. (2002). Volitional control of autonomic arousal: A functional magnetic resonance study. NeuroImage, 16, 909-919.
Dockree, P. M., Kelly, S. P., Roche, R. A. P., Hogan, M. J., Reilly, R. B., & Robertson, I. H. (2004). Behavioural and physiological impairments of sustained attention after traumatic brain injury. Cognitive Brain Research, 20(3), 403-414.
Epstein, J. N., Erkanli, A., Conners, C. K., Klaric, J., Costello, J. E., & Angold, A. (2003). Relations between Continuous Performance Test performance measures and ADHD behaviours. Journal of Abnormal Child Psychology, 31(5), 543-554. Heinrich, H., Moll, G. H., Dickhaus, H., Kolev, V., Yordanova, J., & Rothenberger, A.
(2001). Time-on-task analysis using wavelet networks in an event-related potential study on attention-deficit hyperactivity disorder. Clinical
Neurophysiology, 112(7), 1280-1287.
Hurks, P. P. M., Adam, J. J., Hendriksen, J. G. M., Vles, J. S. H., Feron, F. J. M., Kalff, A. C., Kroes, M., Steyaert, J., Crolla, I. F. A. M., van Zeben, T. M. C. B., & Jolles, J. (2005). Controlled visuomotor preparation deficits in
Attention-Deficit/Hyperactivity Disorder. Neuropsychology, 19(1), 66-76.
Kirley, A., Hawi, Z., Daly, G., McCarron, M., Mullins, C., Millar, N., Waldman, I., Fitzgerald, M., & Gill, M. (2002). Dopaminergic system genes in ADHD: toward a biological hypothesis. Neuropsychopharmacology, 27(4), 607-619.
Kuntsi, J., & Stevenson, J. (2001). Psychological mechanisms in hyperactivity: II. The role of genetic factors. Journal of Child Psychology and Psychiatry, 42(2), 211-219.
Leth-Steensen, C., King Elbaz, Z., & Douglas, V. I. (2000). Mean response times, variability, and skew in the responding of ADHD children: a response time distributional approach. Acta Psychologia, 104, 167-190.
Loo, S. K., Specter, E., Smolen, A., Hopfer, C., Teale, P. D., & Reite, M. L. (2003). Functional effects of the DAT1 polymorphism on EEG measures in ADHD. Journal of the American Academy of Child and Adolescent Psychiatry, 42(8), 986-993.
Manly, T., Owen, A. M., McAvenue, L., Datta, A., Lewis, G. H., Scott, S. K., Rorden, C., Pickard, J., & Robertson, I. H. (2003). Enhancing the Sensitivity of a Sustained Attention Task to Frontal Damage: Convergent Clinical and Functional Imaging Evidence. Neurocase, 9(4), 340-349.
Nigg, J. T. (2005). Neuropsychologic theory and findings in
Attention-Deficit/Hyperactivity Disorder: The state of the field and salient challenges for the coming decade. Biological Psychiatry, 57, 1424-1435.
Nigg, J. T., Willcutt, E. G., Doyle, A. E., & Sonuga-Barke, E. J. (2005). Causal heterogeneity in attention-deficit/hyperactivity disorder: do we need
neuropsychologically impaired subgroups? Biological Psychiatry, 57, 1224-1230. O'Connell, R., G., Bellgrove, M. A., Dockree, P. M., & Robertson, I. H. (2004). Reduced electrodermal response to errors predicts poor sustained attention performance in attention deficit hyperactivity disorder. Neuroreport, 15(16), 2535-2538.
Paus, T., Zatorre, R. J., Hofle, N., Caramanos, Z., Gotman, J., Petrides, M., & Evans, A. C. (1997). Time-Related Changes in Neural Systems Underlying Attention and Arousal During the Performance of an Auditory Vigilance Task. Journal of Cognitive Neuroscience, 9(3), 392-408.
Pennington, B. F., & Ozonoff, S. (1996). Executive Functions and Developmental Psychopathology. Journal of Child Psychology and Psychiatry, 37(1), 51-87. Robertson, I. H., & Garavan, H. (2004). Vigilant attention. In M. S. Gazzaniga (Ed.), The
cognitive neurosciences (3 ed., pp. 631-640). Cambridge: MIT Press.
Robertson, I. H., Manly, T., Andrade, J., Baddeley, B. T., & Yiend, J. (1997). 'Oops!': performance correlates of everyday attentional failures in traumatic brain injured and normal subjects. Neuropsychologia, 35(6), 747-758.
Sergeant, J. (2005). Modeling attention-deficit/hyperactivity disorder: a critical appraisal of the cognitive-energetic model. Biological Psychiatry, 57(11), 1248-1255. Shallice, T., Marzocchi, G. M., Coser, S., Del Savio, M., Meuter, R. F., & Rumiati, R. I.
(2002). Executive function profile of children with attention deficit hyperactivity disorder. Developmental Neuropsychology, 21(1), 43-71.
Silk, T., Vance, A., Rinehart, N. J., Egan, G. F., O'Boyle, M., Bradshaw, J., L., &
Cunnington, R. (2005). Fronto-parietal activation in attention-deficit hyperactivity disorder, combined type: functional magnetic resonance imaging study. The British Journal of Psychiatry, 187, 282-283.
Sowell, E. R., Thompson, P. M., Welcome, S. E., Henkenius, A. L., Toga, A. W., & Peterson, B. S. (2003). Cortical abnormalities in children and adolescents with attention-deficit hyperactivity disorder. The Lancet, 362(9397), 1699-1707. Stuss, D. T., Murphy, K. J., Binns, M. A., & Alexander, M. P. (2003). Staying on the job:
the frontal lobes control individual performance variability. Brain, 126(Pt 11), 2363-2380.
van der Meere, J., & Sergeant, J. (1988). Focused attention in pervasively hyperactive children. Journal of Abnormal Child Psychology, 16(6), 627-639.
van der Meere, J., Shalev, R., Borger, N., & Gross-Tsur, V. (1995). Sustained attention, activation and MPH in ADHD: a research note. Journal of Child Psychology and Psychiatry, 36(4), 697-703.
van der Meere, J., Wekking, E., & Sergeant, J. A. (1991). Sustained attention and pervasive hyperactivity. Journal of Child Psychology and Psychiatry, 32(2), 275-284.
Weschler, D. (1992). WISC-III UK. London: Harcourt Brace & Company.
Figure 1
Figure 2: Mean (2A) and standard deviation (2B) of response time scores (with standard errors) for each participant group for the first and second halves of the fixed version of the SART.
Figure 2A
First half
Second half
M
e
a
n
R
T
(
m
s
)
0
400
425
450
475
500
Impaired ADHD
Control
Figure 2B
First half
Second half
S
D
o
f
R
T
(
m
s
)
0
50
100
150
200
250
Impaired ADHD
Control
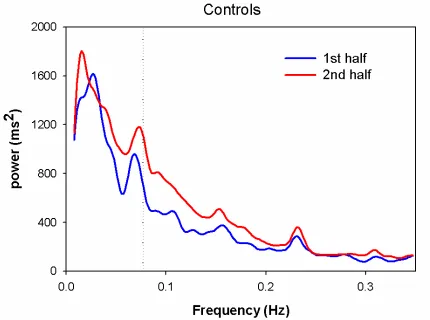
Figure 3: Grand average of the fast Fourier transform of the mean response time for each half of the fixed SART task, for the impaired-ADHD group (3A), the unimpaired-ADHD group (3B) and the control group (3C). Note that the principle SART peak (PSP) varies around 0.0772 Hz (dotted line) for the impaired-ADHD and control groups. The
Figure 3A
Figure 4: Mean (4A) and standard variation (4B) in response time scores (with standard errors) for each participant group for each digit for the first and second halves of the fixed version of the SART.
Figure 4A
4 5 6 7 8 9 1 2
4 5 6 7 8 9 1 2
M
e
a
n
R
T
(
m
s
)
0
300
350
400
450
500
550
Impaired ADHD
Control
Unimpaired ADHD
Figure 4B
4 5 6 7 8 9 1 2
4 5 6 7 8 9 1 2
S
D
o
f
R
T
(
m
s
)
0
100
200
300
Impaired ADHD
Control
Unimpaired ADHD
Table One
Table 1: Demographic and diagnostic information on the ADHD and control participants
Number
Global Index: Total (mean, SD)
Impaired ADHD 24 78.3 (8.7) Unimpaired ADHD 39 76.3 (10.5)
DSM IV: Inattentive Subscale (mean, SD) 72.9 (9.5) 72.8 (9.6) DSM IV: Hyperactive / Impulsive Subscale (mean, SD) 80.7 (11.3) 82.4 (11.3)
Control 29
Conduct Disorder diagnosis (count, % of group) 6 (15%) 5 (21%) Oppositional Defiant Disorder diagnosis (count, % of group) 17 (44%) 10 (42%)
Age (mean, SD) 11.7 (2.0) 10.8 (2.0) 11.3 (1.7) IQ (mean, SD) 97.8 (15.1) 89.9 (13.9) 96.7 (8.8)
Number of Conners’ Parental responses 36 21 Combined-type (count, % of group) 31 (79%) 21 (88%) Hyperactive/Impulsive (count, % of group) 2 (5%) 3 (13%) Primarily Inattentive (count, % of group) 6 (15%) 0 (0%)
SES (mean, SD) 3.3 (1.3) 3.4 (1.7) 3.8 (2.2) Group
Number
Global Index: Total (mean, SD)
Impaired ADHD 24 78.3 (8.7) Unimpaired ADHD 39 76.3 (10.5)
DSM IV: Inattentive Subscale (mean, SD) 72.9 (9.5) 72.8 (9.6) DSM IV: Hyperactive / Impulsive Subscale (mean, SD) 80.7 (11.3) 82.4 (11.3)
Control 29
Conduct Disorder diagnosis (count, % of group) 6 (15%) 5 (21%) Oppositional Defiant Disorder diagnosis (count, % of group) 17 (44%) 10 (42%)
Age (mean, SD) 11.7 (2.0) 10.8 (2.0) 11.3 (1.7) IQ (mean, SD) 97.8 (15.1) 89.9 (13.9) 96.7 (8.8)
Number of Conners’ Parental responses 36 21 Combined-type (count, % of group) 31 (79%) 21 (88%) Hyperactive/Impulsive (count, % of group) 2 (5%) 3 (13%) Primarily Inattentive (count, % of group) 6 (15%) 0 (0%)