Poverty Traps and Climate Change
Richard S.J. Tol
a,b,c,dAbstract: We use a demo-economic model to examine the question of whether climate change could widen or deepen poverty traps. The model includes two crucial mechanisms. Parents are risk averse when deciding how many children to have; fertility is high when infant survival is low. High fertility spreads scarce household resources thin, resulting in children being poorly educated. At the macro level, technological progress is slow because of decreasing returns to scale in agriculture. With high population growth and slow technological progress, the economy stagnates. If, on the other hand, infant survival is high, then fertility is low, education is high, and the economy grows exponentially. Diarrhea and malaria are among the leading causes of infant mortality; both are sensitive to weather and climate. There may thus be a climate-related poverty trap where climate change increases disease burdens that reinforce poverty. We estimate finite-mixture models of per capita income, fertility, and mortality at the national scale. As predicted by the model, the observations are bi-modal. Temperature has statistically significant effects: hotter countries are more likely to be classified as poor; hotter countries are more likely to be classified as high mortality; and the number of children per woman in high fertility societies increases with temperature. We then use the model to simulate a number of different futures, focusing on the question whether climate change may widen and deepen the health/fertility poverty trap. The results suggest that this is unlikely for reasonable parameter choices. Climate change may have a substantial effect on specific causes of infant mortality, but the effect on total infant mortality is more muted. More importantly, the model is driven by infant survival, and climate change has a much smaller proportional effect on survival than on mortality. Furthermore, climate change will be relatively small over the next few decades. In the medium term, the impact of climate change is therefore dwarfed by other factors (health and education in this model). In the long term, climate change is more important, but the long term is primarily shaped by the medium term.
Key words:climate change, poverty traps, infant mortality
Corresponding Author: [email protected]
a Economic and Social Research Institute, Dublin, Ireland
b Institute for Environmental Studies, Vrije Universiteit, Amsterdam, The Netherlands c Department for Spatial Economics, Vrije Universiteit, Amsterdam, The Netherlands d Department of Economics, Trinity College, Dublin, Ireland
ESRI working papers represent un-refereed work-in-progress by researchers who are solely responsible for the content and any views expressed therein. Any comments on these papers will be welcome and should be sent to the author(s) by email. Papers may be downloaded for personal use only.
Poverty Traps and Climate Change
1. Introduction
Poverty is concentrated in the tropics and subtropics. Whereas the correlation between temperature and wealth is indisputable, there is strong disagreement on causation. Some argue that geography is a prime driver of economic development (Diamond 1999); others argue economic growth is not affected by environmental factors (Easterly and Levine 2003). If climate can partly explain poverty, then climate change may well have an impact too. Previous papers studied the impact of climate change on the rate of exponential growth (Fankhauser and Tol 2005). In this paper, we focus on poverty traps.
As far as we know (Section 2), we are the first to study the effects of climate change on poverty traps. The literature on climate and poverty traps is still thin, and we contribute a new model calibration with new sensitivity analysis, as well as new empirical evidence.
There are three research parts to the paper. In Section 3, we use a model in which risk-averse parents decide on the number and level of education of their children. Fertility is high when infant survival is low. Household resources are spread thin, and children are poorly educated as a result. At the macro level, technological progress is slow with decreasing returns to scale in agriculture. With high population growth and slow technological progress, the economy stagnates. On the other hand, the economy grows exponentially when infant survival is high, fertility is low, and education is high. Diarrhea and malaria are among the leading causes of infant mortality; both are sensitive to weather and climate. There is thus prima facie evidence that there may be a climate-related poverty trap.
In the empirical part of the paper (Section 4), we test the key predictions of the theoretical model, particularly the double equilibria. Observations of per capita income, fertility, and mortality are indeed bi-modal.. Hotter countries are more likely to be classified as poor; hotter countries are more likely to be classified as high mortality; and the number of children by women in high fertility societies increases with temperature. The data thus support the theory: climate partly explains why some countries are poor and others rich.
We then (Section 5) use the model to simulate a number of different futures, focusing on the question whether climate change may widen or deepen the health/fertility poverty trap.
2. Previous literature
slightly larger than the direct impact on markets1 – that is, the total impact is more than twice as large as the direct impact – while the 4th model (which emphasizes human capital accumulation) points to an
indirect impact that is 1.5 times as large as the direct impact. In the three models, impacts crowd out consumption and investment in physical capital, while in the fourth model investment in human capital too is crowded out. (Hallegatte 2005) reaches a similar conclusion. (Hallegatte and Thery 2007) highlight that the impact of climate change through natural hazards on economic growth can be amplified by market imperfections and the business cycle. (Eboli et al. 2010) use a multi-sector, multi-region growth model. The impact of climate change would lead to a 0.3% reduction of GDP in 2050. Regional impacts are more pronounced, ranging from -1.0% in developing countries to +0.4% in Australia and Canada. Using a biophysical model of the human body’s ability to do work, (Kjellstrom et al. 2009) find that by the end of the century climate change may reduce labor productivity by 11-27% in the humid (sub)tropics. Assuming an output elasticity of labor of 0.8 (Romer 1996), this would reduce economic output in the affected sectors (involving heavy manual labor without air conditioning) by 8-22%. Although structural change in the economy may well reduce the dependence on manual labor and air conditioning would be an effective adaptation, even the ameliorated impact would have a substantial, but as yet unquantified, impact on economic growth.
In a statistical analysis, (Dell et al. 2009) find that one degree of warming would reduce income by 1.2% in the short run and by 0.5% in the long run . The difference is due to adaptation. (Horowitz, 2009) finds a much larger effect: a 3.8% drop in income in the long run for one degree of warming. In a yet-unpublished study, (Dell et al. 2008) find that climate (change) has no effect on economic growth in countries with an income above the global median ($PPP,20003170) but a large impact on countries below
the median. If companies can fully adapt to a new climate in 10 years time, economic growth in the 21st
century would be 0.6% slower if climate changes according to the A2 scenario than in the case without climate change. This is a large impact. For example, if economic growth is 2.6% per year without climate change, and 2.0% with, then a century of climate change would reduce income by 44%.
The above studies are about the impact of climate and climate change on economic growth at national or regional scales. However, some countries (or groups of people within countries) have not enjoyed any growth at all, living at subsistence level much like previous generations.
Because poverty is concentrated in the tropics and subtropics, some analysts concluded that a tropical climate is one cause of poverty. (Gallup et al. 1999) emphasize the link between climate, disease, and poverty while (Masters and McMillan 2001) focus on climate, agricultural pests, and poverty. Other studies (Acemoglu et al. 2001;Acemoglu et al. 2002;Easterly and Levine 2003) argue that climatic influence on development disappears if differences in human institutions (the rule of law, education, etc) are accounted for. (Bhattacharyya 2009) attempts to reconcile the two schools of thought, arguing that the geography of diseases is more important for the least developed economies, while institutions
1 There is considerable uncertainty about the direct impact of climate change on markets (Tol 2009). The impact on
matter more for developed and other developing countries. (van der Vliert 2008) demonstrates that climate affects human culture and thus institutions, but this venue has yet to be explored in the economic growth literature. (Bloom et al. 2003) find limited support for an impact of climate change on past growth in a single-equilibrium model, but strong support in a multiple-equilibrium model: hot and wet conditions and large variability in rainfall reduce long-term growth in poor countries (but not in hot ones) and increase the probability of being poor.
There are two equilibria in the model of (Galor and Weil 1996). One is characterized by high population growth and low capital intensity (the ‘Malthusian’ equilibrium), the other by low population growth and high capital intensity (the ‘Solowian’ equilibrium). Physical labor plays a more important role in setting wages, output, and savings in the Malthusian equilibrium than in the Solowian equilibrium. This implies that anything that affects physical labor is more important in the Malthusian equilibrium than in the Solowian one. And, as capital intensity separates the two equilibria, a reduced productivity of physical labor would reduce savings and capital intensity, locking the economy deeper into the poverty trap. Physical labor would be negatively affected by an increase in morbidity and by a decrease of crop yields (as the model implicitly assumes that physical labor is primarily used in agriculture). Skilled labor is affected by long-term cognitive impairment, which is associated with childhood malnutrition and disease, both of which are linked to climate. Climate may thus help to explain the occurrence of poverty traps, and climate change could widen poverty traps.
(Bonds et al. 2010) and (Strulik 2008) posit theoretical models and offer limited empirical support. Climate-related diseases such as malaria and diarrhea impair children’s cognitive and physical development. This leads to poverty in their later life so that there are limited means to protect their own children against these diseases. Furthermore, high infant mortality may induce parents to have many children so that their investment in education and health care is spread thin. An increase in infant and child mortality and morbidity due to climate change would thus trap more people in poverty. The model by (Strulik 2008) is discussed in detail below. It is a micro-based dynamic general equilibrium model. The model by (Bonds et al. 2010), on the other hand, is a model of disease dynamics enhanced with phenomenological descriptions of the impact of income on disease and of the impact of disease on income.
3. The model
We use the model by (Strulik 2008). Let utility u be given by
(1)
𝑢
= ln(
𝑐 − 𝑐̅
) +
𝛽
1ln(
𝑛𝜋
) +
𝛽
2ln (
ℎ
)
.That is, utility is derived from consumption c in excess of subsistence consumption
𝑐̅
; from the number of surviving childen nπ; and from the education of those children (which is proportional to therelative investment h).The children’s survival probability π depends on an exogenous probability
𝜋�
and the investment h. Specifically,(2)
𝜋
=
𝜋�
+ (1
− 𝜇𝜋�
)
𝜆ℎ
. where μ and λ are parameters.Solving the first order conditions under budget constraint y = c+nhy gives (3)
𝑐
=
𝑦+𝛽1𝑐̅1+𝛽1,
(4)
𝑛
=
(1−𝜇𝜋�)(1−𝑐̅ 𝑦⁄ )𝛽1𝛽2𝜆 (𝛽1−𝛽2)(1+𝛽1)𝜋� , and (5) ℎ= (𝛽1−𝛽2)𝜋�(1−𝜇𝜋�)𝛽2𝜆.
Per capita income y follows from the production function: (6)
𝑌
=
𝐴
(
ℎ�𝐿
)
𝛼𝑋
1−𝛼.where A is total factor productivity. Normalizing land supply X=1, marginal labour productivity sets the wage:
(7)
𝑦
=
𝛼𝐴ℎ�
𝛼𝐿
𝛼−1.The model dynamics follow from At+1 = (1+g)At (exogenous technological progress),
ℎ�
𝑡+1=
ℎ
𝑡 (humancapital investment), and Lt+1 = (n-1)Lt (population growth). The exogenous survival rate is given by
𝜋�
=
𝑎
(1
− 𝑒
−𝑏𝑦)
.This set of equations behaves as follows. Details and derivations are given by (Strulik 2008). Equations (6) and (7) are Malthusian in that there are decreasing returns to scale in labor. However, this can be overcome if technological progress is sufficiently high and if there is sufficient investment in human capital. If income is close to subsistence consumption, then both the number of children and investment in their health and education is low. The investment in children monotonically increases with income. However, the number of children first increases and then decreases with income.
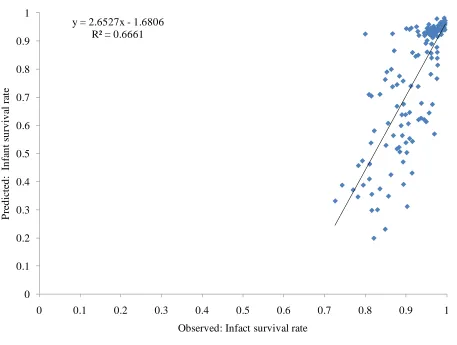
The model has two equilibria. In one, there is exponential growth. The other equilibrium is a poverty trap. This is illustrated in Figure 1. The calibration of the model is almost the same as in (Strulik 2008):
compare the modeled child mortality to the observed under-five mortality and the modeled number of children to the observed total fertility rate, respectively, in 2005. Figure 1 shows the average growth rate over a century, assuming a 20% exogenous increase in total factor productivity per 20 years. In this particular calibration, economies are caught in a poverty trap if their income is below $600 per person per year. The equilibrium income is$240/p/yr.
Figure 2 shows the impact of a 1% decrease in the survival probability per twenty years on the average growth rate over the century. The effect is always negative, but lowest for very low incomes, highest for somewhat higher incomes, and in the middle for higher incomes. As a result, the poverty trap widens and deepens. Economies are caught in a poverty trap if their initial income is below $800/p/yr (rather than $600/p/yr), and the equilibrium income is$220/p/yr (rather than $240/p/yr).
4. Empirical evidence
The Strulik model makes three predictions: There are two equilibria for per capita income, for fertility, and for mortality. We test these predictions and the sensitivity of these equilibria to climate. (Tang et al. 2009) set out to test the “income-climate trap of health development” – much as we do. However, although the text speaks of vicious and virtuous cycles, the estimated model is (1) linear (plus interaction terms) and (2) unimodal. Their model specification is inconsistent with their research question. The “twin peaks” model by (Quah 1996) is, as the name suggests, bimodal and thus directly tackles the question of two equilibria. (Bloom et al. 2004) apply a bimodal model to the relationship between health, climate, and development. They improve on Quah’s approach by including explanatory variables. Advances in statistical and computational capabilities since 2001 (when the paper was written) mean that further improvements are possible.
We estimate a finite mixture model, using Partha Deb’s procedure in Stata.2 Conceptually, the model is
simple. There are two regimes. Each regime is a linear model of the dependant variable in its explanatory variables, estimated by (what would be) ordinary least squares (in a single regime). The two regimes are linked by a logit model. Numerically, the model is complicated because it is highly nonlinear. Particularly, regime-sorting is endogenous (unlike in, say, a censoring model).
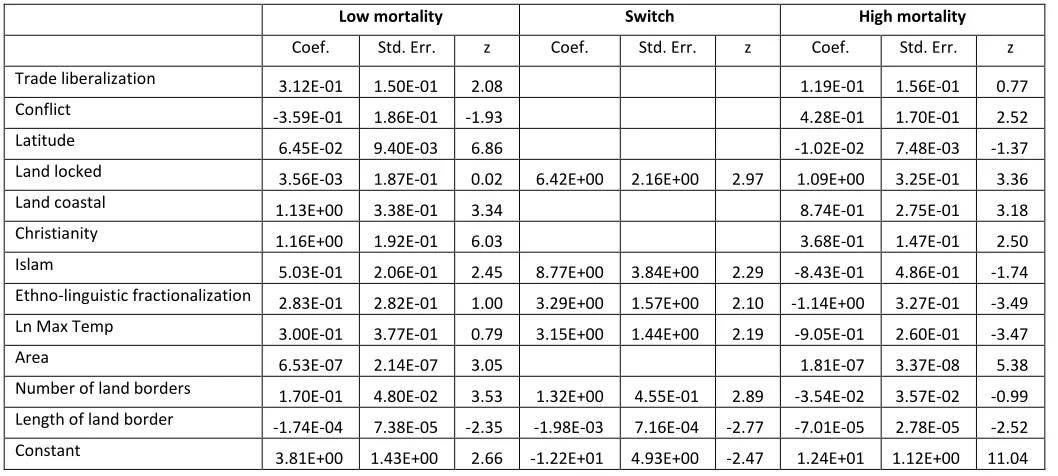
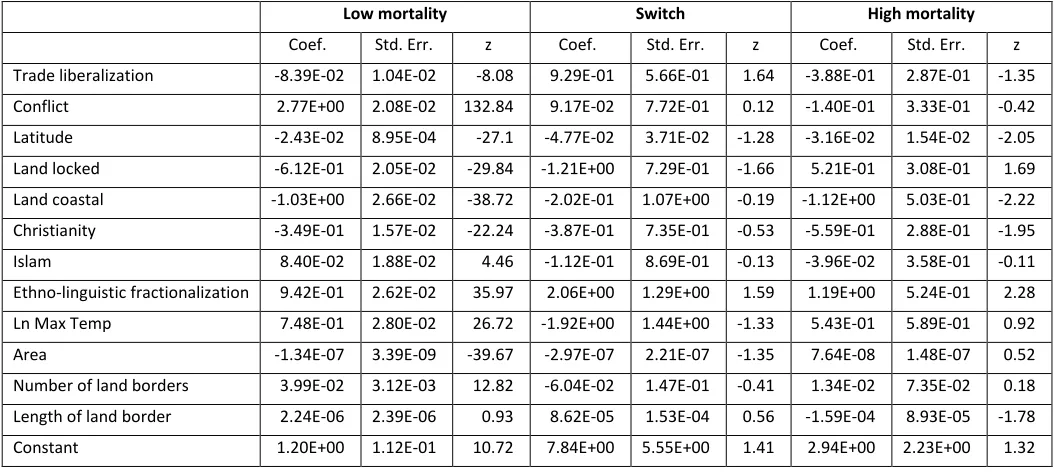
Table 1 summarizes the regression results. Appendix B gives the full details. Hotter countries are more likely to be classified as low income. Among the rich countries, hotter ones are less rich. There is no statistically significant relationship between temperature and per capita income is poor countries. Hotter countries are more likely to be classified as high mortality, but temperature does not have a significant effect on mortality among either high or low mortality countries. Hotter countries are somewhat likely to be classified as high fertility. Among high fertility countries, hotter ones have higher fertility. Among low fertility countries, temperature does not have a significant impact. These results are, qualitatively, in line with the prediction of the Strulik model.
Table 1 also indicates which other explanatory variables are significant. The results are consistent with previous findings in the correlates-of-growth literature (Barro and Sala-i-Martin 1995). Most importantly, the data support a bimodal model of per capita income, mortality and fertility. That is, the data discern two equilibria.
5. The impact of climate change
Figure 2 illustrates the impact of a steady increase in childhood mortality. This may happen because of climate change or for other reasons. We use the same model calibration as above. Instead of considering a continuum of arbitrary economies, we take the average income of each of some 200 countries in the year 2000 as our starting point. We assume that malaria mortality increases by 7.9% per degree Celsius of warming (Tol 2002). We assume that diarrhea mortality increases by �𝑇𝑏𝑎𝑠𝑒+𝑊𝑎𝑟𝑚𝑖𝑛𝑔
𝑇𝑏𝑎𝑠𝑒 �
1.14
(Link and Tol 2004). The shares of diarrhea and malaria in total under-15 mortality are taken from the Global Burden of Disease project.3
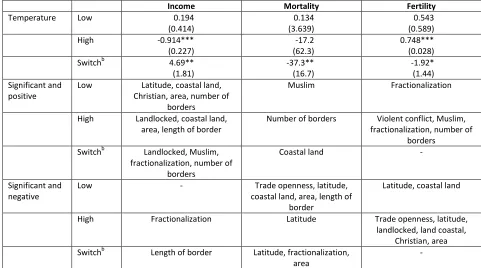
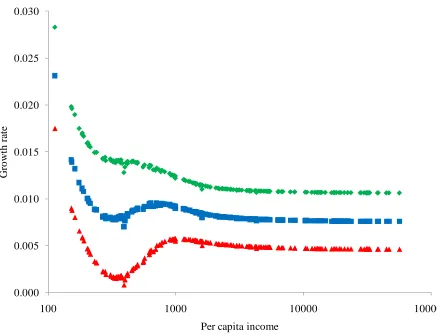
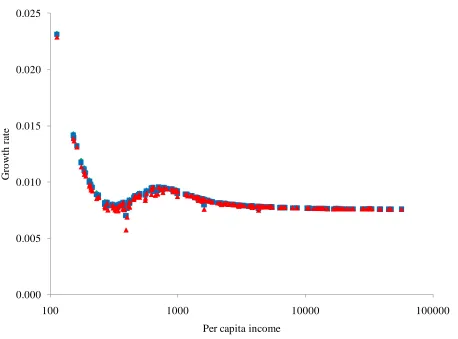
Figure 3 shows the average growth rate over the period 2000-2100 for three alternative scenarios of technological change. In the base case, labor productivity exogenously increases by 45% per 20 years, so that per capita income in Africa grows by 1.0% per year – just as it did over 1950-2000. In the high case, technological change goes up to 54% and income growth to 1.5%; in the low case, technology grows by 37% and income by 0.5%. Figure 4 again shows the growth rate for three scenarios of temperature change. In the base case, the Earth warms by 3.4ºC between 2000 and 2100, the IPCC’s best guess in the A2 scenario (Meehl et al. 2007). In the high scenario, warming is twice as large, and in the low scenario half as large. Figure 5 repeats the exercise for labor elasticity. In the base case, the labor elasticity of output is 0.7. In the high case, this is 0.8, and in the low case 0.6.4
The pattern that emerges is that poorest countries grow fastest. There is a dip in growth around $350 per person per year, and a local maximum around $700/p/yr. The richest country grows about 0.8% per year. This pattern becomes less (more) pronounced as exogenous technological change increases (decreases). For the low scenario, although growth approaches zero in a few countries, all grow. The effect of climate change is minimal. The effect of the labor elasticity is large. For a high value, poorer countries grow faster than richer countries. For a low value, there is an economic shrink between $250/p/yr and $550/p/yr.
In sum, Figures 3-5 show that economic parameters dominate the climate signal. The reason is that the crucial parameter in the Strulik model is the childhood survival rate. The minimum under-5 survival rate is 91%. That is, maximum mortality is 9%. Malaria and diarrhea make up to 39% of that. If malaria and
3 http://www.who.int/topics/global_burden_of_disease/en/
diarrhea death rates double, mortality does up from 9 to 12%, but survival only falls from 91 to 88% -- a modest change. Furthermore, the more dramatic impacts of climate change will only occur later in the century whereas economic growth is cumulative over the century, with the early decades having a large effect.
6. Discussion and conclusion
In this paper, we offer three pieces of evidence on the questions whether there may be a climate-related poverty trap and how climate change would affect that poverty trap. In the first part of the paper, we borrow and calibrate a theoretical model in which a health-related poverty trap emerges from the rational choices of economic agents and their interactions with the environment. More specifically, if infant mortality is high, parents opt to have many children but lack the resources to educate them well. Poorly educated children command low wages, and their sheer numbers further depress their productivity. The economy is thus trapped in poverty. This becomes more pronounced if infant mortality increases for whatever reason. However, this model is nothing but an internally consistent mathematical formalization of a hypothesis. In the second part, we use finite-mixture classification-cum-regression models to show that the international cross-section of per capita income, fertility, and mortality supports that there are two equilibria (one poverty trap and one with exponential growth); and that climate has a statistically significant impact: hotter countries are more likely to be classified as poor; hotter countries are more likely to be classified as high mortality; and the number of children by women in high fertility societies increases with temperature. In the third part, we use the model to explore alternative futures. We assume that climate change increase the incidence of malaria and diarrhea. We show that it is unlikely for reasonable parameter choices that climate change would widen and deepen the health/fertility poverty trap. Climate change would have a substantial effect on specific causes of infant mortality, but a small overall impact on total infant mortality. The effect on infant survival, the variable that drives the model, is smaller still. Moreover, the impact of climate change is dwarfed by health and education in the short to medium term, as would be expected. In the long term, climate change is more important, but the long term is of course primarily shaped by the medium term.
As with any study, there are a number of caveats. The model is but one of many models with poverty traps (Azariadis and Stachurski 2005;Chakraborty et al. 2010). Other models may suggest different conclusions. The model used is specified such that it is computable in closed form. While this should not affect the qualitative results, it may well have an impact on the quantitative findings.
In the scenario study, we consider the impact of climate change on malaria and diarrhea mortality. We omit morbidity and consequent stunting (Walker et al. 2007). We ignore other impacts of climate change on mortality, notably through undernutrition (Lloyd et al. 2011).
All this suggests that the current paper is a first step only. We offer a coherent framework to study the effects of changes in infant mortality on the early stages of economic growth. That framework can be used, by ourselves and others, to explore variations and alternatives. This includes other risk factors than climate change, and progress in medicine, such as a malaria vaccine (The RTS 2011).
Acknowledgements
David Anthoff, Francesco Bosello, Kristie Ebi and Stephane Hallegatte had excellent comments on an earlier version of this paper. Christoph Walsh provided research assistance. Financial support by CEC DG Research (FP7, ClimateCost) is gratefully acknowledged.
References
Acemoglu, D., S.Johnson, and J.A.Robinson (2001), 'The Colonial Origins of Comparative Development: An Empirical Investigation', American Economic Review, 91, (4), 1369-1401.
Acemoglu, D., S.Johnson, and J.A.Robinson (2002), 'Reversal of fortune: Geography and institutions in the making of the modern world income distribution', Quarterly Journal of Economics, 117, (4), 1231-1294.
Azariadis, C. & Stachurski, J. Chapter 5 Poverty Traps. 1[SUPPL. PART A], 295-384. 2005. Ref Type: Serial (Book,Monograph)
Barro, R.J. and X.Sala-i-Martin (1995), Economic Growth MIT Press, Cambridge.
Bhattacharyya, S. (2009), 'Institutions, Diseases and Economic Progress: A Unified Framework', Journal of Institutional Economics, 5, (1), 65-87.
Bloom, D.E., D.Canning, and J.Sevilla (2003), 'Geography and Poverty Traps', Journal of Economic Growth, 8, 355-378.
Bloom, D.E., D.Canning, and J.Sevilla (2004), 'The Effect of Health on Economic Growth: A Production Function Approach', World Development, 32, (1), pp. 1-13.
Bonds, M.H., D.C.Keenan, P.Rohani, and J.D.Sachs (2010), 'Poverty trap formed by the ecology of infectious diseases', Proceedings of the Royal Society B: Biological Sciences, 277, (1685), pp. 1185-1192. Chakraborty, S., C.Papageorgiou, and F.Pérez Sebastián (2010), 'Diseases, infection dynamics, and development', Journal of Monetary Economics, 57, (7), pp. 859-872.
Dell, M., B.F.Jones, and B.A.Olken (2008), Climate Change and Economic Growth: Evidence from the Last Half Century, Working Paper 14132 ,National Bureau of Economic Research, Washington,DC.
Diamond, J. (1999), Guns, Germs, and Steel - The Fates of Human Societies W.W. Norton & Company, New York London.
Easterly, W. and R.Levine (2003), 'Tropics, germs, and crops: how endowments influence economic development', Journal of Monetary Economics, 50, (1), 3-39.
Eboli, F., R.Parrado, and R.Roson (2010), 'Climate-change feedback on economic growth: Explorations with a dynamic general equilibrium model', Environment and Development Economics, 15, (5), pp. 515-533.
Fankhauser, S. and R.S.J.Tol (2005), 'On climate change and economic growth', Resource and Energy Economics, 27, (1), 1-17.
Gallup, J.L., J.D.Sachs, and A.D.Mellinger (1999), 'Geography and Economic Development', International Regional Science Review, 22, (2), 179-232.
Galor, O. and D.N.Weil (1996), 'The Gender Gap, Fertility, and Growth', American Economic Review, 86, (3), 374-387.
Hallegatte, S. (2005), 'The Long Time Scales of the Climate-Economy Feedback and the Climatic Cost of Growth', Environmental Modeling and Assessment, 10, 227-289.
Hallegatte, S. and D.Thery (2007), 'Are the economic impacts of climate change underestimated?', Revue d'Economie Politique, 117, (4), pp. 507-522.
Jerzmanowski, M. (2006), 'Empirics of hills, plateaus, mountains and plains: A Markov-switching approach to growth', Journal of Development Economics, 81, (2), pp. 357-385.
Kjellstrom, T., R.S.Kovats, S.J.Lloyd, M.T.Holt, and R.S.J.Tol (2009), 'The Direct Impact of Climate Change on Regional Labor Productivity', Archives of Environmental and Occupational Health, 64, (4), pp. 217-227.
Link, P.M. and R.S.J.Tol (2004), 'Possible economic impacts of a shutdown of the thermohaline circulation: an application of FUND', Portuguese Economic Journal, 3, (2), 99-114.
Lloyd, S.J., R.S.Kovats, and Z.Chalabi (2011), 'Climate Change, Crop Yields, and Undernutrition:
Development of a Model to Quantify the Impact of Climate Change Scenarios on Child Undernutrition',
Environmental Health Perspectives.
Masters, W.A. and M.S.McMillan (2001), 'Climate and Scale in Economic Growth', Journal of Economic Growth, 6, (3), 167-186.
Meehl, G.A., T.F.Stocker, W.D.Collins, P.Friedlingstein, T.Gaye, J.M.Gregory, A.Kitoh, R.Knutti, J.M.Murphy, A.Noda, S.C.B.Raper, I.G.Watterson, A.J.Weaver, and Z.-C.Zhen (2007), 'Global Climate Projections', in Climate Change 2007: The Physical Science Basis -- Contribution of Working Group I to the Fourth Assessment Report of the Intergovernmental Panel on Climate Change, D. Qin et al. (eds.), Cambridge University Press, Cambridge, pp. 747-847.
Quah, D.T. (1996), 'Twin peaks: Growth and convergence in models of distribution dynamics', Economic Journal, 106, (437), pp. 1045-1055.
Strulik, H. (2008), 'Geography, health, and the pace of demo-economic development', Journal of Development Economics, 86, (1), pp. 61-75.
Tang, K.K., D.Petrie, and D.S.P.Rao (2009), 'The income-climate trap of health development: A comparative analysis of African and Non-African countries', Social Science and Medicine, 69, (7), pp. 1099-1106.
The RTS, S.C.T.P. (2011), 'First Results of Phase 3 Trial of RTS,S/AS01 Malaria Vaccine in African Children',
New England Journal of Medicine, 2011, (02287), pp. 1-13.
Tol, R.S.J. (2002), 'Estimates of the Damage Costs of Climate Change - Part 1: Benchmark Estimates',
Environmental and Resource Economics, 21, (1), 47-73.
Tol, R.S.J. (2009), 'The Economic Effects of Climate Change', Journal of Economic Perspectives, 23, (2), 29-51.
Table 1. Summary regression results: Estimates for the effect of the natural logarithm of the maximum monthly temperature and the sign of other explanatory variablesa.
Income Mortality Fertility
Temperature Low 0.194
(0.414) (3.639) 0.134 (0.589) 0.543
High -0.914***
(0.227) (62.3) -17.2 0.748*** (0.028) Switchb 4.69**
(1.81) -37.3** (16.7) -1.92* (1.44) Significant and
positive Low Christian, area, number of Latitude, coastal land, borders
Muslim Fractionalization
High Landlocked, coastal land,
area, length of border Number of borders fractionalization, number of Violent conflict, Muslim, borders
Switchb Landlocked, Muslim, fractionalization, number of
borders
Coastal land -
Significant and
negative Low - coastal land, area, length of Trade openness, latitude, border
Latitude, coastal land
High Fractionalization Latitude Trade openness, latitude, landlocked, land coastal,
Christian, area Switchb Length of border Latitude, fractionalization,
area -
Figure 1. The growth rate of per capita income as a function of per capita income. -0.20%
-0.15% -0.10% -0.05% 0.00% 0.05% 0.10% 0.15% 0.20% 0.25% 0.30%
0 1000 2000 3000 4000 5000 6000 7000 8000 9000 10000
E
conom
ic
g
row
th
ra
te
Initial per capita income Poverty trap: 600 $/p/yr
Figure 2. The impact of an increase in mortality on economic growth. -0.18%
-0.16% -0.14% -0.12% -0.10% -0.08% -0.06% -0.04% -0.02% 0.00%
0 1000 2000 3000 4000 5000 6000 7000 8000 9000 10000
C
ha
ng
e i
n e
conom
ic
g
row
th r
at
e
Initial per capita income Poverty trap: 800 $/p/yr
Figure 3. The average growth rate of per capita income for 2000-2100 as a function of per capita income in 2000 for three alternative scenarios of exogenous improvements in labor productivity.
0.000 0.005 0.010 0.015 0.020 0.025 0.030
100 1000 10000 100000
Gr
o
wt
h
r
at
e
Figure 4. The average growth rate of per capita income for 2000-2100 as a function of per capita income in 2000 for three alternative scenarios of climate change.
0.000 0.005 0.010 0.015 0.020 0.025
100 1000 10000 100000
Gr
o
wt
h
r
at
e
Figure 5. The average growth rate of per capita income for 2000-2100 as a function of per capita income in 2000 for three alternative assumptions about the labor elasticity of output.
-0.005 0.000 0.005 0.010 0.015 0.020 0.025 0.030 0.035
100 1000 10000 100000
Gr
o
wt
h
r
at
e
Appendix A: Calibration results
Figure A1. Observed under-five mortality and modeled children mortality. y = 2.6527x - 1.6806
R² = 0.6661
0 0.1 0.2 0.3 0.4 0.5 0.6 0.7 0.8 0.9 1
0 0.1 0.2 0.3 0.4 0.5 0.6 0.7 0.8 0.9 1
P
re
d
ic
te
d
: I
n
fa
n
t s
u
rv
iv
al r
ate
Figure A2. Observed total fertility rate and modeled total fertility rate.
y = 0.4987x + 1.5031 R² = 0.404
0 1 2 3 4 5 6 7 8
0 1 2 3 4 5 6 7 8
P
re
d
ic
te
d
: T
o
ta
l f
er
tility
r
ate
Appendix B: Regression results
Table B1. Regression results for per capita income.
Low mortality Switch High mortality
Coef. Std. Err. z Coef. Std. Err. z Coef. Std. Err. z Trade liberalization 3.12E-01 1.50E-01 2.08 1.19E-01 1.56E-01 0.77
Conflict -3.59E-01 1.86E-01 -1.93 4.28E-01 1.70E-01 2.52
Latitude 6.45E-02 9.40E-03 6.86 -1.02E-02 7.48E-03 -1.37
Land locked 3.56E-03 1.87E-01 0.02 6.42E+00 2.16E+00 2.97 1.09E+00 3.25E-01 3.36
Land coastal 1.13E+00 3.38E-01 3.34 8.74E-01 2.75E-01 3.18
Christianity 1.16E+00 1.92E-01 6.03 3.68E-01 1.47E-01 2.50
Islam 5.03E-01 2.06E-01 2.45 8.77E+00 3.84E+00 2.29 -8.43E-01 4.86E-01 -1.74 Ethno-linguistic fractionalization 2.83E-01 2.82E-01 1.00 3.29E+00 1.57E+00 2.10 -1.14E+00 3.27E-01 -3.49 Ln Max Temp 3.00E-01 3.77E-01 0.79 3.15E+00 1.44E+00 2.19 -9.05E-01 2.60E-01 -3.47
Area 6.53E-07 2.14E-07 3.05 1.81E-07 3.37E-08 5.38
Table B2. Regression results for total fertility.
Low mortality Switch High mortality
Table B3. Regression results for infant mortality.
Low mortality Switch High mortality
Year Number Title/Author(s) ESRI Authors/Co-authors Italicised 2011
412 UK Tourists, The Great Recession and Irish Tourism Policy
Niamh Callaghan and Richard S.J. Tol
411 Disasters and Development: Natural Disasters, Credit Constraints and Economic Growth
Thomas K.J. McDermott, Frank Barry, Richard S.J. Tol
410 “One Dummy Won’t Get it: The Impact of Training Programme Type and Duration on the Employment Chances of the Unemployed in Ireland”
Seamus McGuinness, Philip J. O’Connell and Elish Kelly
409 Carrots without Sticks: The Impacts of Job Search Assistance in a Regime with Minimal Monitoring and Sanctions
Seamus McGuinness, Philip J. O’Connell and Elish Kelly
408 A critique of The Economics of Climate Change in Mexico Francisco Estrada, Richard S. J. Tol, Carlos Gay-García
407 Carbon Tax Scenarios and their Effects on the Irish Energy Sector
Valeria Di Cosmo and Marie Hyland
406 Internationalisation and the Innovation Activities of Services Firms
Iulia Siedschlag, Neill Killeen, Donal Smith and Catriona O’Brien
405 The Time Evolution of the Social Cost Of Carbon: An Application of FUND
David Anthoff, Steven Rose, Richard S.J. Tol and Stephanie Waldhoff 404 The Uncertainty about the Social Cost of Carbon: A Decomposition
Analysis Using FUND
David Anthoff and Richard S.J. Tol
403 Climate Policy Under Fat-Tailed Risk: An Application of Dice In Chang Hwang, Frédéric Reynès and Richard S.J. Tol
For earlier Working Papers see