Munich Personal RePEc Archive
Reference Dependent Altruism
Breitmoser, Yves and Tan, Jonathan H.W.
7 January 2014
Online at
https://mpra.ub.uni-muenchen.de/52774/
Reference Dependent Altruism
Yves Breitmoser
HU Berlin
Jonathan H. W. Tan
∗University of Nottingham
January 7, 2014
Abstract
In view of behavioral patterns left unorganized by current social preference
the-ories, we propose a theory of reference dependent altruism (RDA). With RDA,
one’s degree of altruism increases at reference points. It induces equity and
ef-ficiency effects that are conditional on whether or not payoffs meet reference
points. We verify the theory first by experimentally analyzing majority
bargain-ing, where observed behavior contradicts existing theories but confirms RDA.
Us-ing parameter estimates from majority bargainUs-ing, we then make out-of-sample
predictions for Charness-Rabin, Engelmann-Strobel, and Bolton-Ockenfels games.
RDA organizes these seemingly disparate games out-of-sample, which validates
our hypothesis that pro-social behavior primarily relates to reference points.
JEL–Codes:C72, C78, D72
Keywords:bargaining, non-cooperative game, laboratory experiment, social pref-erences, quantal response equilibrium
∗We gratefully acknowledge comments of Friedel Bolle, Maria Montero, and participants of the
1
Introduction
Research on social preferences took a progressive leap with theories of inequity
aver-sion proposed by Fehr and Schmidt (1999) and Bolton and Ockenfels (2000). They
helped us make sense of deviations from egoistic behavior in ultimatum, dictator,
mar-ket, and trust games—observations previously considered “anomalous” (Thaler, 1988;
Camerer and Thaler, 1995). Subsequent work of Charness and Rabin (2002),
Engel-mann and Strobel (2004), and Kritikos and Bolle (2001) showed that subjects were
willing to give up equity for efficiency and reciprocity. This suggests an interplay of
egoistic, equity, efficiency, and reciprocity concerns, but with respective weights that vary across games. For instance, Bolton and Ockenfels (2006) argue that there is a
“trade-off between efficiency and equity motives” (p. 1906) and that “perceptions of
fairness depend on context” (p. 1909). Applying a model of social preferences with
context dependent weights to economic analysis is obviously problematic.
To solve this problem, our paper proposes and tests a model of reference
depen-dent altruism (RDA). Utilities are simple linear functions ui = xi+αxj of payoffs
(xi,xj), but the altruism weight α depends on the relation of the payoff xi to a
refer-ence point. We estimate the model parameters on novel experimental data on majority
bargaining, which we show to be particular suitable to discrimate social preference
the-ories, and then use these estimates to make out-of-sample predictions for three widely
discussed data sets. RDA explains behavior best both in-sample and out-of-sample.
Our estimates indicate that 45% of the subjects use their ex-ante expected payoff as
reference points, while 55% of the subjects use the opponents’ payoffs as reference points. All subjects are highly efficiency concerned when they are above their
refer-ence points and only mildly altruistic below their referrefer-ence point. The conjunction of
the utility jump and the altruism weight change at the reference point captures both
efficiency and equity concerns, as well as reciprocity in the sense of Rabin (1993).
To illustrate, Figure 1 shows three games analyzed by Charness and Rabin (2002,
CR02). These games are mini dictator and ultimatum games testing whether player
2 prefers the allocation (x1,x2) = (8,2)to(0,0), and whether the preference depends
on the payoff allocation in an outside option foregone by player 1. Choices in Berk23
are similar to those faced by proposers in mini dictator games, and choices in Berk27
and Berk31 are similar to those faced by responders who have received inequitable
Figure 1: Example games (with percentages of choices) from Charness and Rabin (2002, CR02) where egoism or efficiency dominates inequity aversion
(a) CR02 “Berk23”
Pl. 2
8,2 0,0
L: 100% R: 0%
(b) CR02 “Berk27”
Pl. 1
5,5 Pl. 2
8,2 0,0
Out: 41% In: 59%
L: 91% R: 9%
(c) CR02 “Berk31”
Pl. 1
7.5,7.5 Pl. 2
8,2 0,0
Out: 73% In: 27%
L: 88% R: 12%
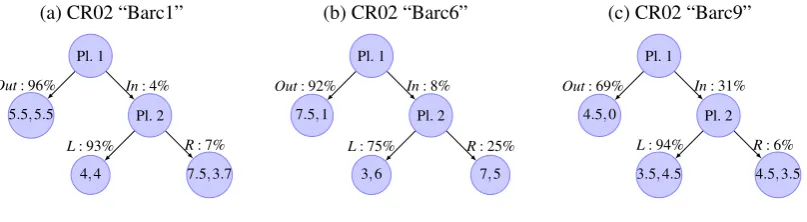
Figure 2: Example games (with percentages of choices) from Charness and Rabin (2002) where egoism or inequity aversion dominates efficiency or reciprocity
(a) CR02 “Barc1”
Pl. 1
5.5,5.5 Pl. 2
4,4 7.5,3.7
Out: 96% In: 4%
L: 93% R: 7%
(b) CR02 “Barc6”
Pl. 1
7.5,1 Pl. 2
3,6 7,5
Out: 92% In: 8%
L: 75% R: 25%
(c) CR02 “Barc9”
Pl. 1
4.5,0 Pl. 2
3.5,4.5 4.5,3.5
Out: 69% In: 31%
L: 94% R: 6%
and Schmidt (1999), henceforth abbreviated as “FS”, with standard envy weights (see
e.g. Fehr and Schmidt, 2010), she would pick (0,0) in all cases. In the experiment,
however, all subjects in Berk23 and around nine of ten subjects in Berk27 and Berk31
chose the egoistic and efficient allocation (8,2). In these cases, efficiency concerns
therefore outweigh equity concerns.
In contrast, consider three other games by Charness and Rabin in Figure 2. These
games resemble mini trust games. Player 1’s decision to enter the game unlocks the
efficient allocationR, and by picking Rplayer 2 can reciprocate player 1. Yet, in all
three games, most players 2 picked the egoistic or equitable optionL. That is, equity
concerns outweigh efficiency (and reciprocity) now—although the personal costs of
player 2 are very small (e.g. in Barc1) in relation to the efficiency gain that would
follow from pickingR.1
1Note that egoism, i.e. maximization of pecuniary payoffs, explains behavior in these examples,
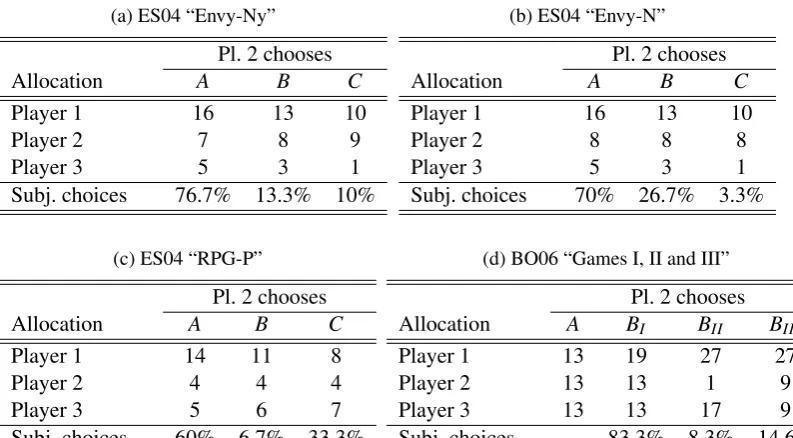
[image:4.595.99.503.321.432.2]Table 1: Experimental games (with percentages of choices) from Engelmann and Stro-bel (2004, ES04) and Bolton and Ockenfels (2006, BO06) where efficiency concerns dominate inequity aversion and vice versa, respectively
(a) ES04 “Envy-Ny”
Pl. 2 chooses
Allocation A B C
Player 1 16 13 10
Player 2 7 8 9
Player 3 5 3 1
Subj. choices 76.7% 13.3% 10%
(b) ES04 “Envy-N”
Pl. 2 chooses
Allocation A B C
Player 1 16 13 10
Player 2 8 8 8
Player 3 5 3 1
Subj. choices 70% 26.7% 3.3%
(c) ES04 “RPG-P”
Pl. 2 chooses
Allocation A B C
Player 1 14 11 8
Player 2 4 4 4
Player 3 5 6 7
Subj. choices 60% 6.7% 33.3%
(d) BO06 “Games I, II and III”
Pl. 2 chooses
Allocation A BI BII BIII
Player 1 13 19 27 27
Player 2 13 13 1 9
Player 3 13 13 17 9
Subj. choices - 83.3% 8.3% 14.6%
Note: In the games of ES04, inequity aversion predictsC, while efficiency concerns predict A. In
Games I, II and III of BO06, subjects choose betweenAandBI,AandBII, orAandBIII, respectively
(e.g. 83.3% chooseBIoverA); inequity aversion predictsA, while efficiency concerns predictsBx. The
observations choice frequencies reported for BO06 are for their “equal opportunities mode”, which has a random role allocation procedure similar to that used by Engelmann and Strobel (2004).
Related results on subjects switching between efficiency and equity concerns are
presented by Engelmann and Strobel (2004, ES04) and Bolton and Ockenfels (2006,
BO06). In Engelmann and Strobel’s dictator games shown in Tables 1a–1c, most
sub-jects (as player 2) chose the efficient optionAover the equitable optionC, despite the
latter being the unequivocal prediction of FS inequity aversion for all possible param-eter values. Compare this to the majority rule voting games of Bolton and Ockenfels
shown in Table 1d. In Game I, most subjects (as player 2) picked the efficient option
BI over the equitable optionA, contradicting theories of inequity aversion again, but in
Games II and III where efficiency gains inB require larger personal losses relative to
A(for player 2), most subjects chose equity (A) over efficiency (B).
With these mixed results, one may be tempted to conclude that egoism, efficiency
and equity concerns all shape behavior, but the empirical weights that one would
2006). We argue that the pattern along which these observations can be organized fol-lows the relation of the players’ payoffs to two simple reference points. Our basic idea
is captured in a model ofreference dependent altruism (RDA) which posits that one’s
altruism weight changes at one’s reference point.
Reference points may be one’s ex-ante expectation or the opponent’s payoff. We
refer to them asabsoluteandrelativereference points, respectively, and estimate that
the majority of subjects (55%) uses the opponents’ payoffs as reference payoffs. This
explains, for example, why subjects seem to value equity over efficiency in CR02’s
trust games (Figure 2) and in BO06’s voting games II andIII (Table 1d), while they
value efficiency over equity in CR02’s mini-ultimatum games (Figure 2) and in ES04’s
three-player dictator games. In the latter cases, the players’ relation to their reference
points is constant across options, while in the former cases, their payoff is above the
reference point in one option and below it in the other. Now, if the utility is ui =
xi+0.9xj if xi ≥xj, i.e. above the reference point, and ui =xi+0.2xj if xi <xj,
i.e. below it, then reaching the reference point implies a utility jump on the order of
0.7xj.2 This simultaneously explains why player 2 prefers(4,4)to(7.5,3.7)in Barc1
and(8,2)to(0,0)independently of outside options in Figure 1, while also explaining
behavior in standard dictator and trust games.
Our test of RDA is twofold. First, we identify reference dependence of altruism
in majority bargaining following Baron and Ferejohn (1989): The game proceeds in
rounds, in each round one player is randomly assigned to propose an allocation, and
the proposal is implemented if a majority votes in the affirmative (otherwise a new
round begins). Majority bargaining is particularly interesting for two reasons. On the
one hand, comparing the indefinite horizon game with a one round variant allows us to
sharply separate CES altruism (Andreoni and Miller, 2002), FS inequity aversion (Fehr
and Schmidt, 1999), CR reciprocity (Charness and Rabin, 2002), and RDA with either absolute or relative reference points. On the other hand, behavior in the canonical
indefinite horizon multi-player bargaining game (Fréchette et al., 2005a,b; Fréchette
et al., 2012; Montero et al., 2008) contradicts current theories of social preferences
(Montero, 2007). Understanding preferences in this context is important, as it
facili-tates analyses of majority decisions under different institutional designs, e.g. in boards
2Utility jumps at reference points have previously been evidenced in the context of demand
and assemblies (Snyder Jr et al., 2005). Due to the utility jump at the reference point, RDA predicts that subjects take risks to reach the reference point, rejecting proposals
below their reference point in the hope of reaching it in the next round. This prediction
explains behavior, and indeed, RDA fits the experimental data in both games better
than existing theories—qualitatively (Section 4) and quantitatively (Section 5).
Second, we show that RDA not only fits better, but also predicts better
out-of-sample. We test the validity of RDA in a wide domain of games well known in the
literature as tests of social preferences. In Section 6, we use RDA with parameter
esti-mates from our experiment to make out-of-sample predictions for Charness-Rabin
dic-tator and response games, Engelmann-Strobel dicdic-tator games, and Bolton-Ockenfels
voting games. We compare the accuracy of RDA’s predictions against those of models
by Fehr and Schmidt (1999) and Charness and Rabin (2002). The evidence supports
RDA as a general theory that is consistently valid across this spectrum of games. Lim-itations and future research are discussed in the concluding Section 7.
2
Reference dependent altruism
The relevance of reference points in decision making has been established in a large
variety of contexts. The best-known example is the Prospect theory of Kahneman and
Tversky (1979) for individual choice under risk. Reference points also shape market interactions with risk (K˝oszegi and Rabin, 2006, 2007) and even strategic choice as
in loss-aversion equilibria (Shalev, 2002). A related branch of literature established
the relevance of reference points with respect to social preferences. Examples include
evidence on focal points in alternating bargaining (Murnighan et al., 1988), social
com-parisons to reference points in three-player ultimatum bargaining (Knez and Camerer,
1995), and norms as reference points in dictator and ultimatum games (Andreoni and
Bernheim, 2009; Bicchieri and Chavez, 2010).
Our model of reference dependent altruism (RDA) builds on these observations
establishing the relevance of reference points. RDA-players have simple altruistic
util-ity functions, such as ui =xi+αxj with xi,xj being the players’ payoffs, where the
altruism weightαdepends on the relation ofxito a reference point. That is,utility
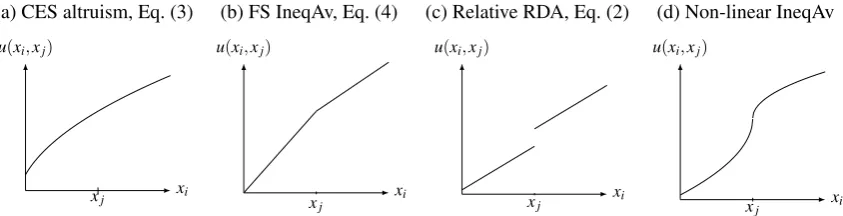
ref-Figure 3: The various utility functions forα=0.5 andβ=0.1
(a) CES altruism, Eq. (3)
xi
u(xi,xj)
xj
(b) FS IneqAv, Eq. (4)
xi
u(xi,xj)
xj
(c) Relative RDA, Eq. (2)
xi
u(xi,xj)
xj
(d) Non-linear IneqAv
xi
u(xi,xj)
xj
Note: In this case, where the opponent’s payoff is given and he cannot “misbehave”, CR reciprocity model is equivalent to FS inequity aversion, and the branches of RRDA have the same slope (while they have different slopes along the Pareto-frontier,xi+xj=C, in bargaining games).
erence points: theex-ante expected payoff (following K˝oszegi and Rabin, 2006, 2007)
and theopponent’s payoff (following Fehr and Schmidt, 1999; Bolton and Ockenfels, 2000). We will refer to the former as an absolute reference point and to the latter as
a relative reference point.3 The utilities of players with absolute or relative reference dependent altruism, abbreviated as ARDA and RRDA, respectively, are
UiARDA(x) =xi+α
∑
j6=ixj·Ixi≥x∗i +β
∑
j6=ixj·Ixj<x∗i (1)
UiRRDA(x) =xi−α
∑
j6=ixj·Ixi<xj−β
∑
j6=ixj·Ixi≥xj, (2)
for all payoff profiles x∈Rn. Here, x∗
i is the absolute reference point of the ARDA
player. We define x∗i to be the ex-ante equilibrium payoff of i in case all players are
payoff maximizers (assuming this value is unique). Thus,α>βimplies that an
ARDA-player becomes (more) altruistic toward all his opponents once his payoff exceeds the
ex-ante expectation. In contrast, α>β implies for RRDA-players that they become (more) altruistic toward a specific opponent once his payoff exceeds that of this
partic-ular opponent.
The difference between RDA and other utility functions, e.g. those of K˝oszegi and Rabin (2006, 2007), Fehr and Schmidt (1999) and Bolton and Ockenfels (2000), is
that RDA implies a utility jump the reference point (if the opponents’ payoffs are not
zero). ARDA with α>β imply that utility jumps by(α−β)∑j6=ixj oncexi crosses
3Additional reference points such as effort and production may become relevant if the players share
[image:8.595.83.505.144.252.2]the reference pointx∗i. RRDA withα>βimply that utility jumps by(α−β)xjwhen i overtakes j. These utility jumps are the key difference to existing theories of social
preferences,4 most notably CES altruism and FS inequity aversion, which are respec-tively defined as
UiCES(x) =(1−α)·(1+xi)β+α/n∑j=6 i(1+xj)β
/β, (3)
UiFS(x) =xi−
∑
j6=iα(xj−xi)·Ixi<xj−
∑
j6=iβ(xi−xj)·Ixi≥xj. (4)
CES utility functions are used frequently in analyses of dictator and public goods
games (Andreoni and Miller, 2002; Goeree et al., 2002; Cappelen et al., 2007). The
functional form used here has been proposed by Cox et al. (2007) and is adopted for
its numerical stability. Here, αmeasures the degree of altruism, and 1/(1−β)is the
elasticity of substitution. FS inequity aversion captures behavior in ultimatum and trust
games, amongst others (Fehr and Schmidt, 1999, 2010). Generally, it is assumed that envy (α) outweighs guilt (β) and that guilt is bounded, i.e. 0≤β<α andβ<1/2. Charness and Rabin (2002) extend FS inequity aversion by introducing a reciprocal component with weightθ. In two-player cases, CR utilities are
UiCR(x) = (1−ρ·r−σ·s−θ·q)xi+ (ρ·r+σ·s+θ·q)xj, (5)
wherer=1 ifxi≥xj, elser=0,s=1 ifxi<xj, elses=0, andq=−1 if jpreviously
“misbehaved” by making a welfare-reducing decision, elseq=0. CR reciprocity
re-duces to FS inequity aversion forθ=0 (after relabeling parametersβ=ρandα=−σ). Ifθ>0, however, CR-players tend to punish welfare-diminishing behavior of their
op-ponents, as their altruism weights decrease after such “misbehavior”.
The two RDA utility functions, FS inequity aversion, and CR reciprocity are all instances of reference dependent preferences in the sense of Neilson (2006), and the
technical differences are subtle. RRDA and FS inequity aversion model players
com-paring their own payoff to their opponent’s payoff,UARDA models players comparing
their payoff to their ex-ante expectation, andUCRmodel players comparing both, their
own payoff to their opponent’s payoff and the aggregate welfare to the welfare
max-imum. Thus, CR reciprocity assumes two reference points, andUCR is continuous at
4Similar jump discontinuities have been observed recently in risk and time preferences (Diecidue
the opponent’s payoff but exhibits a jump discontinuity at the welfare maximum. UFS
is continuous on the whole domain, while both RDA utility functions exhibit jump
discontinuities at their respective reference points.
The key implication of a utility jump is that the player is willing to take risks to reach the reference point. This relates RDA toS-shaped utility functions as in Prospect
theory, see e.g. Figure 3d. The difference is that RDA players take risksonlyto reach
the reference point. They are risk neutral as long as they are securely above or below
the reference point. Thus, the only difference between RRDA and FS inequity
aver-sion is indeed the utility jump at the reference point, and the only difference between
RRDA and ARDA, in turn, is the location of the reference point—which allows us to
specifically analyze utility continuity. An additional analysis of the curvature along the
utility branches requires further experiments.
3
The experimental games
Our experiment implements majority bargaining as modeled by Baron and Ferejohn
(1989). Their random-proposer model is the canonical model of decision making in
committees and parliaments with empirical applications ranging from estimating
pro-poser power in the US Congress (Knight, 2005) to modeling labor relations Okada
(2011). The Baron-Ferejohn game proceeds in rounds, with indefinite time horizon. In each round, a player is randomly recognized as proposer, he proposes an allocation
(of the “Dollar”), and the other players vote on it. The proposal is implemented if a
majority votes in the affirmative, otherwise a new round begins.
Fréchette et al. (2005a) showed that the results of laboratory tests on this game
resemble those of the field—and those results are generally more equitable than the
equilibrium predictions for payoff-maximizing players. Proposers often make
gener-ous offers and realize less power than predicted, and observed behavior is relatively
invariant to institutional conditions (Fréchette et al., 2005a,b; Fréchette et al., 2012;
Montero et al., 2008; Drouvelis et al., 2010). Observed equity seemingly resembles
ob-servations in ultimatum bargaining, but it cannot be explained by FS inequity aversion
(Montero, 2007). Breitmoser and Tan (2013) obtain a similar result for demand
observations.
Our main hypothesis is that the reason for the equity of outcomes is the same in
all three of these bargaining games—ultimatum bargaining, random-proposer majority
bargaining, and demand bargaining—and that once the preference structure in these games is understood, it may allow us to predict behavior similarly well in the
afore-mentioned dictator games of Engelmann and Strobel where FS inequity aversion fails
to predict behavior. Our second hypothesis is that the utility discontinuity in reference
dependent altruism helps to model this preference structure. The utility jump at the
ref-erence point implies that players are willing to take additional risks to reach it, and in
this contexts it implies that voters reject inequitable proposals, gambling on the chance
that they are recognized as proposers in the next round—as proposers, they will reach
their reference point.
We distinguish two games, and in each of them, three players,N={1,2,3}, have
to divide e24 by majority decision. The smallest currency unit is .01 Euro. Using
C=24, the set of feasible allocations between the three players is
X=
x∈RN |x≥0, ∑i∈Nxi≤C, ∀i∈N: 100xi∈N0 . (6)
The first game that we implement is the random-proposer game with a continuation
probability of .95 after each round without agreement.
Game 1 (PB95). In each round, one player is recognized as proposer by a uniform draw from N. This player chooses x∈X, and the other players vote on x. If one of them accepts, then the players’ payoffs are x. Otherwise, the payoffs are 0 with probability .05 and a new round begins with probability .95.
PB95is outcome equivalent to the random-proposer game with infinite time
hori-zon and discount factor δ =0.95 if the players are risk neutral. This game has a
plethora of subgame-perfect equilibria (Baron and Ferejohn, 1989), akin to folk
theo-rems in repeated games, but analyses generally focus on equilibria in stationary
strate-gies. Stationary strategies are independent of proposals and votes in previous rounds,
and as such they are the least complex equilibrium strategies (Baron and Kalai, 1993)
and imply uniqueness of ex-ante equilibrium payoffs (Eraslan, 2002).5 Ex-ante, prior to proposer recognition, every player expects a payoff of C/3=8 under stationary
5Building on the assumption of stationarity, the random-proposer model has been extended in a
subgame perfection. Thus, payoff-maximizing voters accept any proposal that allo-cates them at least their “continuation payoff”δ8=7.60, which in turn are the costs
of buying a vote. Payoff-maximizing proposers buy one vote and allocate the rest
16.40=24−7.60 to themselves. Along the equilibrium path, proposals thus have the
structure(16.4,7.6,0)and are accepted immediately.
The second game implemented in our experiment is a random proposer game
iden-tical toPB95 with the difference that it ends after one round, and if the first proposal
is not accepted then players are paid their continuation payoffs from PB95. Hence,
“PB00” is strategically equivalent toPB95for payoff-maximizing players, but
predic-tions differ if players have social preferences.
Game 2(PB00). A player is recognized as proposer by a uniform draw fromN. This player choosesx∈X, and the other players vote onx. If one of them accepts, then the players’ payoffs arex. Otherwise, the payoffs are 7.60 per player.
If players maximize expected payoffs, the set of SPEs ofPB00corresponds with
the set of SSPEs of PB95 in the sense that equal proposal and voting decisions are
made. The ex-post payoff profile has the structure(16.4,7.6,0)in both games.
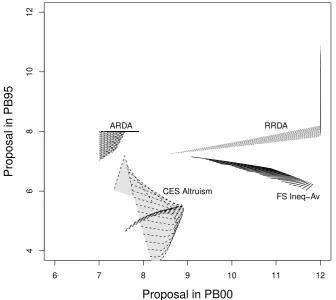
Predictions forPB95andPB00diverge in opposite directions if players have
so-cial preferences other than RDA, and this allows us to examine the shape of their
preferences. Figure 4 illustrates the ranges of equilibrium proposals compatible with the four families of social preferences. Indeed, the predicted ranges of equilibrium
proposals hardly overlap, which yields the qualitative separation of utility theories that
we exploit with our analysis.
To understand the divergence of predictions, letU :R3+ →R denote the utility
function and assume that instead of beingUi(x) =xi, it is the FS utility function defined
in Eq. (4). If guilt is limited as usual, β<1/2, all proposers pay the value ythat is
necessary to buy one vote and keep the rest to themselves. As a result, equilibrium
proposals have the structure (24−y,y,0), where y is the transfer necessary to buy
a vote. In equilibrium, the utility of the recipient of this transfer equates with his
continuation utility, and assuming stationarity, and the equilibrium transferyinPB95
is therefore characterized by this simple condition.6
PB95: U(y,C−y,0) = δ
3 U(C−y,y,0) +U(y,C−y,0) +U(0,C−y,y)
+ (1−δ)U(0,0,0) (7)
In contrast, the equilibrium transfer inPB00satisfies the condition
PB00: U(y,C−y,0) =U(δC/3,δC/3,δC/3). (8)
These conditions have the same solution if players maximize payoffs, Ui(x) = xi. If the utility is piecewise linear (as in FS inequity aversion) or non-linear (CES
altruism), then the continuation utility in PB95(the right-hand side of Eq. (7)) differs
fromU(δC/3,δC/3,δC/3)even fory=δC/3. Due to the weak concavity ofUFS, it
is less thanU(δC/3,δC/3,δC/3), and hence, the costs of vote buying are smaller in
PB95than inPB00. Solving foryunder FS inequity aversion yields
y95=C·
3α+δ(1−2β−2α)
3+6α−3β−2δ·(α+β) y00=C·
δ/3+α 1+2α−β,
and thusy95<7.60=δC/3 andy00>7.60=δC/3 if 0<β<αwithβ<1/2. That
is, inequity averse players make less equitable transfers than payoff maximizers in
PB95 and more equitable transfers than payoff maximizers in PB00 (the former has
first been observed by Montero, 2007). This applies similarly for all utility functions
U that are weakly concave in the payoff profile, such as CES preferences, but the pre-dictions of FS inequity aversion and CES altruism differ quantitatively, as shown in
Figure 4. The equilibrium transfer in PB95 drops stronger if CES altruism increases
than if FS inequity aversion increases, while the transfer increases stronger in PB00
for FS inequity aversion than for CES altruism. Assuming that proposers waste no part
of the surplus, they do not “misbehave” as defined in CR reciprocity. Thus, negative
reciprocity is irrelevant, rendering the specifications of FS inequity aversion and CR
reciprocity equivalent. FS inequity aversion and CR reciprocity thus make the
equiva-6A standard continuity argument implies that at least one voter accepts in case of indifference.
Figure 4: The ranges of proposals that are compatible with the four utility theories
6 7 8 9 10 11 12
4
6
8
10
12
Proposal in PB00
Proposal in PB95
FS Ineq−Av CES Altruism
RRDA ARDA
Note: Displayed are the predicted proposals to the player whose vote is bought (forα≥0.1, as the theories are indistinguishable from egoism otherwise). Specifically, CES altruism Eq. (3) forα∈[.1, .5]
andβ∈[.1, .9], FS inequity aversion or CR reciprocity Eq. (4) forα∈[.1,1]andβ∈[.1, .33], absolute reference dependence Eq. (1) for forα∈[.16, .66]andβ∈[−.33, .33], and relative reference dependence Eq. (2) forα∈[−.33,−.1]andβ∈[−.88,−.44]. Note that proposal range compatible with ARDA degenerates to a point in stationary SPEs of PB95 for allα−β>1/4.
lentpredictions.
Intuitively, however, one may expect similarly equitable transfers in both games,
PB00 and PB95, and indeed equitable transfers in a random-proposer game similar
to PB95 have been observed by Fréchette et al. (2005a,b). Reference dependent
al-truism predicts equitable transfers in both games for both reference points. Due to
the utility jump at the reference point, the “bonus”, the utility function is not weakly
concave and the above argument no longer applies. Since the players are above their
reference points at least when they are recognized as proposers, the bonus raises their
chance of being recognized as proposer in the next round. If players use the “relative” reference points provided by their opponents payoffs, for example, the voters require a
comparably large compensation as long as the proposer gets more than them. Solving
the equilibrium conditions (7) and (8) foryyields in case of RRDA
y95=
(3α+ (1−2α)δ)C
(β−α)δ+3(α+1) y00=
(3α+δ(1−2β))C
3(α+1) . (9)
Both y00 and y95 are greater thanδC/3 for all α>β (assuming β>−1). This
pre-diction differs qualitatively from the prepre-dictions of weakly concave utility functions
and is compatible with the observations of Fréchette et al. (2005a,b). Further, as the
emotional bonusα−βof reaching the reference point increases, the vote buying costs
yincrease further, up toy=12 inPB00.
Finally, if players have the absolute reference point equal to their ex-ante payoff
expectation, they accept (under most parameter constellations) any proposal that
al-locates them at least their ex-ante expectation. If α−β is not too small, they would
reject any other proposal and the equilibrium proposal is y=8 inPB95. The result is
similar in PB00, where the equilibrium proposal can be shown to satisfy 7.6<y<8
for a wide range of parameters, e.g. for all δ<1 and β<0. Thus, ARDA predicts proposals aroundy=8 in both games.
Experimental logistics
The experiment was conducted in the experimental economics laboratory at the Europa
Universität Viadrina, Frankfurt (Oder), Germany. The experiment was, apart from the
experimental instructions and control questionnaire, fully computerized (using z-Tree,
see Fischbacher, 2007). Subjects were students from various faculties of the univer-sity. An announcement for this experiment was sent to recipients on an email database
of potential subjects. Those who responded to the email were recruited accordingly.
We conducted a total of nine sessions, four sessions of thePB00and five sessions of
PB95. Each session was partitioned into two sub-sessions, to each six subjects were
randomly assigned. Subjects never interacted with those from other sub-sessions. We
partitioned the sessions to increase the number of independent observations, and ran
them simultaneously to increase the sense of anonymity. Each session contained 12
only once.
Each session comprised 10 repetitions (“stages”) of the game, each comprising a
number of “rounds.” In each stage, subjects were randomly re-matched into groups
of three, so as to implement the one-shot context. Subjects were also randomly reas-signed their roles at the beginning of each round. Repetition of tasks allows for
ex-perience, while random re-matching and anonymity eliminate reputation effects. This
between-subject design reduces the potential carryover effects from playing one game
to another. The subjects’ tasks and information during games matched precisely with
the games’ definitions provided above. After each stage, all subjects were informed of
their earnings in that stage. Neutral language was used throughout the experiment (e.g.
“A-participant” and “B-participant” instead of proposer and responder). The
instruc-tions used inPB95sessions are provided as supplementary material.
At the beginning of the experiment, subjects were randomly assigned computer
terminals. They started by reading the experimental instructions, provided on printed
sheets, followed by answering a short control questionnaire that allowed us to check
their understanding. Subjects in doubt were verbally advised by the experimental
as-sistants before being allowed to begin. Each computer terminal was partitioned, so that subjects were unable to communicate via audio or visual signals, or to look at other
computer screens. Decisions were thus made in privacy. At the end of the experiment,
subjects were informed of their payments, and asked to privately choose a code-name
and password. This was used to anonymously collect their payments from a third party
one week after the experiment. Each subject was given ae4 participation fee and the
earnings from one randomly chosen stage. The marginal incentives could therefore
range from e0 toe24 per subject. The average payout was above e11 per subject
for, on average, less than 1 hour per session.7
4
The results
In this section, we analyze the qualitative compatibility of the experimental
obser-vations with the predictions of the different utility theories. Proposals are denoted
as (xp,xh,xl), where xp is the proposer’s payoff, xh :=max{x1,x2} is the higher of
7The monetary incentives provided in our experiment are substantial by local standards. Our mean
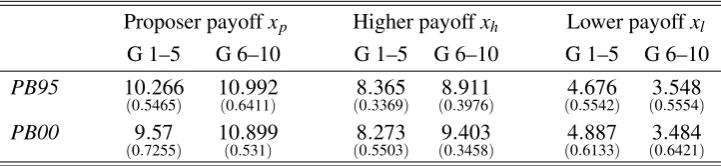
Table 2: Means (and standard errors) of the proposals for first and second half of experiment
Proposer payoffxp Higher payoffxh Lower payoffxl
G 1–5 G 6–10 G 1–5 G 6–10 G 1–5 G 6–10
PB95 10.266
(0.5465) 10(0..6411992) (80..3369365) (80..3976911) (40..5542676) (30..5554548)
PB00 9.57
(0.7255) 10(0..531899) (80..5503273) (90..3458403) (40..6133887) (30..6421484)
Note: The standard errors are computed using the sub-session means as independent
ob-servations. The values for “G 1–5” refer to the first five games per session, those for “G 6–10” refer to the last five games per session.
the voters’ payoffs, and xl=min{x1,x2}is the lower of the voters’ payoffs. Table 2
shows that average payoffs to both co-players are higher than the (16.4,7.6,0)
pre-dicted by egoism. The average values observed are (10.623,8.601,4.155) for PB95
and(10.234,8.838,4.186)forPB00. Further, Mann-WhitneyU tests taking the
aver-age of each session as an independent observation show that each proposal component
xp, xh, and xl is not significantly different across PB95 andPB00 (p=0.633 for xp, p=0.696 forxh, p=0.965 forxl). This holds robustly in both the first and the second
half of the experiment. Recall that the non-RDA models predictxh<7.6 inPB95and
xh>7.6 inPB00. The experimental observations are therefore incompatible with CES
altruism, and FS inequity aversion or CR reciprocity. They are compatible with RDA,
which predicts that outcomes are equitable and similarly so inPB95andPB00.8 Figure 5 plots the distributions of proposals inPB95andPB00from various
com-plementary perspectives. Figure 5a plots the frequencies of proposals (xh,xl). Figure
5b plots the distributions of proposals made to each of the two voters. These
distri-butions are plotted in relation to the empirical continuation payoffs, which are 7.36 in
PB95and 7.60 inPB00. The plots include the proposals that were not accepted, which
are located mostly in the lower-left quadrant. The vast majority of proposals is in the other three quadrants, where at least one voter’s continuation payoff is met. These
pro-posals had mostly been accepted; Figure 5c shows that offering at least one opponent a
payoff of 8 ensures acceptance with high probability. We can see in Figure 5b that the
proposals in both treatments are located along a perturbed concave frontier stretching
8Regression analyses of player-specific payoffs controlling for game (for both treatments) and round
(forPB95) confirm the above, and also show that stationarity and truncation consistency are not violated.
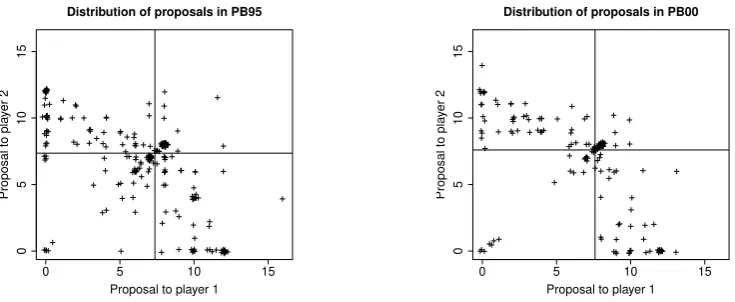
Figure 5: The distribution of proposals and the voting decisions
(a) Left:PB95, Right:PB00
Lower Payoff
0 2 4 6 8 10
Higher P ayoff 0 2 4 6 810 Counts 0 5 10 15 20 25 30 Lower Payoff
0 2 4 6 8
Higher P ayoff 0 2 4 6 810 Counts 0 5 10 15 20 25
(b) Proposals in relation to the (empirical) continuation payoffs inPB00andPB95
0 5 10 15
0
5
10
15
Distribution of proposals in PB95
Proposal to player 1
Proposal to pla
y
er 2
0 5 10 15
0
5
10
15
Distribution of proposals in PB00
Proposal to player 1
Proposal to pla
y
er 2
Note: The empirical estimate of expected payoff inPB00is 7.88, and the estimated discounted payoff
(continuation payoff) inPB95is 7.36. The points are slightly perturbed to visualize their clustering.
(c) Voting functions (relative acceptance frequencies)
0 5 10 15
0.0 0.2 0.4 0.6 0.8 1.0
Proposed payoff to respective player in PB95
Relativ
e frequency of accept
0 2 4 6 8 10 12 14
0.0 0.2 0.4 0.6 0.8 1.0
Proposed payoff to respective player in PB00
Relativ
from around(10,0)through(8,8)to(0,10). The distributions have two mass points. In PB95, around 30 proposals are at(12,0) or (0,12), and another 30 proposals are
at(8,8)(see Figure 5a). In PB00, the mass point at(12,0)is less populated. Further
observations are clustered near these mass points: there is a cluster of proposals
al-locating 9–12 to one opponent and zero or negligible amounts to the other one and a
second area to the southwest of(8,8)(see Figure 5b).
ARDA is compatible with the observed treatment-invariance and average
propos-als, in particular of the form(16,8,0), which are reflected as(8,0)and(0,8)in Figure
5b. Taking noise into account, ARDA is thus compatible with the observations in the
cluster around (10,0)in Figure 5b. We ascertain this econometrically in the next
sec-tion. ARDA is incompatible with the observations around (8,8), suggesting subject
heterogeneity. Most observations near (8,8) in Figure 5b are to its southwest, and
hardly any are to its northeast. CES altruism cannot explain the cluster pattern: as-suming CES altruism withα=1/3 ignores such asymmetry altogether, i.e. deviating
from the proposal(8,8,8)involves equal utility losses in either direction, be it toward
(9,8,7) or (7,8,9). Similarly, FS inequity aversion involves continuous utility, and thus, while being asymmetric with respect to the possible deviations, it does not predict
such a sharp directional effect in the neighborhood of(8,8). In contrast, discontinuous
utilities of RDA predict sharp effects due to jump discontinuities at reference points.
With ARDA, proposers will unlikely proposexp<8 for themselves, as this would land
on the wrong side of their reference point of 8 and thus yield a substantial utility drop.
Hence, ARDA proposals would mostly be below the counter-diagonal through (8,8), but not necessarily to its southwest. RRDA, finally, predicts that proposers unlikely
propose xp<max{x1,x2}, as they are altruistic only as long as they get at least as
much as either opponent, which explains the observations to the southwest of(8,8).
Thus, on a qualitative basis, ARDA seems to be most compatible with the clus-ters around(10,0)and(0,10), and RRDA is most compatible with the clusters around
(8,8). In either case, the voters theoretically accept proposals if y≈8, which is also empirically satisfied (Figure 5c). In turn, the observations are qualitatively
5
Estimation of the utility functions
In order to verify whether RDA also fits quantitatively, we estimate the utility
func-tions using a structural model of majority bargaining. The structural model is that of
quantal response equilibrium (QRE, McKelvey and Palfrey, 1995), which relaxes the
assumption of “best responses” toward “better responses” (better responses are chosen
with higher probability). Specifically, we analyze PB00-choices through agent logit
equilibrium (McKelvey and Palfrey, 1998) andPB95-choices through stationary logit
equilibrium (Breitmoser et al., 2010), which we jointly abbreviate as SLE. Due to the
large strategy sets,9we will also consider a generalization called stationary nested logit equilibrium (SNLE). This allows us to control for the possibility that subjects choose
proposals in multiple decision steps. The clustering displayed in Figure 5b suggests
that this is a possibility, and in particular it suggests that subjects first determine how
many opponents and whom they pay their continuation payoffs (to buy the vote) before
they choose the actual payoff profile. Hierarchical choice can be modeled using nested
logit responses as defined in McFadden (1978, 1984), and in order to be on the save
side, we control for this possibility. The main results do not depend on the adopted
choice model, however, as RDA fits best either way. The technical details of nested
logit in stationary equilibria are provided in the supplementary material.
In the previous section, we interpreted the observations to be generated by a
sub-ject pool with two discrete components (ARDA and RRDA). We model subsub-ject
het-erogeneity of this discrete nature using finite mixture models (McLachlan and Peel,
2000), following the literature inspired by Stahl and Wilson (1995). This allows us to simultaneously estimate number, weights, as well as utility and choice parameters of
subject types. To define the likelihood function, letK denote the set of components in
the population with weights νk and behavioral parameter tuplepk for allk∈K. Thus
withP= (pk)k∈Kas the behavioral parameter profile, and withO= (os,t)as the set of
observations for all subjectss∈Sand periodst∈T, the log-likelihood is
LL(P|O) =
∑
s∈S
ln
∑
k∈K
νkL(s,k) with L(s,k) =
∏
t∈Tσ os,t|pk, (10)
usingσ os,t|pkas the probability of actionos,t according to the QRE defined by the
parameter profile pk. The log-likelihood is maximized jointly over all parameters to obtain consistent and efficient estimates (see e.g. Amemiya, 1978, and Arcidiacono and
Jones, 2003, for further discussion), and to allow us to extract standard errors from the
information matrix.10 Model evaluation will be based on nested/non-nested likelihood-ratio tests following Vuong (1989) and on entropy-based information criteria. Such
cri-teria extend Bayes Information CriterionBIC=−LL+d/2·log(O)(Schwarz, 1978,
with number of parametersdand number of observationsO) by including the entropy
of posterior component membership to penalize mixture models with superfluous com-ponents. This resolves the issue that BIC overestimates the number of components of
finite mixture models (Biernacki et al., 1999, 2000). The entropy-based criterion used
in our analysis is the integrated classification likelihood
ICL-BIC=−LL+d/2·lnO+En(τˆ)
with En(τˆ) =−
∑
s∈Sk∑
∈Kˆ
τskln ˆτsk with τˆsk= νkL(s,k)
∑k′∈Kνk′L(s,k′). (11)
Results
Table 3 presents the results. The main result, the parameter estimates of the best-fitting
models are provided in Table 3a. We find that the subject pool consists of at least two
components, where 55% of the subjects have RRDA preferences and 45% of them
have ARDA preferences. The rather balanced distribution of RRDA and ARDA types
corresponds with the previous observations that the two cluster areas contain similar
numbers of observations. The RRDA component can be further split down into a sub-component with RRDA preferences (48.1%) and a sub-sub-component with FS inequity
aversion containing 7.2% of the subjects. This confirms the above qualitative
observa-10We use the derivative-free NEWUOA algorithm (Powell, 2008) for the initial approach toward the
tion that the observations are compatible with reference dependent altruism and largely incompatible with CES altruism or FS inequity aversion. The estimated RRDA and
ARDA parameters also correspond with the observations made in the previous section.
The RRDA component has β≈ −1, which means that RRDA players are
approxi-mately welfare-concerned as long as they get at least as much as their opponents. This
yields the cluster around (8,8,8). The ARDA player have a large difference α−β,
which yields the treatment invariance as discussed above.
The remaining tables contain the results of our robustness checks. All parameter
estimates are provided as supplementary material. We perform three sets of robustness
tests, as summarized in the Tables 3b, 3c, and 3d, respectively. First, we verify whether
the main results would change if we use logit instead of nested logit. Table 3b shows
that the best-fitting stationary logit equilibria (SLEs) are based on ARDA and RRDA,
as in the SNLE analysis, while the goodness-of-fit drops by about 500 points on the log-likelihood scale (for all utility models). Thus, acknowledging the possibility of
hierarchical choice as in SNLE does not change qualitative results on the identified
social motives, but it improves fit enormously. Considering the size of the strategy set,
the clustering of observations, and the fact that options are simply not multinomial in
majority bargaining, the tendency was expected, but the quantitative improvement is
surprisingly large. It implies that the nested logit model where subjects first pick whom
to pay the continuation payoff, which intuitively fits choice in majority bargaining, is
much more likely to yield reliable (i.e. unbiased) estimates of the utility parameters in
our context. Table 3b also informs on the goodness-of-fit of models assuming all com-ponents are either CES, FS, ARDA, or RRDA. These models fit substantially worse (at
least 50 points by ICL-BIC) than the RRDA-ARDA mixture in Table 3a, and that FS
inequity aversion and CES altruism fit substantially worse even with three components
(at least 250 points byICL-BIC).
Secondly, we check whether the RRDA-ARDA mixture indeed fits better than all
other two-component models, even when we allow for mixtures of motives. Table 3c
reports the results. It shows that regardless how the first component is modeled, a
sec-ond component with FS inequity aversion fits better than CES (in terms of ICL-BIC),
RRDA fits significantly better than FS inequity aversion (p< .01 in all cases), and
ARDA and RRDA fit about similarly as second component. Thus, at least one
com-ponent would have to be either RRDA or ARDA. Using either of ARDA and RRDA
Table 3: The estimation results
(a)Estimates for the two best-fitting models
Component Weight λp ρ1 ρ2 λv α β ICL/LL/R2
RRDA 0.552
(−) 5(0..542093) 0(0..145004) 0(0..101001) 0(0..001002) −(00.002.27) −(00..007998)
ARDA 0.448
(0.054) 3(0..332042) 0.(1190) 0.(0880) (00..317002) 0(0..795006) 0.(3340)
3415.11
−3346.74 0.8914
RRDA 0.481
(−) 5(0..653027) 0(0..127001) 0.(0940) (00) −(00..002277) −0(.0996)
ARDA 0.447
(0.055) 4(0..604029) 0.(1480) 0(0..024001) 0(0..328002) (00..732003) 0(.036)
IneqAv 0.072
(0.023) 0(0..894011) 0(0..157006) (00..011003) 0(.0498.01) 0.(0040) 0(0..056001)
3405.07
−3306.89 0.8958
Note: (α,β)are the parameters of the four utility functions, the remaining parameters are the choice
parameters discussed in the Appendix. The standard errors are provided in parentheses. The Cox-Snell Pseudo-R2isR2=1−(L(MBaseline)/L(MFull))2/O, with the “baseline model” being the benchmark that players randomize uniformly in all cases andObeing the number of observations.
(b)Goodness-of-fit (ICL-BIC) of logit (SLE) vs. nested logit (SNLE) Number of components
Utility function SLE×1 SNLE×1 SNLE×2 SNLE×3
CES Altr 4513.13 ≪ 3992.96 ≪ 3890.92 ≪ 3702.54
IneqAv 4570.67 ≪ 3835.85 ≪ 3700.56 ≪ 3666.14
RRDA 4131.97 ≪ 3668.32 ≪ 3469.22 = 3486.81
ARDA 4344.01 ≪ 3621.68 ≪ 3488.86 = 3512.42
Note: CES altruism Eq. (3), inequity aversion Eq. (4), absolute reference dependence Eq. (1), and
relative reference dependence Eq. (2). The parameter estimates are supplementary material.
(c)Goodness-of-fit (ICL-BIC) of mixture models with two differing motives
Second component
First component CES Altr IneqAv RRDA ARDA
CES Altr 3890.93 ≪ 3730.59 ≪ 3591.86 = 3607.17
IneqAv 3730.81 = 3701.2 ≪ 3534.5 = 3524.85
RRDA 3591.48 = 3534.87 ≪ 3469.22 < 3415.11
ARDA 3607.18 < 3524.8 ≪ 3415.11 > 3488.85
(d)Goodness-of-fit (ICL-BIC) of mixture models with three different components
Third component
First two components CES Altr IneqAv RRDA ARDA
CES + IneqAv 3744.59 = 3750.76 ≪ 3513.81 = 3533.84
CES + RRDA 3500.23 = 3513.52 = 3531.01 ≪ 3423.75
Ineq + ARDA 3533.81 = 3517.12 ≪ 3404.32 ≫ 3537
RRDA + ARDA 3423.74 = 3405.07 = 3422.73 = 3437.96
Note: Tables (b)–(d) display theICL-BICcriteria of model fit, Eq. (11), and the results of
and the differences to the alternative combinations are highly substantial in terms of
ICL-BIC (at least 100 points on the log-likelihood scale). Finally, we verify whether
a possible third component (however small) is indeed best modeled by FS inequity
aversion. In total, we estimate 16 three-component models, and Table 3d reports the
results. All mixtures not including both RRDA and ARDA components haveICL-BIC
criteria above 3500 points, which confirms the above results. The best-fitting
three-component model, and indeed the only model that improves upon the pure RRDA+
ARDA mixture in terms ofICL-BIC, identifies a third component of subjects with FS
inequity aversion. The parameter estimates (Table 3a) show that the RRDA component
is split up into two components, into one of RRDA and one of FS inequity aversion. The share of FS subjects is significant in relation to its standard error and in Vuong
likelihood-ratio tests (p< .01), but overall it is small (7.2%). Thus, we confirm the
qualitive result that reference dependent altruism fits majority bargaining behavior.
6
RDA tested out-of-sample
In this section, the validity of reference dependent altruism as a theory of social
prefer-ence is tested by evaluating its predictions in a wide domain of games out-of-sample.
To this purpose, we refer to experimental games of Charness and Rabin (2002, CR02),
Engelmann and Strobel (2004, ES04), and Bolton and Ockenfels (2006, BO06)
specif-ically designed to test social preferences. RDA is compared with self interest and
two other social preference theories which have previously been shown to explain
be-havioral patterns across many games, namely FS inequity aversion, Eq. (4), and CR
reciprocity, Eq. (5).
The “simple distribution experiments” of Engelmann and Strobel (2004) consist
of 11 three-person dictator games of three types: taxation games, envy games, and
rich-poor games. Taxation games were designed to compare the relevance of two
the-ories of inequity aversion, namely ERC (Bolton and Ockenfels, 2000) and FS, while
allowing efficiency concerns and maximin preferences as modeled by Charness and Rabin (2002). Dictators choose between three allocations, one which is predicted by
ERC and another by FS inequity aversion—in half of the games efficiency or maximin
predicts the same as ERC and in the other half efficiency or maximin predicts the same
con-cerns by having dictators choose between inequitable but efficient allocations versus equitable but inefficient allocations, as do “rich-poor games” which additionally are
neutral to maximin preferences.
In the three-person “voting games” of Bolton and Ockenfels (2006), allocations are determined by majority vote. There are two treatments: in the “straight mode”,
sub-jects knew their roles prior to voting, and in the “equal opportunity mode”, one’s actual
role was unknown prior to voting and there was an equal chance of being allocated to
each role. Each player chooses between an equitable allocation(13,13,13)versus an
efficient allocation(19,13,13)in Game I,(27,1,17)in Game II, or(27,9,9)in Game
III. Relative to individual payoffs under the equitable allocation, the efficient allocation
entails personal losses to none, majority, and minority of the players in Games I, II and
III, respectively. Personal losses are larger in Game II than in Game III. Voting games
test if there is a tradeoff between equity and efficiency.
The “simple tests” of Charness and Rabin (2002) consist of 32 games: dictator
games with two or three persons, and sequential-move response games with two or
three persons. In response games, the first mover chooses whether to stop the game
or to let the second mover choose. The second mover’s payoffs are identical across choices in some games, and in others the second mover’s sacrifice helps or hurts the
first mover.11 Response games allow for tests of reciprocity, in addition to tests of distributional and welfare concerns allowed by dictator games.
With each model, we make predictions for each of the games and roles using
available parameter estimates. Here, we refer to models assuming subject
heterogene-ity as “heterogeneous models” and to models assuming homogeneous subject pools
as “homogeneous models”. Besides RDA, which is a heterogeneous model, we also
report predictions based on ARDA or RRDA separately of each other, which thus
are homogeneous models.12 In addition to predictions based on egoism (“Ego”) and FS inequity aversion (“IneqAv”), we also test a heterogeneous model that considers
both types of subjects. This follows Fehr and Schmidt (2010), who postulate that
the subject pool consists of 60% egoists and 40% inequity averse types, which have
11There were two games where the dictator’s payoffs were unknown, and so are not analyzed here.
12These predictions are invariant to the set of parameter estimates chosen from Table 3a, which are
Table 4: Predictions for the Engelmann-Strobel, Bolton-Ockenfels and Charness-Rabin games
Observations Predictions (Probability ofa1)
#Subj a1 a2 a3 Ego ARDA RRDA RecChar CR-Full IneqAv RDA FS-Full RDA-Ego
Predictions for Dictator Games in Engelmann and Strobel (2004)
Tax-F 68 0.84 0.1 0.06 1 1 1 1 1 1 1 1 1
Tax-E 68 0.4 0.24 0.37 0 1 0 0 0 0 0.45 0 0
Tax-Fx 30 0.87 0.07 0.07 1 1 1 1 1 1 1 1 1
Tax-Ex 30 0.4 0.17 0.43 0 1 1 0 0 0 1 0 0.4
Envy-N 30 0.7 0.27 0.03 0 1 1 1 1 0 1 0 0.4
Envy-Nx 30 0.83 0.13 0.03 1 1 1 1 1 0 1 0.6 1
Envy-Ny 30 0.77 0.13 0.1 0 1 1 0 0 0 1 0 0.4
Envy-Nyi 30 0.6 0.17 0.23 0 1 1 1 1 0 1 0 0.4
RPG-R 30 0.27 0.2 0.53 1 1 1 1 1 1 1 1 1
RPG-P 30 0.6 0.07 0.33 0 1 1 1 1 0 1 0 0.4
RPG-Ey 30 0.4 0.23 0.37 0 1 1 0 0 0 1 0 0.4
Predictions for Voting Games in Bolton and Ockenfels (2006) Player 1
Straight Game I 24 0.25 0.75 0 0 0 0 0 0 0 0 0
Straight Game II 24 0.33 0.67 0 0 0 0 0 0 0 0 0
Straight Game III 24 0.21 0.79 0 0 0 0 0 0 0 0 0
Equal Game I 24 0.12 0.88 0 0 0 0 0 0 0 0 0
Equal Game II 24 0.25 0.75 0 0 0 0 0 0 0 0 0
Equal Game III 24 0.17 0.83 0 0 0 0 0 0 0 0 0
Player 2
Straight Game II 24 0.88 0.12 1 0 1 1 1 1 0.55 1 1
Equal Game II 24 0.92 0.08 1 1 1 1 1 1 1 1 1
Player 3
Straight Game II 24 0.38 0.62 0 0 1 0 0 1 0.55 0.4 0.4
Equal Game II 24 0.25 0.75 0 0 1 0 0 1 0.55 0.4 0.4
Players 2 and 3
Straight Game I 24 0.48 0.52 1 0 1 1 0 1 0.55 1 1
Straight Game III 24 0.88 0.12 1 1 1 1 1 1 1 1 1
Equal Game I 24 0.17 0.83 1 0 1 1 0 1 0.55 1 1
Equal Game III 24 0.85 0.15 1 1 1 1 1 1 1 1 1
Predictions for Dictator Games in Charness and Rabin (2002)
DG2-Berk29 26 0.31 0.69 1 0 1 0 0 1 0.55 1 1
DG2-Barc2 48 0.52 0.48 1 1 1 1 1 1 1 1 1
DG2-Berk17 32 0.5 0.5 1 1 1 1 1 1 1 1 1
DG2-Berk23 36 1 0 1 1 1 1 1 0 1 0.6 1
DG2-Barc8 36 0.67 0.33 1 0 1 1 1 1 0.55 1 1
DG2-Berk15 22 0.27 0.73 1 0 0 0 0 0 0 0.6 0.6
DG2-Berk26 32 0.78 0.22 1 1 1 1 1 0 1 0.6 1
DG3-Berk24 24 0.54 0.46 1 1 1 1 1 1 1 1 1
Observations Predictions (Probability ofa1)
#Subj a1 a2 a3 Ego ARDA RRDA RecChar CR-Full IneqAv RDA FS-Full RDA-Ego
Predictions for Player 1 of Response Games in Charness and Rabin (2002)
RG2-Barc7 36 0.47 0.53 0 0 0 0 0 0 0 0 0
RG2-Barc5 36 0.39 0.61 0 0 1 1 1 1 0.55 0.4 0.4
RG2-Berk28 32 0.5 0.5 0 1 1 0 0 0 1 0 0.4
RG2-Berk32 26 0.85 0.15 1 1 0 1 1 0 0.45 0.6 0.6
RG2s-Barc3 42 0.74 0.26 1 0 0 1 1 0 0 0.6 0.6
RG2s-Barc4 42 0.83 0.17 1 1 1 1 1 0 1 0.6 1
RG2s-Berk21 36 0.47 0.53 1 0 0 1 1 0 0 0.6 0.6
RG2s-Barc6 36 0.92 0.08 1 0 1 1 1 1 0.55 1 1
RG2s-Barc9 36 0.69 0.31 1 0 0 0 0 0 0 0.6 0.6
RG2s-Berk25 32 0.62 0.38 1 0 0 0 0 0 0 0.6 0.6
RG2s-Berk19 32 0.56 0.44 1 0 0 0 0 0 0 0.6 0.6
RG2s-Berk14 22 0.68 0.32 1 1 1 1 1 0 1 0.6 1
RG2s-Barc1 44 0.96 0.04 1 0 1 1 1 1 0.55 1 1
RG2s-Berk13 22 0.86 0.14 1 0 1 1 1 1 0.55 1 1
RG2s-Berk18 32 0 1 0 0 0 0 1 0 0 0 0
RG2h-Barc11 35 0.54 0.46 0 1 0 0 0 0 0.45 0 0
RG2h-Berk32 36 0.39 0.61 0 1 0 0 0 0 0.45 0 0
RG2h-Berk27 32 0.41 0.59 0 0 0 1 1 1 0 0.4 0
RG2h-Berk31 26 0.73 0.27 0 1 1 1 1 1 1 0.4 0.4
RG2h-Berk30 26 0.77 0.23 0 1 1 1 1 0 1 0 0.4
RG3-Berk16 15 0.93 0.07 0 1 1 1 1 1 1 0.4 0.4
RG3-Berk20 21 0.95 0.05 0 1 1 1 1 1 1 0.4 0.4
Predictions for Player 2 of Response Games in Charness and Rabin (2002)
RG2-Barc7 36 0.06 0.94 1 0 1 0.5 0.5 1 0.55 1 1
RG2-Barc5 36 0.33 0.67 1 0 1 0 0 1 0.55 1 1
RG2-Berk28 32 0.34 0.66 0 0 0 0 0 0 0 0 0
RG2-Berk32 26 0.35 0.65 0 0 0 0 0 0 0 0 0
RG2s-Barc3 42 0.62 0.38 1 0 1 1 1 1 0.55 1 1
RG2s-Barc4 42 0.62 0.38 1 1 1 1 1 1 1 1 1
RG2s-Berk21 36 0.61 0.39 1 0 1 1 1 1 0.55 1 1
RG2s-Barc6 36 0.75 0.25 1 0 1 0 0 1 0.55 1 1
RG2s-Barc9 36 0.94 0.06 1 1 1 0 0 1 1 1 1
RG2s-Berk25 32 0.81 0.19 1 1 1 0 0 1 1 1 1
RG2s-Berk19 32 0.22 0.78 1 0 0 0 0 0 0 0.6 0.6
RG2s-Berk14 22 0.45 0.55 1 1 1 1 1 0 1 0.6 1
RG2s-Barc1 44 0.93 0.07 1 0 1 0 0 1 0.55 1 1
RG2s-Berk13 22 0.82 0.18 1 0 1 0 0 1 0.55 1 1
RG2s-Berk18 32 0.44 0.56 1 1 1 1 1 0 1 0.6 1
RG2h-Barc11 35 0.89 0.11 1 1 1 1 1 1 1 1 1
RG2h-Berk32 36 0.97 0.03 1 1 1 1 1 1 1 1 1
RG2h-Berk27 32 0.91 0.09 1 1 1 1 1 0 1 0.6 1
RG2h-Berk31 26 0.88 0.12 1 1 1 1 1 0 1 0.6 1
RG2h-Berk30 26 0.88 0.12 1 1 1 1 1 0 1 0.6 1
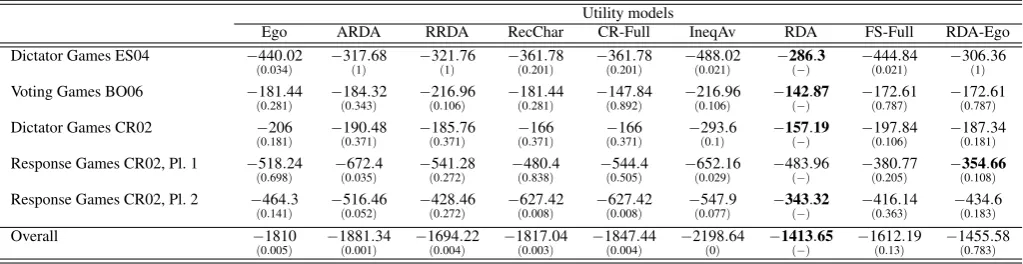
Table 5: Out-of-sample fit of social preference models models (negative Quadratic scores, i.e. more is better), with p-values of significance in relation to RDA
Utility models
Ego ARDA RRDA RecChar CR-Full IneqAv RDA FS-Full RDA-Ego
Dictator Games ES04 −440.02
(0.034) −317(1).68 −321(1).76 −(3610.201.78) −(3610.201.78) −(4880.021.02) −286(−).3 −(4440.021.84) −306(1).36
Voting Games BO06 −181.44
(0.281) −(1840.343.32) −(2160.106.96) −(1810.281.44) −(1470.892.84) −(2160.106.96) −142(−).87 −(1720.787.61) −(1720.787.61)
Dictator Games CR02 −206
(0.181) −(1900.371.48) −(1850.371.76) −(0.166371) −(0.166371) −293(0.1).6 −157(−).19 −(1970.106.84) −(1870.181.34)
Response Games CR02, Pl. 1 −518.24
(0.698) −(0672.035.)4 −(5410.272.28) −(0480.838.)4 −(0544.505.)4 −(6520.029.16) −483(−).96 −(3800.205.77) −(3540.108.66)
Response Games CR02, Pl. 2 −464.3
(0.141) −(5160.052.46) −(4280.272.46) −(6270.008.42) −(6270.008.42) −(0547.077.)9 −
343.32
(−) −(4160.363.14) −(0434.183.)6
Overall −1810
(0.005) −1881(0.001.)34 −1694(0.004.)22 −1817(0.003.)04 −1847(0.004.)44 −2198(0).64 −1413(−).65 −1612(0.13).19 −1455(0.783.)58
Note:Data sets are abbreviated as above: CR02 is Charness and Rabin (2002), ES04 is Engelmann and Strobel (2004), BO06 is Bolton and Ockenfels (2006). Below the Quadratic Scores, thep-values of tests of the NullScore (Model)=Score (RDA)are provided, derived from two-sided, matched pairs Wilcoxon tests using the individual game scores as independent observations. Model abbreviations are defined prior to Eq. (12). “RDA-Ego” is a mixture of 60% Egoists and 40% RRDA, as a benchmark for the respective FS mixture.
α=2/(n−1)and β=0.6/(n−1)in Eq. (4). We refer to this heterogeneous model as “FS-Full”. In Charness and Rabin (2002, Table VI), one of the best-fitting models
and its respective parameters estimated is their full reciprocity model (“CR-Full”) with ρ=.424,σ=.023,θ=−.111 in Eq. (5). Its predictions are partially in-sample and pose a rather tough challenge for RDA’s out-of-sample predictions. We also test
predic-tions for CR02’s reciprocal charity “RecChar” model, which neglects inequity aversion
(by settingσ=0). CR02’s estimates for RecChar areρ=.425,σ=0,θ=−.089, and
its predictions are identical to CR-Full’s in many games.
For all utility functions and all games, we derive the unique predictions
with-out noise and evaluate their adequacy using the quadratic scoring rule (Selten, 1998;
Gneiting and Raferty, 2007).13 With G as the set of games considered here, A(g)as the action set in game g∈G, n(a,g)as the number of subjects that chose aing, and
p(a,g)as the predicted probability ofaing, the prediction scores are
Quadratic Score: SQ=−
∑
g∈Ga∈
∑
A(g)b∈∑
A(g)n(a,g)· Ia=b−p(b,g)
2
. (12)
Table 5 contains the overall scores, the scores for subsets of games, and in
paren-theses p-values of two-sided Wilcoxon matched pair tests of differences to RDA (if
p< .05, then the respective model fits significantly worse than RDA). Table 4 contains
the predictions of all models for all games. The main results are that the
heteroge-13We evaluate the predictions without noise, as noise parameters such as those estimated above or by
neous RDA model fits significantly better than all homogeneous models, and overall also better than the heterogeneous Fehr-Schmidt model FS-Full. The latter is not quite
significant, but RDA fits better than FS-Full in four of the five classes of games, which
we discuss in more detail shortly. The best-fitting homogeneous model is RRDA, and
in fact it is the only model that improves upon Ego overall. As a homogeneous model,
ARDA does not fit well, but this is unsurprising, as ARDA captures the behavior of a
minority in our experiment, and thus it is not expected to extrapolate to the population
as a whole. It complements RRDA well, however, as RDA fits significantly better than
RRDA overall (p=.026).
For the dictator games of CR02 and ES04, ARDA and RRDA fit about
simi-larly, and both of these models fit about as well as the Charness-Rabin model CR-Full.
ARDA and RRDA fit slightly better in the Engelmann-Strobel games, CR-Full fits
slightly better in the Charness-Rabin games. In both cases, inequity aversion and the heterogeneous FS-Full model fit poorly, i.e. these experiments indeed identify the
lim-its of FS inequity aversion. Interestingly, the simple switch from the continuous FS
utility function to the discontinuous RRDA utilities eliminates exactly these issues,
and correctly predicts conditional welfare concerns as hypothesized above. This
con-firms that the condition for welfare concerns depends on the relation of one’s payoff to
the reference point.
For BO06’s voting games, RDA has the highest score. In many cases, RDA makes
the same prediction as all the other models, and these predictions are qualitatively in
line with behavior. This explains why the overall differences between model scores are
statistically insignificant for voting games. In the remaining cases where RDA’s
predic-tions are different from those of other models, RDA’s predicpredic-tions are non-degenerate
and the corresponding observations are heterogeneous. Thus, RDA does well in
cap-turing the equity-efficiency tradeoff BO06 speak of, e.g. for Game I players 2 and 3 as well as Game II player 3.
Finally, we turn to CR02’s response games. Table 3a shows that RRDA
accu-rately predicts the reciprocal choices of player 2, while it does poorly in predicting the strategic reciprocity of player 1. In the latter case, egoism does fairly well, and the
only homogeneous model improving upon egoism in predicting strategic reciprocity
is the reciprocal charity model of Charness and Rabin (Blanco et al., 2011, discuss
the difficulties in predicting strategic reciprocity in more detail). Surprisingly, the