D S Sharma, R Sangal and E Sherly. Proc. of the 12th Intl. Conference on Natural Language Processing, pages 112–117, Trivandrum, India. December 2015. c2015 NLP Association of India (NLPAI)
A Database of Infant Cry Sounds
to Study the Likely Cause of Cry
Shivam Sharma1, Shubham Asthana2, V. K. Mittal3
1,2,3Indian Institute of Information Technology, Chittoor District, India 1[email protected],2[email protected] and3[email protected]
Abstract
Infant cry is a mode of communication, for interacting and drawing attention. The in-fants cry due to physiological, emotional or some ailment reasons. Cry involves high pitch changes in the signal. In this paper we describe an ‘Infant Cry Sounds Database’ (ICSD), collected especially for the study of likely cause of an infant’s cry. The database consists of infant cry sounds due to six causes: pain, discomfort, emo-tional need, ailment, environmental fac-tors and hunger/thirst. The ground truth cause of cry is established with the help of two medical experts and parents of the infants. Preliminary analysis is carried out using the sound production features, the instantaneous fundamental frequency and frame energy derived from the cry acoustic signal, using auto correlation and linear prediction (LP) analysis. Spectro-grams give the base reference. The in-fant cry sounds due topainanddiscomfort
are distinguished. The database should be helpful towards automated diagnosis of the causes of infant cry.
1 Introduction
Infant cry is an acoustic manipulation, that sists of different forms of vocalization, con-strictive silence, coughing, choking and breaks (Neustein, 2010). Its analysis provides the infor-mation regarding health, disease, gender and emo-tions. In this way, infants communicate with their environment about what they feel. Infant cry falls in the most sensitive range of human auditory sen-sation (Jr et al., 2005).
First cry of an infant gives significant informa-tion to determine the APGAR count, a tool for the categorization of the new born baby as healthy, un-healthy or weak (Neustein, 2010). The time vary-ing characteristics, limb movement and vocaliza-tion give insight to the transivocaliza-tional characteristics. Studies of physiological variables such as facial expression, muscular tonus, sleep and suction abil-ities were conducted to analyse the needs of an in-fant (Skogsdal et al., 1997). The study of inin-fant cry has gained significance over the years, because of diverse applications.
Fundamental frequencyand the first three for-mants of cry signals were studied earlier (Baeck and Souza, 2001); (Daga and Panditrao, 2011). Attempts were made to classify the cry signals on the basis of pain, sadness, fear and hunger etc. (Abdulaziz and Ahmad, 2010); (Mima and Arakawa, 2006). The pitch characteristics, aimed to classify the cry signals into categories: urgent, arousing, sick, distressing etc. (Zeskind and Mar-shall, 1988). A pitch detection algorithm was used to compute the instantaneous fundamental frequency (F0)(Neustein, 2010). First three for-mants along withF0 were used for the cry analy-sis (Hidayati et al., 2009). Cepstrum analyanaly-sis was carried out for determining the F0 and first three formants for cry (Chandralingam et al., 2012). A time domain cross-correlation pitch determination method gave details of every pitch epoch (Petroni et al., 1994).
mean, standard deviation and peak of the funda-mental frequency (Zeskind and Marshall, 1988). In another study, segment density, segment length and pause length were used to examine the rela-tionship between these parameters and gender of the baby (Varallyay, 2006). The frame-wise com-parison of the meanF0gave insight into the analy-sis of cries of infants with different heart disorders (Chandralingam et al., 2012). This study also cor-related disphonation to musclepainordiscomfort.
A different method to extractF0 was proposed (Petroni et al., 1994). TheF0for cry was observed to be between 200-500 Hz, with averageF0 320 Hz for male infant and 400 Hz for female infant (Daga and Panditrao, 2011). Typical characteris-tics were observed in the shape of power spectra of cry signals for hunger, sleepiness and discomfort (Mima and Arakawa, 2006). Cries of infants were divided intonormal and disorderslike Tetralogy of Fallot (TOF), Ventricular Septal Defect (VSD), Atrial Septal Defect (ASD), and Patent Ductus Ar-teriosus (PDA) (Chandralingam et al., 2012). Spe-cific segments of cry signals showed similarity amongst infants with hearing disorders and nor-mal infants. However, detailed study of an infant cry, in conjunction with likely causes as per expert medical opinion, is still required to be carried out in detail.
In this paper, an ‘Infant Cry Sounds Database’
(IIIT-S ICSD)is described in detail. The database consists of different categories of cries due to dif-ferent reasons. The data of infant cry signals was recorded in a doctors cabin, where the infants were brought-in for routine check-up, vaccination trips or due to any ailment. Spectrographic study was carried for each case. Changes in theF0 contour and harmonics were observed for cry causes. An effort is made for the classification of cry signals, based upon the spectrographic analysis and using signal processing methods. The analysed causes of each cry are compared with the ground truth determined as per doctors or parents.
[image:2.612.313.536.59.180.2]This paper is organized as follows. Section II discusses details of the IIIT-S ICSD. Section III discusses signal processing methods for analysing the infant cry signals. Features of the Infant cry signals are discussed in Section IV. In Section V, the observations are made from the results of in-fant cry analysis. The paper is summarised in Sec-tion VI, along with the scope of future work.
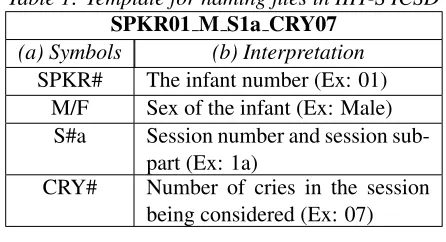
Table 1: Template for naming files in IIIT-S ICSD SPKR01 M S1a CRY07
(a) Symbols (b) Interpretation
SPKR# The infant number (Ex: 01) M/F Sex of the infant (Ex: Male)
S#a Session number and session sub-part (Ex: 1a)
CRY# Number of cries in the session being considered (Ex: 07)
2 The IIIT-S ICSD Cry
2.1 Data Collection
The data was collected from Pranaam hospital, Madinaguda, Hyderabad, under the supervision of Dr. Manish Gour (MBBS, DCH) and Dr Nizam (MBBS). The age group of infants was restricted between 3 months and 2 years. The cry signals of infants were collected during the regular check-up visits, the vaccination trips or any emotional need of attention. People present in the room were requested to maintain silence, so as to record the cry sample. Also the parents were advised not to comfort the baby for brief duration, to ensure the uninterrupted data collection. Along with data, the personal details noted include: infant name, parent name, parent profession, sex and age of the infant and predictive causes of the cry.
For the recording purpose, Roland R-09 Wave/MP3 recorder was used and was placed at 10-20 cm from the infant's mouth. Precautions were taken to avoid any unwanted noise or cross-talk. Sampling rate of 48 KHz, with 24 bit cod-ing rate, was used for recordcod-ing in stereo mode. There were no interruptions from the social envi-ronment during the data recording. The only un-wanted noise that could overlap the cry sound may be from fan and air-conditioner. The ambient tem-perature during the recordings was 38◦C, which
was regulated by the air conditioner at 25◦C.
2.2 Organization of the IIIT-S ICSD
The terminologies used in naming of the database files, given inTable 1, are described below:
• Session: The acoustic signal, right from the time an infant starts crying (including all in-halations and exin-halations), until the infant be-comes quiet, is asession.
• Session subpart: Each session consists of
Table 2:Causes of Infant cry (in IIIT-S ICSD) (a) Cry Causes (b) Description
1. Pain Cry due to pain (caused by vaccination, physical hurt or internal pain)
2. Discomfort Cry due to irritation caused by the external environ-ment (e.g., the doctor open-ing baby's mouth to pour-in drops, or the vaccination) 3. Emotional
Need Cry when the baby wants togo back to parents arms 4. Ailment Cries due to any ailments
like cold, cough, fever 5.
Environmen-tal factors
Cry due to fear of the sur-roundings or change in en-vironmental conditions. 6. Hunger/Thirst Cry when the baby is
hun-gry or thirsty
of signals, separated by some noise
• Cry: Each session subpart comprises of a number of cries, separated by some noise.
A two stage process was followed for data col-lection in the study. The first stage involved
raw data collection at the hospital, and the sec-ond stage includedpre-processing. The unwanted noise, in the raw data was removed using ‘Wave-Surfer’ tool, to render it cross-talk free. The cries were categorized as per the ground reality, i.e., the actual cause as per the doctor or parent. The main causes of cry that we came across, are described inTable 2, in columns (a) and (b).
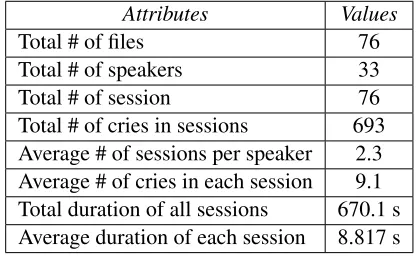
The cry as combination of two or more causes is retained in a separate category. There was also a special case, when an infant cried by listening to another infant cry. Not many samples could be obtained for this cry due toDomino effect, but this is retained as another special category, for future study. The database consists of total 76 cry sound files, which can be categorised in 6 classes. The database summary is given inTable 3.
3 Signal Processing Methods
3.1 Short Time Fourier Transform
Short time Fourier Transform(STFT) (Oppenheim et al., 1989) is used to process the segments of the cry signals in the frequency domain. The data is divided into overlapping frames. The Fourier
Table 3:Summary of contents in IIIT-S ICSD
Attributes Values
Total # of files 76 Total # of speakers 33 Total # of session 76 Total # of cries in sessions 693 Average # of sessions per speaker 2.3 Average # of cries in each session 9.1 Total duration of all sessions 670.1 s Average duration of each session 8.817 s
transform for each frame is given by:
X(τ, ω) =
nX=∞
n=−∞
x[n]w[n−m]e−jwn (1)
Where x[n] is the signal and w[n] is the win-dow function. Here m is discrete and ω is
con-tinuous (Oppenheim et al., 1989). Magnitude of the STFT gives thespectrogram, i.e.,|X(τ, ω)|2. Spectrographic analysis basically represents the 3D spectral information obtained from the magni-tude spectrum, for the short-time overlapped win-dow segments. TheX-axisrepresents time,Y-axis
represents frequency, and the third dimension rep-resents the log magnitude of the sinusoidal fre-quency components, which is converted to the pro-portional intensity.
3.2 Auto Correlation Analysis
Theauto correlation function(Rabiner and Juang, 1993) reflects the similarity between a random se-quence and the time-delayed same sese-quence. For the speech signalx(n), thecorrelationfunction is defined as
rx(m) =E[x(n)x(n+m)]
= lim
N→∞ 1 2N+ 1
nX=N
n=−N
x(n)x(n+m)
(2)
Where, E[.] represents statistical expectations (Rabiner and Juang, 1993). Since speech produc-tion system can be regarded as staproduc-tionary within short-time frames, the cry signal is divided into frames. The auto-correlation function is:
rx0(m) = 1 2N + 1
nX=N
n=−N
x(n)x(n+m) (3)
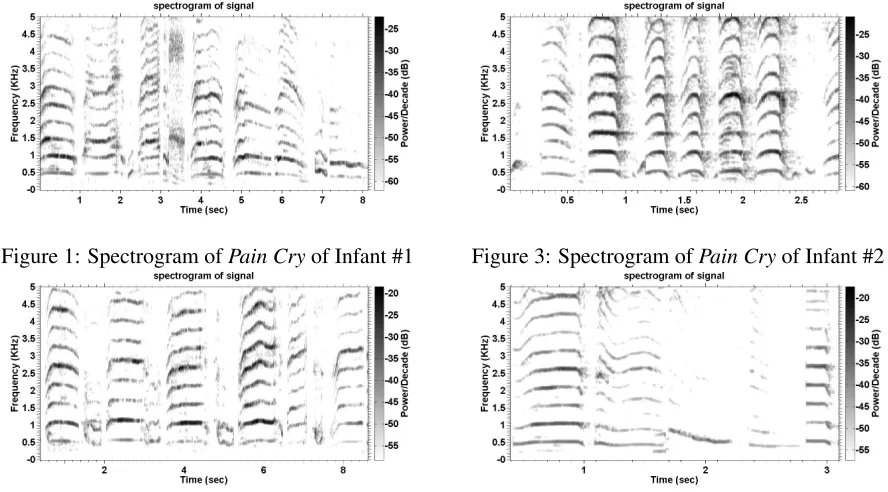
[image:3.612.313.522.68.196.2]Figure 1: Spectrogram ofPain Cryof Infant #1
Figure 2: Spectrogram ofDiscomfort Cry, Infant #1
When m = 0, then (3) represents short-term en-ergyof the signal (Shuyin et al., 2009). The pitch period information is more pronounced in auto-correlation, than in speech signal.
3.3 Linear prediction (LP) analysis
Speech signal is produced by the convolution of the excitation source and time-varying vocal tract system components. These components can be separated, using LP analysis (Makhoul, 1975). The prediction of current sample as a linear com-bination of pastpsamples forms the basis of LP analysis, wherepis the order of prediction. The predicted sample is sˆ = −Ppk=1aks(n −k), where aks are the LP coefficients. Here s(n) is thewindowed speech sequence, obtained by mul-tiplying short-time speech frame with a Hamming window, i.e.,s(n) =x(n)w(n), wherew(n)is the
windowing function.The prediction error e(n)can be computed by the difference between the actual samples(n) and the predicted samplessˆ(n)
(Ra-biner and Juang, 1993). This is given bye(n) =
s(n)−sˆ(n), i.e.,e(n) =s(n)+Ppk=1aks(n−k). The LP coefficients are used to minimize the
prediction error e(n). The coefficients are com-puted using the least squares method, that min-imizes the LP residual or total prediction error
(Makhoul, 1975). In frequency domain, it can be
Figure 3: Spectrogram ofPain Cryof Infant #2
Figure 4: Spectrogram ofDiscomfort Cry, Infant #2
represented asE(z) =S(z) +Pkp=1akS(z)z−k.
A(z) = E(z)
S(z) = 1 +
p
X
k=1
akz−k (4)
The LP SpectrumH(z)can be obtained as,
H(z) = 1
1 +Ppk=1akz−k
= 1
A(z) (5)
As A(z)is the reciprocal of H(z), the LP residual is obtained by inverse filtering of the speech. The auto-correlation of LP residual can also give infor-mation about the pitch period.
4 Features explored
In this study, correlation between infant cry and the likely causes is examined using mainly the magnitude of short-time spectrogram and F0.
Spectrograms are used for obtaining the F0 and harmonics asGround Truth.
Figure 5: Illustration of (a) signal waveform, (b) sig-nal energy contour and (c)F0contour ofPain Cryof infant #1 (usingauto-correlation)
Figure 6: Illustration of (a) signal waveform, (b) sig-nal energy contour and (c)F0contour ofDiscomfort
Cryof infant #1 (usingauto-correlation)
ground truth, which is obtained using the spec-trograms. Similar patterns of changes in theF0 contours are observed for the cries due to similar causes, in particular forpain cry and discomfort cry.
5 Preliminary Analysis
The changes inF0 contour and harmonics for in-fant cry signals were observed using the spec-trograms. The spectrograms were plotted for cry signal frames of 30 ms with shift of 9ms, for the same infant, crying for different causes. The F0 contours and harmonics of a pain cry (Fig. 1 and Fig. 3) indicate cyclic changes with larger fluctuations. These could be due to psy-chological conditions duringpain. The shape of
F0 contour in the case of cries due todiscomfort (Fig. 2 and Fig. 4) have relativelyflatnature, with changes inF0 at larger periods and having lesser fluctuations.
[image:5.612.330.522.208.306.2]TheF0contours derived using auto-correlation and LP analysis were observed in similar way. Similar to the observations from spectrograms, theseF0contours showcyclicchanges with larger fluctuations for cries due to pain, in Fig. 5 and Fig. 7. In the case of cries due todiscomfort, the
Figure 7: Illustration of (a) signal waveform, (b) sig-nal energy contour, (c) LP residual and (d)F0 con-tour ofPain Cryof infant #1 (usingLP analysis)
Figure 8: Illustration of (a) signal waveform, (b) sig-nal energy contour, (c) LP residual and (d) F0 con-tour ofDiscomfort Cry, infant #1(LP analysis)
F0contours are relativelyflatin Fig. 6 and Fig. 8, with lesser fluctuations.
6 Summary and Conclusions
In the study of infant cry signals the database col-lection and collation plays a vital role, as the en-tire analysis depends upon it. Hence, in this paper emphasis is laid upon collection and organization of infant cry data, for the classification of infant cries according to different causes. The predictive reasons for infant cries were noted as per the infer-ence by doctor and parents. Details of the IIIT-S ICSD database are also elaborated.
[image:5.612.96.292.209.305.2]larger fluctuations forpain cry, and are relatively
flatwith lesser fluctuations fordiscomfort cry. The observations are consistent across different infant cries, and signal processing methods.
Further, we intend to utilize this database to examine the cry characteristics using other sig-nal processing methods and carry out quantitative analysis in detail. This study would be helpful to-wards enabling the early diagnostics and medical care, if the reason of the infant cry due to a partic-ular ailment is established early, especially where the reaction time could be critically important.
Acknowledgement
The authors are thankful to Dr. Manish Gour (M.B.B.S, DCH) and Dr. Nizam (M.B.B.S) of Pranaam Hospital, Madinaguda, Hyderabad and parents of the infants for supporting in collection of the cry samples needed for the study.
References
Y. Abdulaziz and S.M.S. Ahmad. 2010. Infant cry recognition system: A comparison of system perfor-mance based on mel frequency and linear prediction cepstral coefficients. InInt. Conf. on Information Retrieval Knowledge Management, (CAMP), pages 260–263, March.
H.E. Baeck and M.N. Souza. 2001. Study of acous-tic features of newborn cries that correlate with the context. In Engineering in Medicine and Biology Society, 2001. Annual IEEE Int. Conf. of the 23rd Proceedings, volume 3, pages 2174–2177.
S. Chandralingam, T. Anjaneyulu, and K. Satya-narayana. 2012. Estimation of fundamental and formant frequencies of infants cries; a study of in-fants with congenital heart disorder. InIndian Jour-nal of Computer Science and Engineering, volume 3(4), pages 574–582.
Raina P. Daga and Anagha M. Panditrao. 2011. Arti-cle: Acoustical analysis of pain cries in neonates: Fundamental frequency. IJCA Special Issue on Electronics, Information and Communication En-gineering, ICEICE(3):18–21, December. Full text available.
R. Hidayati, I.K.E. Purnama, and M.H. Purnomo. 2009. The extraction of acoustic features of infant cry for emotion detection based on pitch and for-mants. In Int. Conf. onInstrumentation, Commu-nications, Information Technology, and Biomedical Engineering (ICICI-BME), pages 1–5, Nov.
G. Varallyay Jr, Z. Benyo A. Illenyi, Z. Farkas, and G. Katona. 2005. The speech-chorus method at the analysis of the infant cry. InAcoustic Review, vol-ume 6(2), page 915.
K. Kuo. 2010. Feature extraction and recogni-tion of infant cries. In IEEE Int. Conf. on Elec-tro/Information Technology (EIT), pages 1–5, May.
J. Makhoul. 1975. Linear prediction: A tutorial re-view. Proceedings of the IEEE, 63(4):561–580, April.
Y. Mima and K. Arakawa. 2006. Cause estimation of younger babies’ cries from the frequency analyses of the voice - classification of hunger, sleepiness, and discomfort. In International Symposium on Intel-ligent Signal Processing and Communications, IS-PACS ’06, pages 29–32, Dec.
Amy Neustein, editor. 2010. Advances in Speech Recognition: Mobile Environments, Call Centers and Clinics. Springer, New York.
Alan V Oppenheim, Ronald W Schafer, John R Buck, and et al. 1989. Discretetime signal processing, vol-ume 2. Prentice-hall Englewood Cliffs.
M. Petroni, M.E. Malowany, C.C. Johnston, and B.J. Stevens. 1994. A new, robust vocal fundamental frequency(f0)determination method for the
analy-sis of infant cries. InComputer-Based Medical Sys-tems, Proceedings IEEE Seventh Symposium, pages 223–228, June.
Lawrence Rabiner and Biing-Hwang Juang. 1993. Fundamentals of Speech Recognition. Prentice-Hall, Inc., Upper Saddle River, NJ, USA.
Zhang Shuyin, Guo Ying, and Wang Buhong. 2009. Auto-correlation property of speech and its applica-tion in voice activity detecapplica-tion. InFirst Int. Work-shop on Education Technology and Computer Sci-ence, ETCS ’09, volume 3, pages 265–268, March.
Y Skogsdal, M Eriksson, and J Schollin. 1997. Anal-gesia in newborns given oral glucose. Acta Pdi-atrica, 86(2):217–220.
Gyorgy Varallyay-Jr. 2007. The melody of cry-ing. Int. Journal of Pediatric Otorhinolaryngology, pages 1699–1708.
Gyorgy Varallyay. 2006. Future prospects of the appli-cation of the infant cry in the medicine. InElectrical Engineering, volume 50(1-2), pages 47–62.
Philip Sanford Zeskind and Timothy R. Marshall. 1988. The relation between variations in pitch and maternal perceptions of infant crying. Child Devel-opment, 59(1):193–196.