Efficient Text Extraction Algorithm Using Color
Clustering for Language Translation in Mobile Phone
Adrián Canedo-Rodríguez1, Jung Hyoun Kim2, Soo-Hyung Kim3, John Kelly2, Jung Hee Kim2, Sun Yi2, Sai Kiran Veeramachaneni2, Yolanda Blanco-Fernández1
1
Department of Telematics Engineering, University of Vigo, Vigo, Spain; 2College of Engineering, North Carolina A&T State Uni- versity, Greensboro, USA; 3Department of Computer Science, Chonnam National University, Kwangju, South Korea.
Email: [email protected], [email protected], [email protected]
Received March 22nd, 2012; revised April 17th, 2012; accepted May 11th, 2012
ABSTRACT
Many Text Extraction methodologies have been proposed, but none of them are suitable to be part of a real system im- plemented on a device with low computational resources, either because their accuracy is insufficient, or because their performance is too slow. In this sense, we propose a Text Extraction algorithm for the context of language translation of scene text images with mobile phones, which is fast and accurate at the same time. The algorithm uses very efficient computations to calculate the Principal Color Components of a previously quantized image, and decides which ones are the main foreground-background colors, after which it extracts the text in the image. We have compared our algorithm with other algorithms using commercial OCR, achieving accuracy rates more than 12% higher, and performing two times faster. Also, our methodology is more robust against common degradations, such as uneven illumination, or blur- ring. Thus, we developed a very attractive system to accurately separate foreground and background from scene text images, working over low computational resources devices.
Keywords: Text Extraction; Color Quantization; Text Binarization; Language Translation
1. Introduction
Within the general problem of Pattern Recognition, Text Information Extraction (TIE) in images and video exhibit characteristics that deserve individual analyses and solu- tions. Traditionally, TIE was related to the analysis of scanned documents, which provided a pseudo-ideal sce- nario: high-resolution, minimal character shape distortion, even and adequate illumination, clear, simple and known backgrounds, minimal blur, and so on. An Optical Char- acter Recognition (OCR) technology was developed ac- cording to these ideal scenarios, achieving high recogni- tion rates. However, this simple application did not fulfill the users’ needs at all because scanners are slow and not portable. Moreover, the OCR technology can only proc- ess text embedded in documents, not in other objects.
The explosion of Handheld Imaging Devices (HIDs) represents an excellent opportunity to take advantage of TIE technology, and provide variety of useful solutions to the users’ needs. These devices are portable, compact, able to capture images of any text in any scenario (us- ually called Scene Text Images, or Natural Scenes), and experienced a Moore’s Law price reduction since they first appeared (specifically the digital cameras, either standalone or embedded into mobile phones or PDAs).
Sign recognition and translation for travelers, automatic license plate recognition for law enforcement, driver as- sistance systems, assistance for visually impaired persons, or autonomous vehicle navigation represent just a small set of the wide range of possibilities of this new area.
However, the new TIE scenario that HIDs bring is far from being at the maturity level of OCR technology. The resolution is lower than in scanned documents, the sur- face of the object on which the text is embedded is arbi- trary, the text can be distorted, the illumination is very difficult to control, and the background is often complex. Therefore, commercial OCRs present very low recogni- tion rates on this kind of images, requiring preprocessing to improve performance, delimitating the text areas (text localization), and separating foreground from background (text binarization). These steps are usually very computa- tionally expensive, so their implementation on HIDs is often unfeasible. On the other hand, those methods which are computationally efficient are not robust enough to cope with “real world” degradations, such as uneven illu- minations, or lighting reflections.
plemented as a part of an accurate, successful, and useful TIE system into these low computational devices. Instead of using just monochromatic information as in well- known fast algorithms, we use all the color information to ensure robustness against “real world” degradations. This adds complexity to the system, so we will use sim- ple computations to perform the segmentation, in order to minimize the processing time. First, the color image is quantized to reduce the number of colors. Then, the Prin- cipal Color Components in the image are isolated, and from them, the foreground and background colors are separated based on the number of occurrences of each component, and the distance between them.
In Section 2, we introduce the general TIE system, with the main challenges with which it has to cope, its working scenario, and the different steps involved. After that, the text extraction step is explored in detail, and the different Text Extraction algorithms are introduced. In Sections 3 and 4, we describe and verify our algorithm, whose results are described and analyzed in Section 5. Finally, we summarize the contents of the paper, and discuss the convenience of our proposal, and our future research direction in Section 6.
2. Background
2.1. Overall TIE System Working Scenario
In this section, we will summarize the main background ideas related with the Text Information Extraction area [1-3]. Since the beginning of TIE research, there have been many proposals for specific applications. Due to the enormity of the challenges such as layout complexity, noise, distortions etc., no general system has been pro- posed so far capable of handling all the possible situa- tions. The main factors of a TIE system are text charac- teristics, image scenario, and uneven image effects. Their importance depend on specific application of the system: if the goal of the system is to process scanned images from text documents, we will find that most of those challenges become insignificant, while if the goal is to process any picture that contains a scene text, most of them will be critical.
The images for which a TIE system can be divided into two major groups: traditional documents (subdivided into gray scale documents, or multicolor documents), and multi-context images (subdivided into superimposed text images, or scene text images). In this regard, gray-scale documents are less challenging, followed by multicolor documents, and superimposed text images. Scene text images are, by far, the most complex among the four.
A TIE system receives a still image or a sequence of images as an input, which can either contain text or not within them. The overall steps for the TIE system to re- cognize a text in an image or a video clip are:
Text Detection: Determination of the presence of text. Text Localization: Determination of the location of
the text.
Text Tracking: In sequences of images, determination of the coherence of the text between frames, to reduce the processing time by not applying all the steps to every frame, and to maintain the integrity of position across adjacent frames.
Text Extraction: Binarization of the image by sepa- rating the text components (foreground) from the back- ground.
Text Enhancement: Increasing of the quality of the binary image, mainly by increasing its resolution and reducing the noise.
Text Recognition (OCR): Transformation of the bi- nary text image into plain text using an Optical Char- acter Recognition Engine.
Each step may include a pre-processing, and a post- processing part, to increase its overall accuracy. De- pending on the application and its requirements, the TIE system will involve all the steps above, or a subset of them. Particularly, the text localization is one of the im- portant steps for the TIE, especially the text extraction so that we have developed a new simple and fast text locali- zation method [4].
2.2. Text Localization Developed for This Purpose
In Text Localization, high speed and locating the impor- tant text in the image are the most important things [4]. Many text localization methods have been proposed so far but none of them can be implemented in real scene text translation system by taking images using mobile phones. Images are generally stored in JPEG format be- cause a mobile phone doesn’t have much memory space. Thus, we have developed and proposed a new simple and efficient text localization method. The two expectations on the text localization method we proposed are the im- ages are stored in JPEG format and the important text in the image is centered. A DCT block which contains characters present high frequency components both in horizontal and vertical directions for locating the text because of the variations in foreground and back ground.
The text localization algorithm is simple and afford- able for the images taken from mobile phones. This algo- rithm shows high accuracy rates in different conditions and it can be implemented on devices with low computa- tional performance.
2.3. Concept of Text Extraction
and a binary image is produced as the output. We will assume, without lack of generality, that the input text image contains a precisely localized text, although cer- tain imprecision in the localization are also acceptable. The text extraction step is an essential part of every TIE system, as it will determine the accuracy of the text rec- ognition step, depending on the quality of the fore- ground-background separation. In order to perform this separation, all of the text image characteristics can be used, such as color differences, character position, char- acter shape, layout, and so on.
In general, text extraction methods use the colors of the foreground and the background as the main informa- tion source to separate them. That is, they divide the color space in groups, and each of them is classified as foreground or background, so are the pixels which con- tain those colors. The first generation of text extraction methodologies performed the segmentation using gray- scale images, assuming that the backgrounds were clean, and the degradations on the image were small enough not to be considered. Nevertheless, this is not the case for natural scenes, so soon new algorithms were developed, using the color information of the text pictures, allowing the possibility of dealing with more complex situations. Currently, text extraction methods can be classified into two main groups: Threshold-based, and Group-based. Thresholds based methods are calculated in order to clas- sify the different colors as foreground, or as background. They can be sub-classified into three groups: Histogram- based, Adaptive or Local, and Entropy-based [5-14]. Group-based methodologies group pixels together ac- cording to certain criteria. Based on how the pixels are classified, they can be divided in three major groups: Region-based, Clustering-based and Learning-based [15- 30].
3. Description of Proposed Methodology
Our algorithm has been designed as the text extraction part of a system for English to Spanish translation of the text present on signboard images, implemented on a mo- bile phone [31]. Our focus was to develop an accurate and efficient methodology. On the one hand, the method has to be accurate enough in order to ensure the useful- ness of the TIE systems which utilize it as a part of them: in other words, the text extraction part should not be a major source of errors for the system. On the other hand, the method has to be efficient, so it could be implemented in any system over low computational resources devices: specifically, efficiency is critical when dealing with ap- plications when is needed to give results instantly to the user, such as text images translation (our case), or text images to speech applications.The algorithm assumes that there exists a reduced set of colors of the image’s pixels, called Principal Compo-
nents. Due to the contrast necessary for text images be- tween text and background to ensure readability, all the Principal Components can be classified either as fore- ground, or as background, with one of the components as the centroid of the Principal Components Group. How- ever, since the image can be degraded in various ways, each pixel color will be distorted in more or less grade, and converted on a different color. By knowing these components, the system will be capable of recovering the original value of each pixel, and then, segment the im- age.
Although the most efficient text extraction algorithms use gray-scale or monochromatic images to perform the separation, we decided to use the information of the whole RGB color space because of the accuracy benefits that it implies. However, this decision causes the prob- lem to be much more complex, so the algorithm’s com- putations were designed to be as simple as possible, to maintain the processing time as low as possible. First of all, the color space is reduced from a 24 bit (224 colors), to a 12 bit (212 colors) representation, to reduce the com- plexity of the problem, from which just the colors with a large number of appearances will be further considered. Then, to take into account possible distortions, the num- ber of occurrences of each color is calculated as its own occurrences, plus the occurrences of its neighbors. Using that information, the technique isolates the Principal Com- ponents, decides the centroid of each Principal Com- ponents Group, and classifies each pixel either as fore- ground, or as background.
3.1. Notation
Equations (1) and (2) represent a digital image using the RGB (Red, Green, Blue) color space using a 3D matrix:
( , ) ( , ) { , , }, ,
0, , 1 0, , 1
m
f x y f x y m R G B
x M y N
(1)
,
0, 0 0, 1 0, 1
1, 0 1, 1 1, 1
,
1, 0 1, 1
( , ) 0, , 1 m
m f x y
f f f N
f f f N
f M f M
f x y L
N
(2)
where fm
x y,
is a representation of the intensity ofthe color component m on the image. Therefore, the co- lor of a pixel (x, y) will be a vector composed by the pixel’s color component on each color space:
,
R
,
, G
,
, B
by a combination of three intensity values in three dif- ferent color components (R, G, B), where a high intensity of a particular component stands for a high importance of that component in the pixel’s color. Since the number of intensity levels is L, and the number of color components is three, the total number of possible colors in the image will be L3.
3.2. Text Extraction
3.2.1. Color Reduction
Considering an ideal case, the text image just contains two colors (foreground and background colors), so it is easy to binarize. Nevertheless, in the case that we are considering, the number of colors is much larger because of the various difficulties. We can model the image as a combination of several principal colors, and their distor- tions, caused by blurring effects, uneven illumination, lightening reflections, and so on. Those principal com- ponents can be classified either as part of the foreground or as part of the background, and the image can be bi- narized.
First of all, in order to save computational time, we reduce the number of colors by performing a color quan- tization of the image. Given the image f(x, y), each inten- sity component fm(x, y) is quantized from its L original levels to D levels (D < L), so the number of colors is reduced from L3 to D3. In our real implementation, the original images are represented with L = 28 levels (8 bits per RGB channel), and we quantize them into D = 24 levels (4 bits per channel). Following with the general notation, the quantization step is:
D L
And the quantized image and its quantized compo- nents are defined as in (4) and (5).
, , , , ,
,
0, , 1 0, , 1
m
f x y f x y m R G B
x M y N
(4)
( , ) 1
,
2 1
, 2
m m
m
f x y
f x y D
L
l x y
(5)
where lm
x y,
0,,D1
. [image:4.595.325.519.91.282.2] [image:4.595.327.537.484.546.2]However, our goal is not to give a representation of the quantized image, but to cluster each pixel into a group.
Figure 1 shows a graphical example for the quantization of the red and green components of different pixels in an image and the calculation of its correspondent lr
x y,
and lg
x y,
values. Therefore, we can define the levelof the image as in (6) which gives us a compact and effi- cient representation of the quantized image:
,
m
,
,
, ,
l x y l x y m R G B
Figure 1. Graphical example: the quantization of the red and green components of different (x, y) pixels (represented by circles).
3.2.2. Principal Color Extraction
Each pixel (x, y) will be clustered into a group Crgb , depending on its level:
, , , ,
rgbC x y l x y r g b (7) where r g b, ,
0,,D1
.From which we take into account (to reduce further computational complexity) the clusters whose number of elements (pixels) is larger than the number of pixels of the image divided by the number of groups Crgb in (8) that contain at least one pixel:
,
{ | 1}
, 0, , 1
i i i i i i
j j j j j j
r g b rgb r g b
r g b r g b
rgb
M N C
C C
C C
i j C
(8)
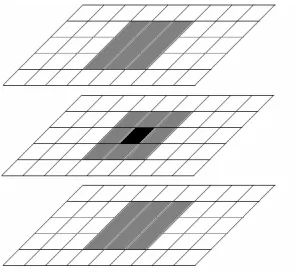
At this point, we will extract the Principal Color Com- ponents of the image. Each component contains one main color group, and its neighbors, which represent the dis- tortions on the principal color of the component. The neighborhood of a color contains the color groups whose distance from the considered color is less than or equal to one using the Chebyshev distance. Figure 2 shows the neighborhood (grey) of a cell (black), even though we consider the black cell as a part of its neighborhood. Therefore, the neighbors of the black cell are those lo- cated within a maximum Chebyshev distance of 1.
max , , 1 ,
, 0, , 1
i i i j j j
r g b r g b i j i j i j
rgb
N C r r g g b b
i j C
(9)
Figure 2. The neighborhood (grey) of a cell (black) within a maximum Chebyshev distance of 1.
0, , 1i i i
rgb r g b rgb
N N i C
(10)Using the definition of the neighborhood of a group, we define the importance of a color as the number of pixels which can be considered as formed by it:
i i i
,
0, , 1
i i
r g b r g bi rgb
C
p N i C (11)
By knowing the number of occurrences of each color on the image, we can decide which ones are the princi- pals, that is, the most frequent ones. The following algo- rithm shows how the principal components are extracted. Initially, both the group of Principal Color Components rgb, and the group of colors which cannot be considered to be Principal Color Components rg are empty. In each iteration n, the largest element of rgb not belong- ing to rgb is included on rgb (as its n
th
component ) and excluded along with its neighbors from rgb for future selections, by including them in rgb (as its nth component ). By doing this, we choose the Prin- cipal Color Components rgb as the union of the most important colors on each iteration ( ), excluding those which can be considered as distortions of Principal Color Components ( ).
P n rgb P b E C n rgb P E P C E n rgb E rgb E P
0 0 0 1 0 1 0 while , , 0, , , 1j j j i i i
i i
j j j
j j j i i i
i i
j j j
rgb n i rgb rgb i n
r g b r g b
rgb rgb r g bi
n i r g b rgb rgb
i
n
r g b r g b
rgb r g bi
n i r g b rgb rgb
i P
E C
C C
E P C p p
C C E
C C
n P C p p
C C E n n
(12)where and .
[image:5.595.94.242.83.219.2] [image:5.595.337.540.506.703.2]0 n i rgb rgb i E E
0 n i rgb rgb i P P
Figure 3 shows an example for the extraction of the Principal Color Components (circles) and their respective neighborhoods (polygons) in a two dimensional color space, where each cell represents a color. The darker gray level of a cell is the larger amount of pixels belong- ing to it, so that the more important Component is the brown one, followed by the green one, and finally, the yellow one. The white color on a cell represents the ab- sence of pixels belonging to it.
3.2.3. Text Binarization
We separate the foreground and the background by using the contrast between colors, and the importance of those colors in the image, represented by the number of pixels that belong to each color group.
In order to measure the contrast, we calculate the Eu- clidean distance (widely used in Text Extraction) be- tween each pair of groups of as shown in (13):
( , )i j Prgb
2
2
,
i i i j j j
r g b r g b e
i j i j i j
P P
d
r r g g b b
2 (13)
where i j,
0,,Crgb 1 ,
i j.Also, the importance of each color group is calculated as the number of pixels of the group r g bi i i as in (11). We assume that, even if several colors can form the foreground and the background, it is possible to select two of them as the main ones and the rest of them can be classified as variations of one of them (the most similar one). The foreground-background couple of main color groups will be those which maximize the combination of both contrast and color importance, represented by the Foreground-Background Centroid function:
C p
, ,i i i j j j
i i i j j j i i i j j j
r g b r g b
r g b r g b r g b r g b e
P P
C
P P P P
d p p
(14)
we decide for every group in
Cr g bj j j Cr g bj j j 1
that it belongs to the background if it is closer (Euclidean dis- tance) to the main background group, and vice versa. After this decision, the foreground and the background will be separated, and the image can be binarized.4. Verification of the Methodology
Our goal was to develop a new methodology suitable for its implementation under architectures with limited com- putational resources, reliable enough to handle the more common degradations present in natural scene images, and fast enough to work in a reasonably small time pe- riod. We developed an algorithm that can be classified both on the Histogram-based and on the Clustering-based ones. On the one hand, Histogram-based algorithm al- ways construct one or several histograms (one for each color component), seeking for peaks on them (dominant colors), and defining thresholds on the valleys between peaks (modes). In this regard, we build a 3-D histogram and enhance the most frequent colors as well the number and location of the “peaks”. On the other hand, the loca- lization of these modes (Principal Color Components) is performed by iteratively clustering the different candi- dates into larger groups, until reaching the real number of important colors in the image.
4.1. Gray-Level Verses RGB Space
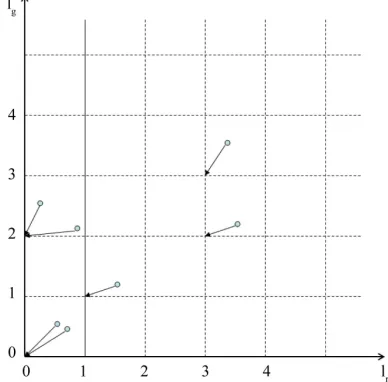
First of all, we decided to use all the color information of the image, on the contrary of other approaches, which just use gray-scale images or each channel independently although the color channels are usually correlated, as in the RGB space. It is easy to demonstrate that by just us- ing the luminance component of the image it is more difficult to separate foreground and background, or even impossible. Consider the usual transformation from any RGB color representation to its equivalent Luminance component:
0.3 0.59 0.11
Y R G B (15) As any linear equation with more than one unknown element, Equation (15) has infinite solutions; for every Y value, there can be several possible RGB combinations which produce it. If we constrain the RGB color space to a 24 bits representation (that is, 8 bits per channel), there are several possible combinations of RGB values which produce the same or closer Y values as shown in Figure 4. In other words, although the foreground and the back- ground can be very different in color image, the Lumi- nance transformation introduces distortion on the original image, making the segmentation more difficult, and even impossible. Thus, we decided to use the whole color in- formation.
[image:6.595.324.524.81.167.2](a) (b) (c) (d) (e) (f)
Figure 4. Example of six different colors which theoretically produce the same gray value: the RGB and Y values nor- malized on the interval [0, 1] are: (a) R = 1, G = 0.339, B = 0, producing Y = 0.5; (b) R = 1, G = 0.2458, B = 0.5, producing Y = 0.5; (c) R = 1, G = 0.1525, B = 1, producing Y = 0.5; (d) R = 0, G = 0.8475, B = 0, producing Y = 0.5; (e) R = 0, G = 0.7542, B = 0.5, producing Y = 0.5; (f) R = 0, G = 0.661, B = 1, producing Y = 0.5.
4.2. Image Quantization
Images usually contain a big amount of redundant color information, in order to enhance the quality of the human visual perception. Nevertheless, most of this information is not useful for the purpose of text extraction, and it just increases the processing time of the text extraction algo- rithms. The best solution seems to be a color quantization of each RGB color channel as we proposed in (5), espe- cially if we choose D as a power of 2, since the quantiza- tion operation can be done by a simple bit dropping op- eration. Figure 5 is an example of the difference between the original images, and the quantized ones. The quanti- zation does not cause major differences between the im- ages, so it does not cause any problem on the further Text Extraction.
4.3. 3-D Color Histogram
At a glance, histogram-based binarization algorithms are the most suited to work on our target devices (mobile phones) since they are very simple, fast, and quite reli- able under controlled degradation conditions, but they often fail when implemented to deal with “real world” images. Also, they usually miss important information on the image, not only because they just process gray-scale images, but because they treat each color channel inde- pendently, as if they were not correlated. In order obtain uncorrelated color components, some authors apply the Fisher Discriminant Analysis to the image before con- structing the histogram of each channel [32], but this pro- cessing becomes computationally prohibitive on our de- vices. Instead, our algorithm uses the idea of building a 3-D histogram [33-35], looking for the peaks by erasing the less-frequent colors for simplicity as in (8), and en- hancing the most suited candidates depending on the im- portance of its neighbors as in (11).
4.4. Principal Components Extraction
Figure 5. (a) Original image with a 24 bit representation; (b) Its quantized image with a 12 bit representation.
patterns, which we use to perform the binarization, al- though minimizing the importance of the assumptions made, for the system versatility. For example, texts are designed to be readable, so the contrast between the text and the background is high in general. Also, to ensure the readability, the foreground-background contrast exists even in the case of complex backgrounds. In an almost ideal case, there are just two colors on the image, and slight variations of them caused by small degradations. These two colors in the image would be the most com- mon ones, so it would be easy to find, and separate the foreground and the background. However, not only the “real world” distortions are bigger than in this ideal case, but also the texts and the background can be designed with several colors. For these reasons, any assumption about the number of colors present on the image before knowing its nature just reduces the versatility of the technique. Our algorithm takes advantage of the afore- mentioned patterns, extracting the most important colors without making any assumptions on its number, ensuring the flexibility against a wide range of different situations. Other conventional classification schemes, such as k- means, fuzzy c-means, GMM, need to perform iterative algorithms involving complex statistical group calcula- tions, and therefore they are computationally expensive to implement on mobile phones. On the contrary, our classification algorithm in (12) is simple enough to be implemented on these devices, without lack of the quality of the binarized results, as it will be seen in the Section 5.
4.5. Foreground-Background Centroid Function
Using the set of Principal Components, we have to bi- narize the image. We select one Principal Component as the centroid of the text group, and another one as the centroid of the background group, based on the Fore- ground-Background Centroid Function as in (14), maxi- mizing the combination of contrast, and color frequency. In general, although the image can consist of several components, two of them will be the more frequent ones, corresponding with the foreground and background main colors. Also, as the foreground-background contrast is supposed to be high, the distance between these compo- nents should be high. So by maximizing a combination of both frequency and distance, the main foreground and background colors will be efficiently extracted.
4.6. Color Distance Selection
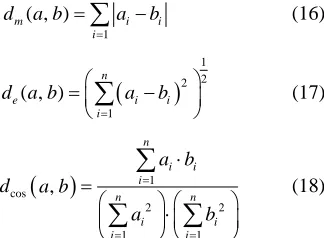
Although there exist many possible distances to measure the contrast between colors, the more widely used on Text Extraction are: Manhattan distance as (16), Euclid- ean distance as (17), Cosine distance as (18) or any com- bination of them.
1
( , )
n m
i
d a b a b
i i
(16)
1 2 2 1
( , ) n
e i
i
d a b a b
i
(17)
1cos
2 2
1 1
,
n
i i i n n
i i i i
a b
d a b
a b
(18)
where a
a a a1, 2, 3,,an
andare two general n-dimensional vectors.
1, 2, 3, , n
b b b b b
Generally speaking, the Euclidean distance was the most robust one in our experiments, although the Man- hattan distance showed similar results. The Manhattan distance has the advantage of its simplicity so that it re- quires less computing time. On the other hand, the Co- sine distance shows less robustness than the others be- cause of lacks of the difference measures between color intensity, although it gives a good measure of the hue difference of the colors which is robust against uneven lighting effects. However, a combination of the Cosine distance with the Euclidean or the Manhattan distance could improve the accuracy of the algorithm with meas- uring hue and color intensity at the same time. Never- theless, this is not the aim of this paper, and we leave it for future improvements.
5. Experimental Results
Giving an objective measurement of the performance of any TIE system is a very complex task, mainly because of its strong dependence on the selected set of images with which the system has to work. A more realistic measure can be given by implementing another well- known binarization algorithm, and comparing both re- sults. In our case, we have chosen Otsu’s binarization algorithm, since it performs quite good in a very short amount of time, so it could be considered as a candidate for the Text Extraction step in devices with low compu- tational resources. Also, since it is one of the most refer- enced algorithms in the literature, there exist implemen- tations available in several programming languages.
[image:7.595.376.538.174.293.2]Correctly Recognized Characters Precission
Totally Recognized Characters
Correctly Detected Characters Recall
Total Characters
In order to compare the two methodologies in terms of accuracy and processing time, we have programmed our algorithm using Matlab 7.6.9 (R2008a) on a Pentium 4 PC (CPU 3.8 GHz), and used Matlab’s implementation of Otsu’s algorithm. At the same time, we have built two different databases: one consisting on 83 text images (1008 characters in total), and other containing 302 characters. The first one measures the performance of the algorithm working globally in the text image, while the second one measures the performance in ideal “character splitting” situations, that is, an ideal local binarization. We avoided, on the first data base images, that could be very challenging for the OCR engine even under ideal binarization conditions, such as those containing very small, or artistic fonts.
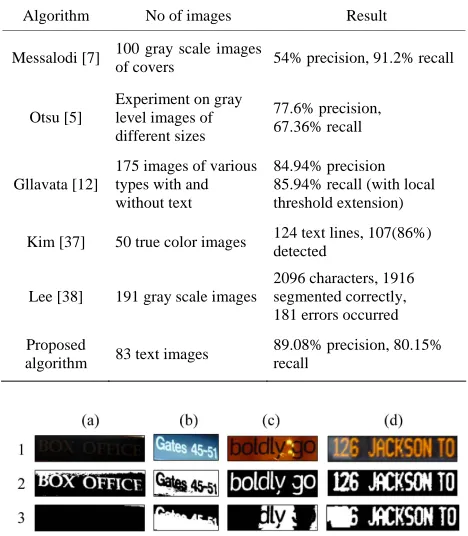
The result in Tables 1 and 2 shows that our algorithm performs better that Otsu’s, both as a global and as a lo- cal algorithm. Roughly speaking, our algorithm’s accu- racy is about 12% higher than Otsu’s with the first data- base (text images), and about 15% with the second one (individual characters). By analyzing carefully the bina- rized images, it is clear as well that our algorithm per- forms better than Otsu’s when dealing with blurring im- ages, uneven illuminations, and foreground-background colors which produce similar gray levels, which could explain the accuracy differences. Also, we have meas- ured the processing times of both methods with the first database (text images). On this experiment, our algorithm performs about two times faster than Otsu’s, with which we demonstrate that not only our algorithm is more ac- curate, but also faster. In Table 3, our algorithm is com- pared with different other algorithms and we achieved good success rate than other algorithms.
[image:8.595.306.540.102.370.2]Figure 6 presents the comparison of the binarization results between our algorithm and the Otsu’s algorithm
Table 1. Performance comparison with the first database.
Otsu Our
Precision 77.6% 89.08%
Recall 67.36% 80.15%
[image:8.595.57.286.596.661.2]Average processing time 0.13 seconds 0.064 seconds
Table 2. Performance comparison with the second database.
Otsu Our
Precision 61.65% 77.94%
Recall 54.3% 70.20%
Table 3. Comparison of different text detection algorithms.
Algorithm No of images Result
Messalodi [7] 100 gray scale images
of covers 54% precision, 91.2% recall
Otsu [5]
Experiment on gray level images of different sizes
77.6% precision, 67.36% recall
Gllavata [12]
175 images of various types with and without text
84.94% precision 85.94% recall (with local threshold extension)
Kim [37] 50 true color images 124 text lines, 107(86%) detected
Lee [38] 191 gray scale images
2096 characters, 1916 segmented correctly, 181 errors occurred
Proposed
algorithm 83 text images
89.08% precision, 80.15% recall
Figure 6. Comparison of the binarization results of our al- gorithm (2) with the Otsu’s algorithm results (3) with 4 challenging images: low contrast (1-a), uneven illumination (1-b, 1-c), light reflections (1-d).
with four challenging images such as low contrast, dis- tance variation, uneven illumination and light reflections. Nevertheless, there are various degradations with which our algorithm cannot cope, such as strong light reflections, and severe blurring and uneven illuminations, among others as in Figures 7 and 8.
However, this kind of situations has not been com- pletely solved by any text extraction algorithms regard- less on their complexity. Thus, it cannot be considered a major problem of our methodology.
6. Summary and Conclusions
[image:8.595.56.286.688.737.2]Figure 7. Examples of good binarization results of our algo-rithm in different situations.
Figure 8. Examples of bad performance of our algorithm: severe uneven illumination (a, b), and severe light reflection (c, d).
for the other, performs even faster than them.
Even though using just the luminance component could accelerate the Text Extraction process, our algo- rithm uses all the color information of the image in order to perform the binarization, since it improves signifi- cantly the robustness of the system. Nevertheless, proc- essing all this information adds a considerable complex- ity to our problem, so each step utilizes very simple computations to ensure that the quickness of the method- ology is not compromised. First, taking into account that images contain a lot of redundant information which is not important for the text extraction, we quantize the image to reduce the colors from 24 to 12 bits. Then, we extract the Principal Color Components of the image from those colors with a larger number of occurrences. Second, since the texts are supposed to be readable, and mainly made up by two colors, we select to be the fore- ground-background main colors those components which maximize a combination of contrast and number of oc- currences. Finally, the image is binarized, by clustering each pixel into its closer group, foreground or back- ground.
We have compared our algorithm with the Otsu’s one, one of the most well-known on the Text Extraction field, which can be considered as a candidate to be imple- mented on low computational resources devices, because of its simplicity, fast performance, and reasonably high accuracy on the most common situations. In the experi- mental results, our algorithm shows a 10% higher accu- racy than Otsu’s, and performs about two times faster. A detailed analysis of the results show the robustness of our algorithm against common degradations that cause to fail Otsu’s, mainly uneven illuminations, blurring, and coin- cidence of different foreground-background colors in the gray scale domain.
Therefore, our algorithm is very appropriate for its implementation on devices with low computational re- sources. In addition, it works in a very short amount of time, so this shortage of computational resources is not a
major problem. Furthermore, it shows high accuracy rates, which ensures its usefulness and its viability. Thus, the algorithm is already prepared to be part of a real TIE system as the one on which we based our efforts: a lan- guage translator of scene text on a mobile phone. Never- theless, we will continue our research by trying to im- prove the accuracy of our methodology with non-expen- sive techniques, focusing on: using spatial information of the colors and their density on different areas, experi- menting intensively with different distances to measure the contrast between colors, and finding an even better combination of color contrast and color importance on the Foreground-Background Centroid function, to sepa- rate the Foreground-Background Principal Components.
REFERENCES
[1] J. Liang, D. Doermann and H. P. Li, “Camera-Based Analysis of Text and Documents: A Survey,” Interna- tional Journal on Document Analysis and Recognition, Vol. 7, No. 2-3, 2005, pp. 84-104.
doi:10.1007/s10032-004-0138-z
[2] C. Thillou and B. Gosselin, “Natural Scene Text Under- standing,” In: Croatia Ed., Vision Systems: Segmentation and Pattern Recognition, I-Tech Education and Publish- ing, 2007, pp. 307-332.
[3] K. Jung, “Text Information Extraction in Images and Video: A Survey,” Pattern Recognition, Vol. 37, No. 5, 2004, pp. 977-997. doi:10.1016/j.patcog.2003.10.012
[4] A. Canedo-Rodríguez, J. Kim, S. Kim, et al., “Simple and Efficient Text Localization for Compressed Images in Mo- bile Phone,” Submitted to IEEE Transaction on Image Processing, 2009.
[5] N. Otsu, “A Threshold Selection Method from Gray Level Histograms,” IEEE Transactions on System, Man and Cy- bernetics, Vol. 9, No. 1, 1979, pp. 62-66.
[6] C. Thillou, S. Ferreira and B. Gosselin, “An Embedded Application for Degraded Text Recognition,” Journal on Applied Signal Processing, Vol. 2005, No. 13, 2005, pp. 2127-2135. doi:10.1155/ASP.2005.2127
[7] S. Messelodi and C. M. Modena, “Automatic Identifica- tion and Skew Estimation of Text Lines in Real Scene Images,” Pattern Recognition, Vol. 32, No. 5, 1992, pp. 791-810. doi:10.1016/S0031-3203(98)00108-3
[8] H. Li and D. Doermann, “Text Enhancement in Digital Video Using Multiple Frame Integration,” Proceedings of ACM International Conference on Multimedia, 1999, pp. 19-22.
[9] A. Zandifar, R. Duraiswami and L. S. Davis, “A Video- Based Framework for the Analysis of Presentations/Post- ers,” International Journal on Document Analysis and Recognition, Vol. 7, No. 2-3, 2005, pp. 178-187.
doi:10.1007/s10032-004-0137-0
[10] W. Niblack, “An Introduction to Image Processing,” Pren- tice-Hall, Upper Saddle River, 1986, pp. 115-116.
age Binarization,” Pattern Recognition, Vol. 33, No. 2, 2000, pp. 225-236.doi:10.1016/S0031-3203(99)00055-2
[12] J. Gllavata, R. Ewerth and B. Freisleben, “Finding Text in Images via Local Thresholding,” Proceedings of IEEE Symposium on Signal Processing and Information Tech-nology, Siegen, 14-17 December 2003, pp. 539-542.
[13] I.-J. Kim, “Multi-Window Binarization of Camera Image for Document Recognition,” Ninth International Work- shop on Frontiers in Handwriting Recognition, Inzisoft Co. Ltd., 26-29 October 2004, pp. 323-327.
[14] Y. Du, C.-I. Chang and P. D. Thouin, “Unsupervised Approach to Colour Video Thresholding,” Optical Engi- neering, Vol. 43, No. 2, 2004, pp. 282-289.
[15] J. Kim, S. Park and S. Kim, “Text Locating from Natural Scene Images Using Image Intensities,” Proceedings of International Conference on Document Analysis and Rec- ognition, Seoul, August 31-September 1 2005, pp. 655- 659.
[16] R. Lienhart and A. Wernicke, “Localising and Segmenting Text in Images, Videos and Web Pages,” IEEE Transac- tions on Circuits and Systems for Video Technology, Vol. 12, No. 4, 2002, pp. 256-268.doi:10.1109/76.999203
[17] H. Hamza, E. Smigiel and A. Belaid, “Neural Based Bi- narisation Techniques,” Proceedings of International Con- ference on Document Analysis and Recognition, Seoul, August 31-September 1 2005, pp. 317-321.
[18] Z. Saidane and C. Garcia, “Robust Binarization for Video Text Recognition,” Ninth International Conference on Document Analysis and Recognition, Vol. 2, 2007, pp. 874- 879.
[19] K. Sobottka, H. Bunke and H. Kronenberg, “Identifica- tion of Text on Colored Book and Journal Covers,” Pro- ceedings of the Fifth International Conference on Docu- ment Analysis and Recognition, Bangalore, 20-22 Sep- tember 1999, pp. 57-62.
[20] T. Perroud, K. Sobottka, H. Bunke and L. Hall, “Text Ex- traction from Colour Documents—Clustering Approaches in Three and Four Dimensions,” Proceedings of Interna-tional Conference on Document Analysis and Recognition, 10-13 September 2001, pp. 937-941.
doi:10.1109/ICDAR.2001.953923
[21] D. Comaniciu, “Nonparametric Robust Methods for Com- puter Vision,” Ph.D. Thesis, Rutgers University, Newark, 2000.
[22] D. Lopresti and J. Zhou, “Locating and Recognising Text in WWW Images,” Information Retrieval, Vol. 2, No. 2-3, 2000, pp. 177-206.doi:10.1023/A:1009954710479
[23] B. Wang, X.-F. Li, F. Liu and F.-Q. Hu, “Colour Text Image Binarisation Based on Binary Texture Analysis,” Proceedings of International Conference on Acoustics, Speech and Signal Processing, Shanghai, 17-21 May 2004, pp. 585-588.
[24] A-N. Lai and G. Lee, “Binarization by Local k-Means Clustering for Korean Text Extraction,” IEEE Interna- tional Symposium on Signal Processing and Information Technology, Gwangju, 16-19 December 2008, pp. 117-122.
[25] C. Thillou and B. Gosselin, “Combination of Binarization
and Character Segmentation Using Color Information,” Proceedings of the Fourth IEEE International Symposium on Signal Processing and Information Technology, Mons, 18-21 December 2004, pp. 107-110.
doi:10.1109/ISSPIT.2004.1433699
[26] J. Gao, J. Yang, Y. Zhang and A. Waibel. “Text Detec- tion and Translation from Natural Scenes,” 2001. http://reports-archive.adm.cs.cmu.edu/anon/2001/abstract s/01-139.html
[27] J. Park, G. Lee, A.-N. Lai, E. Kim, J. Lim, S. Kim, H. Yang and S. Oh, “Automatic Detection and Recognition of Shop Name in Outdoor Signboard Images,” IEEE In-ternational Symposium on Signal Processing and Infor-mation Technology, Gwangju, 16-19 December 2008, pp. 111-116.doi:10.1109/ISSPIT.2008.4775652
[28] P. Berkhin, “Survey of Clustering Data Mining Tech- niques,” Technical Report, Accrue Software, 2002.
[29] O. D. Trier and T. Taxt, “Evaluation of Binarization Meth- ods for Document Images,” IEEE Transactions on Pat- tern Analysis and Machine Intelligence, Vol. 17, No. 3, 1995, pp. 312-315.doi:10.1109/34.368197
[30] S. A. Mingoti and J. O. Lima, “Comparing SOM Neural Network with Fuzzy c-Means, K-Means and Traditional Hierarchical Clustering Algorithms,” European Journal of Operational Research, Vol. 174, No. 3, 2006, pp. 1742- 1759.doi:10.1016/j.ejor.2005.03.039
[31] A. Canedo-Rodriguez, S. H. Kim, J. H. Kim and Y. Blanco- Fernandez, “English to Spanish Translation of Signboard Images from Mobile Phone Camera,” Southeast Confer-ence, Atlanta, 5-8 March 2009.
[32] M. Celenk, “A Color Clustering Technique for Image Seg- mentation,” Graphical Models Image Process, Vol. 52, No. 3, 1990, pp. 145-170.
[33] R. M. Haralick and L. G. Shapiro, “Image Segmentation Techniques,” Computer Vision Graphics Image Process, Vol. 29, No. 1, 1985, pp. 100-132.
doi:10.1016/S0734-189X(85)90153-7
[34] B. Schacter, L. Davis and A. Rosenfeld, “Scene Segmen- tation by Cluster Detection in Color Space,” University of Maryland, College Park, 1975.
[35] A. Sarabi and J. K. Aggarwal, “Segmentation of Chro- matic Images,” Pattern Recognition, Vol. 13, No. 6, 1981, pp. 417-427.doi:10.1016/0031-3203(81)90004-2
[36] M. Junker and R. Hoch, “On the eEvaluation of Docu- ment Analysis Components by Recall, Precision, and Ac- curacy,” Proceedings of the Fifth International Confer- ence on Document Analysis and Recognition, 1999, pp. 713-716.
[37] H.-K. Kim, “Efficient Automatic Text Location Method and Content-Based Indexing and Structuring of Video Database,” Journal of Visual Communication and Image Represent, Vol. 7, No. 4, 1996, pp. 336-344.
doi:10.1006/jvci.1996.0029
![Figure 4. Example of six different colors which theoretically produce the same gray value: the malized on the interval [0, 1] are: (a) RRGB and Y values nor- R = 1, G = 0.339, B = 0, producing Y = 0.5; (b) R = 1, G = 0.2458, B = 0.5, producing Y = 0.5; (c)](https://thumb-us.123doks.com/thumbv2/123dok_us/9281302.421455/6.595.324.524.81.167/figure-example-different-theoretically-malized-interval-producing-producing.webp)