Variations of Lake Ice Phenology on the Tibetan Plateau from 2001
1
to 2017 Based on MODIS Data
2
Yu Cai
1,2,3, Chang-Qing Ke
1,2,3,4,*, Xingong Li
5, Guoqing Zhang
6, Zheng Duan
7,
3
Hoonyol Lee
84
1. School of Geography and Ocean Science, Nanjing University, Nanjing, 210023, China 5
2. Jiangsu Provincial Key Laboratory of Geographic Information Science and Technology, 6
Nanjing University, Nanjing, 210023, China 7
3. Key Laboratory for Satellite Mapping Technology and Applications of State Administration 8
of Surveying, Mapping and Geoinformation of China, Nanjing University, Nanjing, 210023, 9
China 10
4. Collaborative Innovation Center of Novel Software Technology and Industrialization, 11
Nanjing, 210023, China 12
5. Department of Geography and Atmospheric Science, The University of Kansas, Lawrence, 13
KS 66045-7316, USA 14
6. Institute of Tibetan Plateau Research, Chinese Academy of Sciences, Beijing,100101, China 15
7. Technical University of Munich, Munich, 80333, Germany 16
8. Division of Geology and Geophysics, Kangwon National University, Chuncheon, Kangwon-17
do 24341, Republic of Korea 18
19
*Corresponding author: Chang-Qing Ke (C. Q. Ke, kecq@nju.edu.cn)
20 Tel: 0086-25-89685860 21 Fax: 0086-25-83592686 22 Key Points: 23
Lakes in the northern Inner Tibetan Plateau (Inner-TP) have longer ice cover durations 24
than those in the southern Inner-TP. 25
18 lakes have extending ice cover durations (avg. 1.11 d yr-1) and 40 lakes have 26
shortening durations (avg. 0.80 d yr-1). 27
Lake ice phenology is influenced by climatic conditions, geographical location, and the 28
Abstract 30
Lake ice is a robust indicator of climate change. The availability of information contained in 31
Moderate Resolution Imaging Spectroradiometer (MODIS) daily snow products from 2000 to 32
2017 could be greatly improved after cloud removal by gap filling. Thresholds based on open 33
water pixel numbers are used to extract the freeze-up start and break-up end dates for 58 lakes on 34
the Tibetan Plateau (TP), 18 lakes are also selected to extract the freeze-up end and break-up 35
start dates. The lake ice durations are further calculated based on freeze-up and break-up dates. 36
Lakes on the TP begin to freeze-up in late October and all the lakes start the ice cover period in 37
mid-January of the following year. In late March, some lakes begin to break-up, and all the lakes 38
end the ice cover period in early July. Generally, the lakes in the northern Inner-TP have earlier 39
freeze-up dates and later break-up dates (i.e. longer ice cover durations) than those in the 40
southern Inner-TP. Over 17 years, the mean ice cover duration of 58 lakes is 157.78 days, 18 41
(31%) lakes have a mean extending rate of 1.11 d yr-1 and 40 (69%) lakes have a mean 42
shortening rate of 0.80 d yr-1. Geographical location and climate conditions determine the spatial 43
heterogeneity of the lake ice phenology, especially the ones of break-up dates, while the physico-44
chemical characteristics mainly affect the freeze-up dates of the lake ice in this study. Ice cover 45
duration is affected by both climatic and lake specific physico-chemical factors, which can 46
reflect the climatic and environmental change for lakes on the TP. 47
Key Words: Lake ice phenology; Freeze-up/break-up dates; Climate change; MODIS; Tibetan 48
Plateau 49
50
51
1 Introduction 53
There are about 1200 lakes (>1 km2) on the Tibetan Plateau (TP) (Zhang, Yao, Xie, Zhang, 54
K., et al., 2014) and many studies have shown that lake ice phenology (i.e., the timing of freeze-55
up, break-up and duration of ice cover) responds well to climatic and environmental changes 56
(Brown & Duguay, 2010; Weber et al., 2016). As “the Third Pole of the Earth”, the TP is very 57
sensitive to global climate change (Liu & Chen, 2000; Qiu, 2008; Kang et al., 2010). Changes in 58
air and water surface temperatures related to climatic changes are important factors in the lake 59
ice phenology changes (Adrian et al., 2009; Zhang, Yao, Xie, Qin, et al., 2014; Dörnhöfer & 60
Oppelt, 2016; Yao et al., 2016). At the same time, the state and type of lake ice and their change 61
to open water system in turn affects the local or regional climate (Rouse et al., 2005; Brown & 62
Duguay, 2010). Freeze-up/break-up processes can result in sudden changes in lake surface 63
properties (such as albedo and roughness), which affect the energy exchange between the lake 64
water and the atmosphere (Latifovic & Pouliot, 2007). Therefore, in the context of global climate 65
change, lake ice phenology can be used as a good indicator to monitor the actual impact of 66
climate change on lakes and their surroundings (Ke et al., 2013). 67
However, due to the harsh environment and limited accessibility, few meteorological 68
stations exist in the central and western TP, which is where lakes are concentrated; thus, it is 69
difficult to carry out field observations. These factors result in a lack of continuous and complete 70
historical records on regional climate changes (Liu & Chen, 2000; Kropacek et al., 2013). 71
Remote sensing data have been widely used in lake ice monitoring (Wei & Ye, 2010; Duguay et 72
al., 2015). Passive microwave sensors such as the Scanning Multichannel Microwave 73
Radiometer (SMMR), the Special Sensor Microwave/Image (SSM/I), and the Advanced 74
temporal resolutions (at times twice daily or better) and are suitable for monitoring lake ice 76
changes in large lakes, such as Qinghai Lake (Che et al., 2009; Cai et al, 2017) and Nam Co (Ke 77
et al, 2013) on the TP, and Great Bear Lake and Great Slave Lake (Howell et al., 2009) in 78
Canada. However, there are still many medium- and small-size lakes on the TP, which are 79
smaller than the pixel size of passive microwave images (dozens to hundreds of km2). Active 80
microwave sensors have high spatial resolutions (1 m to about 100 m). For example, the 81
European Remote Sensing Satellite (ERS)-1/2 Synthetic Aperture Radar (SAR) has been used 82
for monitoring the lake ice formation process and ice thickness (Jeffries et al., 1994; Morris et 83
al., 1995; Duguay & Lafleur, 2003). Radarsat-1/2 SAR has also been used for monitoring the 84
freeze-up/break-up processes of lake ice (Duguay et al., 2002; Geldsetzer et al., 2010). However, 85
the low temporal resolution (five to six days) of the available active microwave technologies 86
limits the ability to achieve daily monitoring on lake ice (Latifovic & Pouliot, 2007; Chaouch et 87
al., 2014). The medium- and high-resolution optical data, such as Moderate Resolution Imaging 88
Spectroradiometer (MODIS) and Advanced Very High Resolution Radiometer (AVHRR) obtain 89
daily images and are often used to monitor lake freeze-up/break-up dates and areas. For example, 90
Weber et al. (2016) used AVHRR data to extract the ice phenology of European lakes in 91
different climatic regions. Yao et al. (2016) used MODIS and Landsat data to extract the ice 92
phenology of 22 lakes in the Hoh Xil region from 2000 to 2011 and analyzed the factors 93
influencing lake ice changes. Chaouch et al. (2014) used MODIS data to monitor the growth and 94
regression of ice in the Susquehanna River in the northeastern USA. However, optical images are 95
obscured by clouds, which limits the direct usage of optical data (Gafurov & Bárdossy, 2009). 96
Currently, there have been many mature cloud removal methods, including methods based on 97
Burgos et al., 2013) and methods combining multiple sensor data (Liang et al., 2008; Gao, Xie, 99
Lu, et al., 2010; Gao, Xie, Yao, et al., 2010), which can reduce cloud cover and increase data 100
availability by gap filling approaches and compositing. 101
The unique geographical and climatic conditions of the TP make it a region of high interest 102
for climate research (Kang et al., 2010). Owing to the low annual air temperature, many lakes on 103
the TP have long and stable ice cover periods during winter. Recent studies on individual lakes 104
have shown that on the TP, the freeze-up dates of some lakes have been delayed, the break-up 105
dates have advanced, and the ice cover durations have significantly shortened (Che et al., 2009; 106
Ke et al., 2013; Cai et al., 2017). However, there are few ice phenology studies covering the 107
entire TP. Guo et al. (2018) used MODIS reflectance data, eight-day synthetic snow product and 108
land surface temperature data to analysis the uncertainty and variation of different remotely 109
sensed lake ice phenology across the TP. Kropáček et al. (2013) used MODIS eight-day 110
synthetic snow products to analyze the ice phenology changes of 59 large lakes on the TP from 111
2001 to 2010. However, the eight-day interval could not capture the lake ice phenology very 112
precisely, especially for the start and end dates of freeze-up and break-up. To date, no one has 113
used MODIS daily snow products to study the lake ice phenology on the TP. 114
To obtain the lake ice phenology variations on the TP, the daily snow products of MODIS 115
are used to extract the freeze-up and break-up dates of lake-wide ice cover from 2001 to 2017. 116
The lake ice durations are then calculated, and the spatial variabilities and change rates of lake 117
ice phenology are analyzed. Using reanalysis data and available satellite data set, the effects of 118
air temperature, lake surface water temperature, and wind speed on lake ice phenology are 119
analyzed. In addition, possible influence of geographical determined lake locations and physico-120
2 Study area 122
The TP is located in central Asia; it is the largest plateau in China, and its elevation is the 123
highest in the world. The TP is known as the “roof of the world” and “the Third Pole of the 124
Earth”, with an average elevation of over 4,000 m a.s.l and a total area of approximately 3.0 125
million km2 (Qiu, 2008; Zhang et al., 2013). There are about 1,200 lakes (>1 km2) on the TP 126
with a total size of 47,000 km2, which accounts for more than 50% of the total size of Chinese
127
lakes (Zhang, Yao, Xie, Zhang, K., et al., 2014), in which 389 lakes have an area larger than 10 128
km2, including three lakes larger than 1,000 km2: Qinghai Lake (4,254.9 km2), Selin Co 129
(2,129.02 km2) and Nam Co (2,040.9 km2) (Wan et al., 2014). 130
By analyzing the change of ice coverage for each lake using MODIS daily snow products, 131
58 lakes with a stable ice cover period (less cloud cover, less pixel misclassification and obvious 132
ice cover period) are manually selected as study lakes (Figure 1), including three lakes larger 133
than 1,000 km2, 35 lakes larger than 100 km2 and 20 lakes smaller than 100 km2, in which the 134
smallest lake is Xuemei Lake (41.33 km2, Wan et al., 2014). Most lakes (>70%) are in the Inner 135
basin (Zhang et al., 2013). To analyze the spatial variability of lake ice phenology, the Inner 136
basin is divided into upper and lower parts (Inner Ⅰ and Inner Ⅱ, northern and southern parts of 137
about 33°N) (Zhang et al., 2013), and lakes outside the Inner basin are classified as Other Ⅲ 138
(Figure 1). The lake masks used were extracted from Landsat images (Wan et al., 2014) and all 139
data sets involved in the extraction and comparisons are clipped by the same lake mask. An 140
annual period extends from 1 August to 31 July of the following year, for example, 1 August 141
3 Data and methods 143
3.1 Data
144
3.1.1 MODIS daily snow cover products
145
MODIS is mounted on the Terra and Aqua satellites, which obtain global observation data 146
every one or two days. The available daily snow cover products with a spatial resolution of 500 147
m from MODIS include MOD10A1 (Terra) and MYD10A1 (Aqua). The available temporal 148
range of MOD10A1 is from 1 August 2000 to 31 July 2017 and that of MYD10A1 is from 1 149
August 2002 to 31 July 2017. Four MODIS tiles (h24v05, h25v05, h25v06 and h26v05) cover 150
the 58 lakes of this study. The data were obtained from the US National Snow and Ice Data 151
Center (http://nsidc.org/, Version 5 for 2001-2016 and Version 6 for 2017) on 8 September 2017. 152
The accuracy of the daily snow cover products of MODIS are approximately 93% under 153
clear sky conditions (Maurer et al., 2003; Parajka & Blöschl, 2006; Hall & Riggs, 2007; Sorman 154
et al., 2007; Huang et al., 2011). However, the daily snow cover products over the TP have a 155
yearly average cloud cover (>40%) from MODIS observations (Yu et al., 2016), and need to be 156
processed for cloud removal by gap filling. Some lakes may have snow covering the ice surface 157
during the ice cover period, and MODIS snow cover products could classify these ice covered 158
pixels into snow covered pixels, which results in a low lake ice cover compared to the lake size 159
(Kropacek et al., 2013). Therefore, the changes of lake water cover proportions (the number of 160
lake water pixels divided by the total number of pixels within the lake boundary) are used to 161
extract the freeze-up/break-up dates, and the lake ice cover proportions are used to assist in 162
correcting the date results. Under clear sky conditions, the reduction in water cover is considered 163
3.1.2 Landsat data
165
The Landsat program is a series of Earth observing satellites, which is co-managed by the 166
National Aeronautics and Space Administration (NASA) and the United States Geological 167
Survey (USGS) to monitor earth and environmental resources. Since 23 July 1972, eight 168
satellites have been launched including Landsat Multispectral Scanner (MSS, ~80 m) and 169
Thematic Mapper (TM, 30m)/Enhanced Thematic Mapper Plus (ETM+, 30m)/Operational Land 170
Imager (OLI, 30 m) with a temporal resolution of 16 days. Landsat data used are from the 171
standard USGS Landsat Surface Reflectance products (Collection 1 Level-2) of Landsat 5, 7 and 172
8 from 2000 to 2017 on the Google Earth Engine platform (https://earthengine.google.com/). 173
Images without cloud cover and obtained during the freeze-up or break-up periods are selected to 174
extract the lake water cover proportions. 175
To extract lake ice, pixels covering a lake need to be first distinguished from other types of 176
pixels, such as cloud and land. A threshold of 0.4 for Normalized Difference Snow Index (NDSI) 177
(Hall et al., 2001) is applied to extract the extent of a lake as follows: 178
NDSI = (TM Band 2 – TM Band 5) / (TM Band 2 + TM Band 5) ≥ 0.4 (1)
179
Then, according to the actual reflectance of each image, different thresholds on the near-180
infrared band are set to distinguish lake ice from lake water. Finally, the proportion of lake water 181
within a lake boundary (1 – ice cover proportion) is calculated and compared with MODIS 182
results on the same day to verify the accuracy of using MODIS snow cover products after cloud 183
3.1.3 Lake ice phenology products from AMSR-E/2 data
185
The daily lake ice phenology time series derived from AMSR-E and AMSR2 by Du et al. 186
(2017) provide 5 km ice phenology retrievals describing daily lake ice conditions over the 187
Northern Hemisphere (http://files.ntsg.umt.edu/data/AMSRE2_LAKE_ICE_PHEN/). The date 188
set is used for lake-wide comparisons against MODIS data results from 2003 to 2011 and from 189
2013 to 2015. Pixels within the lake boundary are extracted for eight lakes larger than 500 km2.
190
Considering the differences between passive microwave and optical data and the difference in 191
data productions, when the number of ice-on pixels count for more than 10% of all pixels in the 192
lake, the date is determined to be freeze-up start date, and less than 10% is break-up end date. 193
3.1.4 Reanalysis meteorological data
194
The NCEP/NCAR reanalysis data set is a joint product from the National Centers for 195
Environment Prediction (NCEP) and the National Center for Atmospheric Research (NCAR, 196
https://www.esrl.noaa.gov/). This data set provides reanalysis meteorological data every six 197
hours including air temperature, air pressure, relative humidity, and wind speed at a spatial 198
resolution of 2.5° from 1 January 1948 to present. The monthly mean data of near surface air 199
temperature and wind speed are used. 200
To match the annual ice period, the annual mean air temperature and wind speed are 201
calculated from August of the current year to July of the following year. Then, the change rates 202
of air temperature and wind speed from 2001 to 2017 are calculated. Finally, the inverse distance 203
weighted (IDW) method is used to interpolate and calculate the means and change rates of air 204
3.2 Methods
206
3.2.1 Cloud removal for the MODIS snow product
207
The cloud removal (gap filling) process has two steps. The first step is to combine daily 208
Terra and Aqua snow cover products to determine lake cover type (Gafurov & Bárdossy, 2009). 209
For a pixel A, if any of the pixels on Terra or Aqua images for the same day is open water (or 210
other useful pixel types such as ice and snow, the same below), the pixel on the output image is 211
determined to be covered by water. When the pixel is covered with clouds (or other useless types 212
such as land and missing data, the same below) on both Terra and Aqua images, the output pixel 213
is determined to be cloud covered (Gafurov & Bárdossy, 2009): 214
S(A, output) = water if S(A, Aqua) = water OR S(A, Terra) = water (2)
215
S(A, output) = cloud if S(A, Aqua) = cloud AND S(A, Terra) = cloud (3)
216
Since Aqua satellite was launched in 2002, there is no first step data process for the 2001-217
2002 period. The images from step one are used as the inputs for the following step. The second 218
step is based on the temporal correlation of cloud cover pixels (Gafurov & Bárdossy, 2009). 219
First, if a pixel A on date t is cloud covered, the pixels on the images of previous and next days 220
will be searched, and if both pixels are water covered, pixel on date t is determined to be covered 221
by water as follows (Gafurov & Bárdossy, 2009): 222
S(A, t) = water if S(A, t-1) = water AND S(A, t+1) = water (4)
223
If pixel A on date t-1 is cloud covered, then the pixel on date t-2 will be searched, and if 224
both pixels on date t-2 and date t+1 are water covered, the pixels on date t and t-1 will be 225
replaced by water. Similarly, if the pixel on date t+1 is cloud covered, the pixel on date t+2 will 226
S(A, t-1), S(A, t) = water if S(A, t-2) = water AND S(A, t+1) = water (5)
228
S(A, t), S(A, t+1) = water if S(A, t-1) = water AND S(A, t+2) = water
229
(6) 230
3.2.2 Extraction of freeze-up/break-up dates
231
Often, there will be an unfrozen area near a lake’s outlet during the freeze-up period, and a 232
small amount of accumulated lake ice on the lakeshore during the break-up process (Reed et al., 233
2009; Yao et al., 2016). In addition, repeated freeze-up and break-up periods caused by weather 234
changes, mismatch of lake boundaries, misclassification of pixels and inevitable noise 235
(especially cloud cover) will all change the extraction of lake ice phenology. Therefore, 236
Kropacek et al. (2013) proposed using 5% and 95% of the lake area as thresholds to extract ice 237
phenology instead of 0% and 100%. Simultaneously, images with a cloud cover of more than 50% 238
over a lake after gap filling are eliminated to reduce the influence from sudden changes in water 239
cover. 240
First, a median M of all the lake water cover proportions in a year is calculated. Then, all 241
the water cover proportions are divided into two groups: one group (Gh) contains the values
242
greater than M, and the other group (Gl) contains the values less than M, and the mean values of
243
both groups are calculated. Two thresholds are determined by using the 5% and 95% of the two 244
mean values as follows (Kropacek et al., 2013): 245
Thh = 95% ∙ Mh + 5% ∙ Ml (7)
246
Thl = 5% ∙ Mh + 95% ∙ Ml (8)
247
Where Mh and Ml are the mean values of group Gh and Gl, respectively. Since the
freeze-248
up/break-up processes of lakes are usually short, Mh can represent the typical proportion of a lake
covered by water during the non-ice cover period, and Ml can represent the typical water cover
250
proportion during ice cover period (Kropacek et al., 2013). The dates when the water cover will 251
no longer raise above the thresholds (Thh for freeze-up start date and Thl for freeze-up end date)
252
again during the freeze-up period and will no longer drop below the thresholds (Thl for break-up
253
start date and Thh for break-up end date) during the break-up period are extracted as the ideal
254
lake ice phenology dates. Sometimes the remained cloud cover (or other useless pixels) will 255
decrease the water cover (even smaller than the thresholds). Therefore, after the automatic 256
extraction, the extracted dates need to be checked again by visual interpretation of the complete 257
water, ice and cloud cover changes within a year (Figure 2). 258
The four freeze-up/break-up dates divide the annual status of a lake into four periods and 259
the corresponding durations can be calculated: freeze-up duration (FUD, from freeze-up start to 260
freeze-up end), break-up duration (BUD, from break-up start to break-up end), complete freezing 261
duration (CFD, from up end to break-up start) and ice cover duration (ICD, from freeze-262
up start to break-up end). 263
3.2.3 Statistical analysis
264
The mean absolute error (MAE), correction of determination (R2) and bias are measured
265
for comparisons between the MODIS cloud-removed and Landsat data as well as comparisons 266
between ice phenology results derived from MODIS and passive microwave data sets. Trend 267
significances of lake ice dates and durations are evaluated using the non-parametric Mann-268
Kendall test (Mann, 1945; Kendall, 1975). Furthermore, the relationships between lake ice 269
phenology parameters and climate conditions are evaluated using the coefficient of correlation 270
4 Results 272
4.1 Cloud removal of MODIS snow cover products and validation using Landsat data
273
4.1.1 Cloud removal by gap filling
274
Taking the year 2013 as an example, before gap filling, the mean cloud cover of the 58 275
lakes is 44.97% and 51.70%, respectively, for Terra and Aqua. After the first step of combining 276
the data from two satellites, the cloud cover is eliminated to 31.02%. After the second step of 277
using pixels in neighboring dates, the mean cloud cover is eliminated to 16.54%. Taiyang Lake 278
has a mean cloud cover of more than 60%, which is the highest among 58 lakes, and it is 279
eliminated to 35.49% after the cloud removal. For some lakes, the cloud cover can even be 280
eliminated to less than 5% after cloud removal (Table 1). For example, the mean cloud cover of 281
Qinghai Lake in 2013 after cloud removal is 7.54%, and the freeze-up/break-up dates can be 282
clearly distinguished (Figure 2). 283
4.1.2 Validation
284
For some large lakes, such as Qinghai Lake, Landsat images cannot cover the entire lake on 285
the same day and images acquired from different days cannot be mosaiced to extract the lake ice. 286
Often, the freeze-up/break-up period of a lake is only a dozen of days, which is usually not 287
captured by Landsat images due to the 16-day temporal resolution. In addition, considering the 288
influence of cloud cover, there are indeed few available Landsat images. Therefore, lakes which 289
can be covered by one Landsat image and those with relatively long freeze-up/break-up period 290
are preferably selected for validation. 291
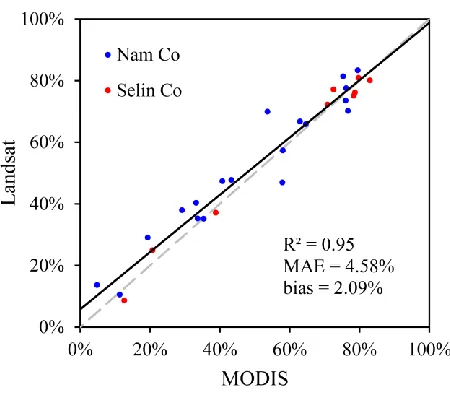
A total of 28 Landsat images covering Nam Co (19 images) and Selin Co (9 images) during 292
are calculated for each image and compared with the water cover proportions from the cloud 294
removed MODIS data. The R2 is 0.95, the mean absolute error (MAE) is 4.58% and the bias is 295
2.09% (Figure 3), indicating a relatively high accuracy and MODIS data can be used to detect 296
lake water changes well after cloud removal. 297
4.2. Comparisons against other lake ice data sets
298
Daily passive microwave brightness temperature data, including AMSR-E/2 and SSM/I, are 299
used for cross-validation with MODIS lake ice phenology results. The freeze-up start and break-300
up end dates of eight lakes (larger than 500 km2) derived from AMSR-E/2 pixel-level lake ice 301
phenology products (Du et al., 2017) from 2003 to 2015 (except 2012) are compared with 302
corresponding MODIS dates and the results are shown in Table 2. The break-up end dates from 303
two data sets are strongly correlated (avg. R2 = 0.90) but the freeze-up start dates have relatively
304
low consistency (avg. R2 = 0.35). Generally, MODIS dates are earlier than AMSR dates, but vary 305
from lake to lake (Table 2). The MAEs of freeze-up start dates range for eight lakes from 2.92 to 306
7.25 days and break-up end dates range from 1.75 to 3.25 days. 307
Furthermore, ice phenology data for Qinghai Lake (from 2001 to 2016, Cai et al., 2017) and 308
Nam Co (from 2001 to 2013, Ke et al., 2013) derived from SSM/I data are also compared with 309
MODIS results. The correlations of freeze-up start and break-up end dates for Nam Co are low 310
(R2 = 0.42 and 0.35, respectively) and the MAEs are both over six days (Table 2). The freeze-up 311
start date from MODIS data is obviously earlier than SSM/I data (bias = -5.28 days), this may be 312
because Nam Co only covered by two SSM/I pixels and less information can be provided. On the 313
other hand, Qinghai Lake provided four freeze-up/break-up dates for comparison against MODIS 314
data. Similar to AMSR results, the consistency of freeze-up dates are lower than break-up dates 315
passive microwave data (both SSM/I and AMSR) while break-up dates are later (Figure 4), this 317
may be because of the coarser spatial resolution and less information near the boundary of 318
passive microwave data (Cai et al., 2017). The MAE of freeze-up end date is the largest (6.56 319
days) and the MAEs of break-up dates are about two days (Figure 4). These results indicate that 320
the influence from different remote sensing data and different data production processes on 321
freeze-up dates may be larger than that on break-up dates. It is similar to the results of Du et al. 322
(2017) when he compared AMSR lake ice phenology results against Canadian Ice Service (CIS) 323
and IMS data. 324
4.3. Ice phenology and its change of the lakes on the TP from 2001 to 2017
325
For each of 58 lakes, freeze-up start and break-up end dates are extracted, and their 326
corresponding ice cover durations are calculated. Some lakes do not freeze-up completely in 327
winter due to mild winters, large water volume and/or high salinity (Kropacek et al., 2013), and 328
some lakes are obscured by cloud and/or misclassified pixels during ice cover period. Apart for 329
these lakes, for 18 lakes with characteristic change of water cover proportions, the freeze-up end 330
and break-up start dates are also extracted, and four lake ice durations (i.e., freeze-up duration, 331
break-up duration, complete freezing duration and ice cover duration) are calculated, such as Har 332
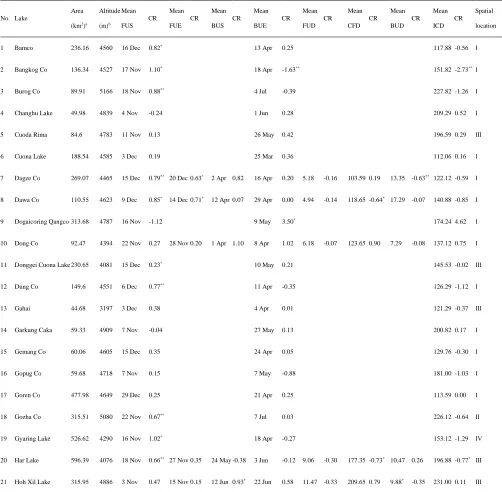
Lake in Figure 5. Based on the four freeze-up/break-up dates and four durations from 2001 to 333
2017, their mean values and change rates of ice phenology for the 58 lakes are shown in 334
Appendix Table A1. Additional statistics are shown in Appendix Table B1 and Table 3. 335
4.3.1 Freeze-up/break-up dates
336
Around late October, Yuye Lake has begun to freeze-up, which is the earliest among 58 337
on the TP have started their ice cover periods. The gap between freeze-up start dates among the 339
lakes can be as long as three months. From late March to early July, the lakes have ended their 340
ice period one after another, and the earliest and latest lakes are Tuosu Lake and Gozha Co, 341
respectively. Generally, the spatial difference in the freeze-up dates are smaller than the break-up 342
dates (Table B1). The mean freeze-up start date for the lakes in the Inner Ⅰ is 32.68 days earlier 343
than that of the lakes in the Inner Ⅱ, while the mean break-up end date in the Inner Ⅰ is 43.56 344
days later than that in the Inner Ⅱ (Figure 6, Table 3). 345
Freeze-up/break-up dates for many lakes on the TP have obvious change tendencies from 346
2001 to 2017 (Table A1). For example, the freeze-up start and freeze-up end dates for Har Lake 347
have been delayed at a rate of 0.66 d yr-1 and 0.35 d yr-1, respectively, and the break-up start and 348
break-up end dates have advanced at rates of 0.38 d yr-1 and 0.12 d yr-1, respectively (Figure 5).
349
Overall, the change rates of freeze-up dates for most lakes are more significant than the break-up 350
dates (Table A1). Except for a few lakes in the eastern Inner Ⅰ which have advancing trends in 351
the freeze-up dates, most of the lakes (81.03%) show delayed trends from 2001 to 2017. All the 352
lakes in the Inner Ⅱ have delayed trends during the 17 years (Figure 6b, Table 3). Among the 58 353
lakes, the lakes with delayed and advancing trends of break-up dates are both 50% (Table 3). 354
Spatially, the delayed trend is more pronounced than the advancing trend (Figure 6d). Lakes in 355
the Inner Ⅰ, such as Dogaicoring Qangco and Lexiewudan Co (change rates of the break-up end 356
dates are 3.50 d yr-1 and 4.25 d yr-1, respectively, Table A1), experienced the most dramatic 357
changes (Figure 6d). During the 17 years, 60.34% of the lakes show an opposite change trend of 358
freeze-up and break-up dates, and another 36.21% of the lakes show the same delayed change 359
trend. Only Huolunuo’er and Meiriqiecuomari have the same advancing trend of freeze-up and 360
4.3.2 Lake ice durations
362
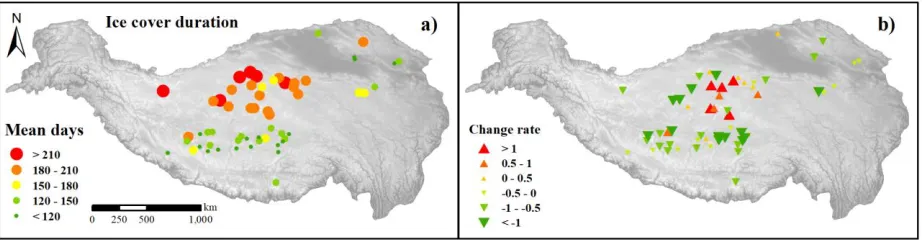
Lake ice cover durations on the TP differ greatly, where the duration of the shortest lake 363
(Taro Co) is less than three months, and that of the longest lake (Xuemei Lake) is approximately 364
eight months (Table B1). The spatial distribution of the ice cover duration is consistent with that 365
of the freeze-up/break-up dates: the lakes in the Inner Ⅱ with later freeze-up and earlier break-up 366
have shorter ice cover durations, and the lakes in the Inner Ⅰ with earlier freeze-up and later 367
break-up have longer ice cover durations (Figure 7a), which is 2 months longer on average than 368
those of the Inner Ⅱ (Table 3). Among the 18 lakes extracted complete four freeze-up/break-up 369
dates, most lakes (72.2%) have shorter up durations than break-up durations, i.e., freeze-370
up takes place faster than break-up does (Table A1). However, the variations in freeze-up 371
durations among the lakes is larger than that in break-up durations (Table B1). Among the 18 372
lakes, Hoh Xil Lake has the earliest freeze-up end date and the latest break-up start date; thus, 373
the longest complete freezing duration is up to seven months. Qinghai Lake has the shortest 374
complete freezing duration of less than three months (Table B1). 375
Over the 17 years, most of the lakes (68.97%) display a shortening trend in ice cover 376
duration. For example, Har Lake has a shortening trend of 0.77 d yr-1 (Figure 5d). Lakes with
377
extending trends are mainly concentrated in the eastern part of the Inner Ⅰ (Figure 7b). Since all 378
the lakes in the Inner Ⅱ have delayed trends of freeze-up start dates, most lakes (87.50%) have 379
their ice cover durations shortened. Similar to freeze-up/break-up dates, half of the lakes in the 380
Inner Ⅰ have shortening ice cover durations and the other half have extending durations (Table 3). 381
The trends of complete freezing duration for the 18 lakes are mainly consistent with the trends of 382
ice cover duration. Lakes such as Hoh Xil Lake and Tu Co have a shortening freeze-up and 383
and Ngangze Co have shortening trends of ice cover duration, their shortening freeze-up and 385
break-up duration results in an extending trend of complete freezing duration. 77.78% of the 386
lakes show the same trend in freeze-up and break-up durations (Table A1). There are several 387
lakes, such as Har Lake, which have shortening freeze-up durations and extending break-up 388
durations (Figure 5c). The freeze-up and break-up durations of most lakes (both 72.2%) have 389
shortened over 17 years, which indicates that freeze-up/break-up takes place faster (Table A1). 390
5 Discussions 391
5.1 Uncertainty analysis
392
Errors in the extraction of the ice phenology from MODIS snow cover products mainly 393
come from three aspects: (1) The MODIS snow cover products have cloud cover, 394
misclassification and occasional missing data; (2) changes to the original data caused by cloud 395
removal; and (3) misjudgment when extracting the lake ice phenology dates. While the quality of 396
MODIS snow cover products cannot be changed, the proportion of usable pixels can be 397
increased by removing some of the cloud cover by gap filling. Combining Terra and Aqua data 398
can solve the problem of missing dates, and combined with the temporal information of cloud 399
(noise) covered pixels, about two-thirds of the cloud and other noise pixels can be eliminated. 400
Cloud cover could reflect most of the solar radiation, so the cloud cover in a short period of time 401
would not have much impact on lake surface coverage (Gafurov & Bárdossy, 2009). Possible 402
increased lake ice caused by snowfall during cloudy days (or low temperature at night) are 403
ignored if they break-up on the following sunny day (or in the daytime). According to the study 404
of Gafurov and Bárdossy (2009), the performance accuracy of the gap filling approach is more 405
removal process only considers the temporal information one to two days before and after the 407
current day, and the potential error can be controlled within two days. Although the possible 408
error in the gap filling process is minimized, the remained and persistent (longer than two days) 409
cloud cover will still influence the extraction of ice phenology dates. 410
The remained cloud cover (or other useless pixels) will decrease the lake water/ice cover of 411
the day, and sometimes the automatic extraction method may obtain a wrong date. However, 412
these mistakes can be modified by later manual correction of comparing the complete 413
water/ice/cloud curves of that year. Using thresholds can control the difficulty caused by 414
repeated freeze-up and break-up of lake ice and ensure the consistency of the freeze-up/break-up 415
date extractions. For example, there were several periods of repeated freeze-up and break-up at 416
the start of the break-up process in Qinghai Lake in 2013. It is difficult to determine which 417
break-up date should be extracted without using a threshold. Though the extracted date seems 418
like a wrong date, the ice cover has definitely dropped after that day, so the date is determined to 419
be the break-up date of that year (Figure 2). Although some dates will be checked and modified 420
after automatic extraction, the alternative dates are all selected by the thresholds. Considering the 421
existence of noise, the thresholds are set to 5% and 95% instead of the extreme values. This 422
approach may cause the later extraction of the freeze-up start and break-up start dates, and earlier 423
of the freeze-up end and break-up end dates. But without available validation data, the actual 424
error cannot be accurately evaluated. However, the same rule is applied to all the lakes and in all 425
the years, which makes the comparisons between lakes and years possible. 426
The persistent cloud cover is difficult to be eliminated. But similarly, without surface 427
observation data, the errors cannot be accurately evaluated. It seems some lakes have the feature 428
much noise or complex shape (for example, Bangong Co is long and narrow and Yamzho 430
Yumco is tentacle-like) that cannot guarantee the reasonable dates has already been excluded in 431
the lake selection period. Furthermore, some lakes have persistent cloud cover after they begin to 432
freeze-up, it is probably caused by misclassification of ice to cloud. If the cloud cover influences 433
the extraction of the freeze-up end and/or break-up start date, the dates will not be extracted. 434
Only lakes with clear curves of water/ice changes are chosen in order to obtain more accurate 435
dates, even if the cost is that the number of the study lakes will be reduced. 436
Kropáček et al. (2013) extracted the lake ice phenology of 59 large lakes on the TP from 437
2001 to 2010 using MODIS eight-day synthetic snow products. The lakes were divided into three 438
groups, among which the lakes in Group C were almost all located in the Inner Ⅱ. The mean ice 439
cover duration of lakes in Group C was 126 days with a shortening trend of 1.6 d yr-1, while the
440
mean ice cover duration of lakes in the Inner Ⅱ in this study is 128 days from 2001 to 2017, and 441
the mean change rate of 21 lakes is -0.89 d yr-1. The two mean ice cover durations are similar, 442
the change trends are consistent, and the lower rate in this study may be caused by gentler 443
change in recent years. Yao et al. (2016) used MODIS and Landsat data to study lake ice 444
phenology in the Hoh Xil region from 2000 to 2011. Their mean ice cover duration was 196 days 445
with a mean change rate of -1.91 d yr-1. The Hoh Xil region is in central Inner Ⅰ, and the lakes 446
analyzed in their study include Dogaicoring Qangco, Taiyang Lake, Hoh Xil Lake, Lexiewudan 447
Co, and Margai Caka. This is the region where lake ice phenology has changed drastically in 448
recent years within the TP (Figure 6). Consistent with the results of this study, Dogaicoring 449
Qangco and Lexiewudan Co are the rare lakes in this region with advancing freeze-up dates and 450
delayed break-up dates, and the reason for these changes will be discussed in the following 451
been delayed over 17 years, which is different from an advancing break-up end date in Yao et al. 453
(2016). From 2000 to 2011, the break-up end date of Taiyang Lake did show an advancing trend 454
with a rate of 1.51 d yr-1. However, since 2010, the break-up end date has been delayed annually 455
with a change rate of 3.23 d yr-1 until 2017, which results in an overall delayed trend from 2001
456
to 2017. Furthermore, many studies have shown that some large lakes on the TP such as Qinghai 457
Lake and Nam Co show a significant delayed trend in freeze-up dates and an advancing trend in 458
break-up dates, and the ice cover durations have shortened in recent years (Che et al., 2009; Ke 459
et al., 2013; Cai et al., 2017), which is consistent with the results of this study. 460
5.2. Influencing factors on lake ice phenology
461
5.2.1. Climatic factors
462
The low spatial resolution of the reanalysis data makes it difficult to ensure that the IDW-463
interpolated air temperature/wind speed can represent the actual local situation for each single 464
lake. However, the large-scale spatial distribution of meteorological factors and the change rates 465
of the lakes over 17 years on the TP can be obtained from the data. In addition, available lake 466
water surface temperature (LWST) data for 57 lakes (except for Youbucuo Lake in the Inner Ⅱ) 467
from 2002 to 2015 derived from MODIS Land Surface Temperature (LST) products by Wan et 468
al. (2017) are used. 469
Compared to the Inner Ⅱ, the Inner Ⅰ has a lower mean annual air temperature, LSWT and 470
wind speed from 2001 to 2017 (Table 4). Under relatively cold conditions with low wind speed, 471
lakes in the Inner Ⅰ have earlier freeze-up dates, later break-up dates and longer ice cover 472
durations than do lakes in the Inner Ⅱ. There are significant correlations between the ice 473
with a confidence level of 0.01 (Figure 8). It is probably because the climate factors differ with 475
different lake surroundings (latitude, altitude, etc.) naturally (Guo et al. 2018). 476
The mean air temperature, LSWT and wind speed for each of the study lakes are calculated. 477
For every 1℃ increase in air temperature or LSWT or 1 m s-1 increase in wind speed, the ice
478
cover duration is shortened by 13.75 days, 18.87 days and 29.81 days, respectively (Table 5). 479
LSWT has the highest correlation with lake ice phenology among the three climatic factors 480
(Figure 8, Table 5) (Bussieres et al., 2002). In addition, climate variability and changes have 481
greater effects on lake break-up dates than freeze-up dates (Figure 8, Table 5) (Palecki & Barry, 482
1986). 483
The energy available for water freeze-up in a lake is affected by the heat exchange with the 484
atmosphere, heat stored in the water body, and inflows of water (Williams, 1965). The heat 485
exchange with the atmosphere is mainly determined by climatic factors such as air/water 486
temperature, wind and solar radiation, while heat storage in a lake is determined additionally by 487
lake morphometry (Williams, 1965; Brown & Duguay, 2010), which will be discussed in the 488
next section. The ice break-up is affected by heat gain from the atmosphere, solar radiation, snow 489
and ice conditions, wind and currents, and inflows (Williams, 1965). Air and water temperature 490
directly drives the lake heat balance and thus plays the main role in the ice cover regime 491
(Kouraev et al., 2007), but the influence of wind is more complex. On the one hand, wind will 492
bring cold or warm currents, which affect the water surface temperature, and on the other hand, 493
the dynamic effects of wind could break the thin ice (Kouraev et al., 2007; Brown & Duguay, 494
2010). However, without detailed field observations, it is difficult to discuss the detailed effects 495
5.2.2. Lake location, physico-chemical conditions and other factors
497
To control the differences in climate conditions, the correlations between lake ice 498
phenology and lake altitude, area, and mineralization are calculated separately for the Inner Ⅰ and 499
Inner Ⅱ. Some of these lakes have no historical records of mineralization; thus, only the salt 500
lakes with mineralization data are used (Table 6). 501
There is a significant positive correlation between the altitudes and break-up end dates of 502
the lakes in the Inner basin. The higher the altitude, the later the break-up end date and the longer 503
the ice cover duration. There is an obvious autocorrelation between the altitude and climatic 504
conditions that together affect the break-up time of the lakes, while the freeze-up time is mainly 505
affected by the physical and chemical characteristics of the lakes (Adrian et al., 2009; Yao et al., 506
2016). 507
Lakes with larger areas have more water-storage capacity and a stronger dynamic effect, 508
resulting in a longer freeze-up duration (Yao et al., 2016). Furthermore, wind can break up the 509
initial ice cover more easily (Kouraev et al., 2007; Brown & Duguay, 2010). Lakes with long 510
freeze-up durations in the Inner basin such as Qinghai Lake, Selin Co and Ngangla Ringco are 511
all lakes with areas larger than 500 km2 (Table A1). In theory, lakes with higher mineralizations
512
should have a lower ice point, as well as a later freeze-up date, earlier break-up date and shorter 513
ice cover duration (Yao et al., 2016). Lakes, such as Selin Co, Nam Co, and Tu Co, with large 514
areas but low mineralization may affect the results of the correlation analysis (Table 6). In this 515
case, lake size has a greater impact on the ice phenology than does the mineralization. At the 516
same time, currently available mineralization records are from the 1970s to 1990s (Wang & Dou, 517
1998). In the context of climate change, the mineralization of lakes on the TP may have changed 518
to an increase in mineralization and the expansion of the lake area may lead to a desalination of 520
water. 521
Lexiewudan Co, which has the highest change rate of ice phonology over the 17 years, had 522
a mineralization of 135.50 g L-1 in 1990 (Wang & Dou, 1998) and dropped to 89.47 g L-1 in 2010
523
(He et al., 2015). The lake came through an obvious process of desalination. Apart from this, the 524
lake is recharged with ice-snow meltwater and large amounts of spring water (Wang & Dou, 525
1998). The special recharge form may also be one of the reasons that caused the large change in 526
ice phenology. In addition, Dogaicoring Qangco may have similar reasons for the large changes 527
in recent years, as the lake is nearby Lexiewudan Co and has similar conditions as Lexiewudan 528
Co. 529
Shallow lakes require less heat to freeze-up and have earlier freeze-up dates (Kropacek et 530
al., 2013; Yao et al., 2016). The physical characteristics determine the thermodynamics of a lake 531
and sometimes have more of an impact on the ice phenology than do the chemical conditions. 532
For example, the weather conditions of Gahai and Qinghai Lake are similar, and the freeze-up 533
dates are nearly on the same day. As one of the remaining sub-lakes of Qinghai Lake, Gahai has 534
no surface inflow and a smaller area (Gahai: 44.68 km2, Qinghai Lake: 4,254.9 km2, Wan et al.,
535
2014) as well as a shallower depth (Gahai: 8.0~9.5 m, Qinghai Lake: average of 17.9 m, Wang & 536
Dou, 1998). Although Gahai has a higher mineralization of 31.73 g L-1 than does Qinghai Lake 537
(13.84 g L-1) (Wang & Dou, 1998), the mean freeze-up start date is 15 days earlier than that of 538
6. Conclusions 540
Approximately two-thirds of the cloud cover from the MODIS daily snow cover products 541
can be eliminated by gap filling approach combining Terra and Aqua data and using the pixels 542
within two days before and after the cloud covered pixel. The water cover classification from 543
cloud-removed MODIS data agree well with the Landsat data (28 scenes, MAE = 4.58%) for two 544
validated lakes (Nam Co and Selin Co) during the freeze-up and break-up periods. On this basis, 545
the freeze-up start and break-up end dates of the 58 lakes on the TP from 2001 to 2017 are 546
extracted. The freeze-up end and break-up start dates of 18 lakes were simultaneously extracted, 547
and the lake ice durations (including freeze-up duration, complete freezing duration, break-up 548
duration and ice cover duration) are calculated based on freeze-up/break-up dates. Compared to 549
freeze-up dates (MAEs range from 2.92 to 7.25 days), the break-up dates (MAEs range from 550
1.75 to 3.25 days) have a better consistent with different passive microwave data sets (derived 551
from AMSR-E/2 and SSM/I). 552
From late October to mid-January of the following year, the lakes on the TP begin to freeze 553
one after another (mainly from northern part to southern part). Over 17 years, the freeze-up start 554
dates of 81.03% of lakes have been delayed at a mean rate of 0.55 d yr-1, and the other 18.97% of
555
lakes have advancing freeze-up start date at a mean change rate of 0.44 d yr-1. From late March 556
to early July, the lakes gradually end their ice cover periods (mainly from southern part to 557
northern part). Over 17 years, the lakes whose break-up end dates have been delayed and 558
advanced account for 50% each, with mean change rates of 0.69 d yr-1 and 0.39 d yr-1, 559
respectively. The mean ice cover duration of 58 lakes is 157.78 days, of which the shortest is less 560
than three months, and the longest is eight months. From 2001 to 2017, there are 18 lakes with 561
their ice cover durations at a mean change rate of 0.80 d yr-1. Furthermore, the freeze-up and 563
break-up processes of 18 lakes are extracted; the mean freeze-up duration is 9.81 days, the mean 564
break-up duration is 13.01 days, and the mean complete freezing duration is 121.12 days. Most 565
lakes have shorter freeze-up durations than break-up durations, and the freeze-up and break-up 566
rates of most lakes have increased over the 17 years. 567
The ice phenology is influenced by climatic conditions, geographical location, and the 568
physico-chemical characteristics of the lake. Lakes in the region with a lower altitude, higher 569
air/water temperature and higher wind speed are inclined to have later freeze-up and earlier 570
break-up dates, as well as shorter ice cover durations. The physico-chemical characteristics of 571
the lakes mainly affect the freeze-up dates; deeper lakes with larger areas and higher 572
mineralizations tend to have later freeze-up dates. Sometimes lake physical conditions may have 573
a greater impact on ice phenology than do the chemical conditions. 574
The lack of historical observational data makes it difficult to study lake ice phenology on 575
the TP without using remote sensing data. The quality of MODIS daily snow cover products 576
limits the number of lakes that can be studied, and the low spatial resolution of reanalysis data 577
makes it difficult to represent the actual meteorological conditions of each lake. It is also difficult 578
to ensure the reliability of historical lake physico-chemical data that were collected several 579
decades ago. With the improvement of data and methods, lake ice phenology on the TP and its 580
influencing factors can hopefully be further analyzed in the future. In addition, further research is 581
required on the comparisons of lake ice phenology characteristics derived from different sources 582
Acknowledgments 584
This work is supported financially by the Program for National Natural Science Foundation of China
585
(No. 41830105) and also funded by the International Scholar Exchange Fellowship (ISEF) program at
586
KFAS (Korean Foundation of Advanced Studies). The MODIS snow data used in this study are obtained
587
from the National Snow and Ice Data Center (http://nsidc.org). The Landsat data used are obtained from
588
the Google Earth Engine platform (https://earthengine.google.com/). The Reanalysis data are from the
589
National Oceanic and Atmospheric Administration (https://www.esrl.noaa.gov/). We would thank the two
590
anonymous reviewers and editors for valuable comments and suggestions to greatly improve the paper.
591
References 592
Adrian, R., O'Reilly, C. M., Zagarese, H., Baines, S. B., Hessen, D. O., Keller, W., et al. (2009). 593
Lakes as sentinels of climate change. Limnology and Oceanography, 54(6), 2283-2297. 594
http://dx.doi.org/10.4319/lo.2009.54.6_part_2.2283. 595
Brown, L. C. & Duguay, C. R. (2010). The response and role of ice cover in lake-climate 596
interactions. Progress in Physical Geography, 34, 671-704. 597
http://dx.doi.org/10.1177/0309133310375653. 598
Bussieres, N., Verseghy, D. & MacPherson, J. I. (2002). The evolution of AVHRR-derived water 599
temperatures over boreal lakes. Remote sensing of environment, 80(3), 373-384. 600
https://doi.org/10.1016/S0034-4257(01)00317-0. 601
Cai, Y., Ke, C. Q. & Duan, Z. (2017). Monitoring ice variations in Qinghai Lake from 1979 to 602
2016 using passive microwave remote sensing data. Science of the Total Environment, 607-608, 603
Chaouch, N., Temimi, M., Romanov, P., Cabrera, R., McKillop, G. & Khanbilvardi, R. (2014). 605
An automated algorithm for river ice monitoring over the Susquehanna River using the MODIS 606
data. Hydrological Processes, 28(1), 62-73. http://dx.doi.org/10.1002/hyp.9548. 607
Che, T., Li, X. & Jin, R. (2009). Monitoring the frozen duration of Qinghai Lake using satellite 608
passive microwave remote sensing low frequency data (in Chinese). Chinese Science Bulletin, 609
54(6), 787-791. http://dx.doi.org/10.1007/s11434-009-0044-3. 610
Dörnhöfer, K. & Oppelt, N. (2016). Remote sensing for lake research and monitoring-Recent 611
advances. Ecological Indicators, 64, 105-122. http://dx.doi.org/10.1016/j.ecolind.2015.12.009. 612
Du, J. Y., Kimball, J. S., Duguay, C., Kin, Y. & Watts, J. D. (2017). Satellite microwave 613
assessment of Northern Hemisphere lake ice phenology from 2002 to 2015. The Cryosphere, 11, 614
47-63. http://dx.doi.org/10.5194/tc-2016-199. 615
Duguay, C. R., Bernier, M., Gauthier, Y. & Kouraev, A. (2015). Remote sensing of lake and 616
river ice. In M. Tedesco (Ed.) Remote Sensing of the Cryosphere (pp. 273-306). Oxford, UK: 617
Wiley-Blackwell. http://dx.doi.org/10.1002/9781118368909.ch12. 618
Duguay, C. R. & Lafleur, P. M. (2003). Estimating depth and ice thickness of shallow subarctic 619
lakes using spaceborne optical and SAR data. International Journal of Remote Sensing, 24(3), 620
475–489. http://dx.doi.org/10.1080/01431160304992. 621
Duguay, C. R., Pultz, T. J., Lafleur, P. M. & Drai, D. (2002). RADARSAT backscatter 622
characteristics of ice growing on shallow sub-arctic lakes, Churchill, Manitoba, Canada. 623
Hydrological Processes, 16(8), 1631–1644. http://dx.doi.org/10.1002/hyp.1026.
Gafurov, A. & Bárdossy, A. (2009). Cloud removal methodology from MODIS snow cover 625
product. Hydrology and Earth System Sciences, 13(7), 1361-1373. 626
http://dx.doi.org/10.5194/hess-13-1361-2009. 627
Gao, Y., Xie, H. J., Lu, N., Yao, T. D. & Liang, T. G. (2010). Toward advanced daily cloud-free 628
snow cover and snow water equivalent products from Terra–Aqua MODIS and Aqua AMSR-E 629
measurements. Journal of Hydrology, 385(1-4), 23-35.
630
https://doi.org/10.1016/j.jhydrol.2010.01.022. 631
Gao, Y., Xie, H. J., Yao, T. D. & Xue, C. S. (2010). Integrated assessment on multi-temporal and 632
multi-sensor combinations for reducing cloud obscuration of MODIS snow cover products of the 633
Pacific Northwest USA. Remote Sensing of Environment, 114(8), 1662-1675. 634
https://doi.org/10.1016/j.rse.2010.02.017. 635
Geldsetzer, T., Sanden, J. V. D. & Brisco, B. (2010). Monitoring lake ice during spring melt 636
using RADARSAT-2 SAR. Canadian Journal of Remote Sensing, 36(S2), S391-S400. 637
Guo, L. N., Wu, Y. H., Zheng, H. X., Zhang, B., Li, J. S., Zhang, F. F. & Shen, Q. (2018). 638
Uncertainty and variation of remotely sensed lake ice phenology across the Tibetan Plateau. 639
Remote Sensing, 10, 1534. https://doi.org/10.3390/rs10101534.
640
Hall, D. K. & Riggs, G. A. (2007). Accuracy assessment of the MODIS snow products. 641
Hydrological Processes, 21(12), 1534-1547.http://dx.doi.org/10.1002/hyp.6715.
642
Hall, D. K., Riggs, G. A. & Salomonson, V. V. (2001). Algorithm Theoretical Basis Document 643
(ATBD) for the MODIS Snow and Sea Ice-Mapping Algorithms. https://modis-snow-644
He, L., Han, F. Q., Han, W. X., Yan, J. P., Li, B. K., Han, Y. Z., et al. (2015). Hydrochemical 646
Characteristics of Lexiewudan Lake in Hoh Xil, Qinghai (in Chinese). Journal of Salt Lake
647
Research, 23(2), 28-33.
648
Howell, S. E. L., Brown, L. C., Kang, K. -K. & Duguay, C. R. (2009). Variability in ice 649
phenology on Great Bear Lake and Great Slave Lake, Northwest Territories, Canada, from 650
SeaWinds/QuikSCAT: 2000-2006. Remote Sensing of Environment, 113(4), 816-834. 651
http://dx.doi.org/10.1016/j.rse.2008.12.007. 652
Huang, H., Liang, T., Zhang, X. & Guo, Z. (2011). Validation of MODIS snow cover products 653
using Landsat and ground measurements during the 2001-2005 snow seasons over northern 654
Xinjiang, China. International Journal of Remote Sensing, 32(1), 133-152. 655
http://dx.doi.org/10.1080/01431160903439924. 656
Jeffries, M. O., Morris, K., Weeks, W. F. & Wakabayashi, H. (1994). Structural and stratigraphic 657
features and ERS 1 synthetic aperture radar backscatter characteristics of ice growing on shallow 658
lakes in NW Alaska, winter 1991–1992. Journal of Geophysical Research Oceans, 99(C11), 659
22459–22471. http://dx.doi.org/10.1029/94JC01479. 660
Kang, S. C., Xu, Y. W., You, Q. L., Flügel, W. -A., Pepin, N. & Yao, T. D. (2010). Review of 661
climate and cryospheric change in the Tibetan Plateau. Environmental Research Letters, 5, 662
015101. http://dx.doi.org/10.1088/1748-9326/5/1/015101. 663
Ke, C. Q., Tao, A. Q. & Jin, X. (2013). Variability in the ice phenology of Nam Co Lake in 664
central Tibet from scanning multichannel microwave radiometer and special sensor 665
microwave/imager: 1978 to 2013. Journal of Applied Remote Sensing, 7, 073477. 666
Kendall, M. G. (1975). Rank Correlation Methods. London: Charles Griffin. 668
Kouraev, A. V., Semovski, S. V., Shimaraev, M. N., Mognard, N. M., Legrésy, B & Rémy, F. 669
(2007). The ice regime of Lake Baikal from historical and satellite data: Relationship to air 670
temperature, dynamical, and other factors. Limnology and Oceanography, 52(3), 1268-1286. 671
http://dx.doi.org/10.4319/lo.2007.52.3.1268. 672
Kropáček, J., Maussion, F., Chen, F., Hoerz, S. & Hochschild, V. (2013). Analysis of ice 673
phenology of lakes on the Tibetan Plateau from MODIS data. The Cryosphere, 7(1), 287-301. 674
http://dx.doi.org/10.5194/tc-7-287-2013. 675
Latifovic, R. & Pouliot, D. (2007). Analysis of climate change impacts on lake ice phenology in 676
Canada using the historical satellite data record. Remote Sensing of Environment, 106(4), 492-677
507. http://dx.doi.org/10.1016/j.rse.2006.09.015. 678
Liang, T. G., Zhang, X. T., Xie, H. J., Wu, C. X., Feng, Q. S., Huang, X. D. & Chen, Q. G. 679
(2008). Toward improved daily snow cover mapping with advanced combination of MODIS and 680
AMSR-E measurements. Remote Sensing of Environment, 112(10), 3750-3761. 681
https://doi.org/10.1016/j.rse.2008.05.010. 682
Liu, X. D. & Chen, B. D. (2000). Climatic warming in the Tibetan Plateau during recent decades. 683
International Journal of Climatology, 20, 1729-1742.
http://dx.doi.org/10.1002/1097-684
0088(20001130)20:14<1729::AID-JOC556>3.0.CO;2-Y. 685
López-Burgos, V., Gupta, H. V. & Clark, M. (2013). Reducing cloud obscuration of MODIS 686
snow cover area products by combining spatio-temporal techniques with a probability of snow 687
approach. Hydrology and Earth System Sciences, 17(5), 1809-1823. 688
Mann, H. B. (1945). Non-parametric tests against trend. Econometrica, 13, 245-259. 690
http://dx.doi.org/10.2307/1907187. 691
Maurer, E. P., Rhoads, J. D., Dubayah, R. O. & Lettenmaier, D. P. (2003). Evaluation of the 692
snow-covered area data product from MODIS. Hydrological Processes, 17, 59-71. 693
http://dx.doi.org/10.1002/hyp.1193. 694
Morris, K., Jeffries, M. O. & Weeks, W. F. (1995). Ice processes and growth history on Arctic 695
and sub-Arctic lakes using ERS-1 SAR data. Polar Record, 31(177), 115–128. 696
http://dx.doi.org/10.1017/S0032247400013619. 697
Palecki, M. A. & Barry, R. G. (1986). Freeze-up and break-up of lakes as an index of 698
temperature changes during the transition seasons: a case study for Finland. Journal of Climate
699
and Applied Climatology, 25, 893-902.
https://doi.org/10.1175/1520-700
0450(1986)025<0893:FUABUO>2.0.CO;2. 701
Parajka, J. & Blöschl, G. (2008). The value of MODIS snow cover data in validating and 702
calibrating conceptual hydrologic models. Journal of Hydrology, 358(3-4), 240-258. 703
http://dx.doi.org/10.1016/j.jhydrol.2008.06.006. 704
Paudel, K. P. & Andersen, P. (2011). Monitoring snow cover variability in an agropastoral area 705
in the Trans Himalayan region of Nepal using MODIS data with improved cloud removal 706
methodology. Remote Sensing of Environment, 115(5), 1234-1246. 707
http://dx.doi.org/10.1016/j.rse.2011.01.006. 708
Reed, B., Buddle, M., Spencer, P. & Miller, A. E. (2009). Integration of MODIS-derived metrics 710
to assess interannual variability in snowpack, lake ice, and NDVI in southwest Alaska. Remote
711
Sensing of Environment, 113(7), 1443-1452. http://dx.doi.org/10.1016/j.rse.2008.07.020.
712
Rouse, W. R., Oswald, C. J., Binyamin, J., Spence, C., Schertzer, W. M., Blanken, P. D., et al. 713
(2005). The Role of Northern Lakes in a Regional Energy Balance. Journal of
714
Hydrometeorology, 6, 291-305. https://doi.org/10.1175/JHM421.1.
715
Sorman, A. U., Akyurek, Z., Sensoy, A., Sorman, A. A. & Tekeli, A. E. (2007). Commentary on 716
comparison of MODIS snow cover and albedo products with ground observations over the 717
mountainous terrain of Turkey. Hydrology and Earth System Sciences, 11(4), 1353-1360. 718
http://dx.doi.org/10.5194/hess-11-1353-2007. 719
Wan, W., Li, H., Xie, H. J., Hong, Y., Long. D., Zhao, L. M., et al. (2017). A comprehensive 720
data set of lake surface water temperature over the Tibetan Plateau derived from MODIS LST 721
products 2001–2015. Scientific Data, 4, 170095. http://dx.doi.org/10.1038/sdata.2017.95. 722
Wan, W, Xiao, P. F., Feng, X. Z., Li, H., Ma, R. H., Duan, H. T. & Zhao, L. M. (2014). 723
Monitoring lake changes of Qinghai-Tibetan Plateau over the past 30 years using satellite remote 724
sensing data. Chinese Science Bulletin, 59(10), 1021-1035. http://dx.doi.org/10.1007/s11434-725
014-0128-6. 726
Wang, S. M. & Dou, H. S. (1998). Records of Chinese Lakes (in Chinese). Beijing, CHN: 727
Science Press. 728
Weber, H., Riffler, M., Nõges, T. & Wunderle, S. (2016). Lake ice phenology from AVHRR 729
data for European lakes: An automated two-step extraction method. Remote Sensing of
730
Environment, 174, 329-340. http://dx.doi.org/10.1016/j.rse.2015.12.014.
Wei, Q. F. & Ye, Q. H. (2010). Review of lake ice monitoring by remote sensing (in Chinese). 732
Progress in Geography, 29(7), 803–810.
733
Williams, G. P. (1965). Correlating freeze-up and break-up with weather conditions. Canadian
734
Geotechnical Journal, 11(4), 313-326. http://doi.org/10.1139/t65-047.
735
Yao, X. J., Li, L., Zhao, J., Sun, M. P., Li, J., Gong, P. & An, L. N. (2016). Spatial-temporal 736
variations of lake ice phenology in the Hoh Xil region from 2000 to 2011. Journal of
737
Geographical Sciences, 26(1), 70-82. http://dx.doi.org/10.1007/s11442-016-1255-6.
738
Yu, J. Y., Zhang, G. Q., Yao, T. D., Xie, H. J., Zhang, H. B., Ke, C. Q. & Yao, R. Z. (2016). 739
Developing Daily Cloud-Free Snow Composite Products from MODIS Terra–Aqua and IMS for 740
the Tibetan Plateau. IEEE Transactions on Geoscience & Remote Sensing, 54(4), 2171-2180. 741
http://doi.org/10.1109/TGRS.2015.2496950. 742
Zhang, G. Q., Yao, T. D., Xie, H. J., Kang, S. C. & Lei, Y. B. (2013). Increased mass over the 743
Tibetan Plateau: From lakes or glaciers? Geophysical Research Letters, 40(10), 2125-2130. 744
http://dx.doi.org/10.1002/grl.50462. 745
Zhang, G. Q., Yao, T. D., Xie, H. J., Qin, J., Ye, Q. H., Dai, Y. F. & Guo, R. F. (2014). 746
Estimating surface temperature changes of lakes in the Tibetan Plateau using MODIS LST data. 747
Journal of Geophysical Research Atmospheres, 119(14), 8552–8567.
748
http://dx.doi.org/10.1002/2014JD021615. 749
Zhang, G. Q., Yao, T. D., Xie, H. J., Zhang, K. X. & Zhu, F. J. (2014). Lakes' state and 750
abundance across the Tibetan Plateau. Chinese Science Bulletin, 59(24), 3010-3021. 751
http://dx.doi.org/10.1007/s11434-014-0258-x. 752
754
755
756
757
758
759
760
761
762
763