ISSN Online: 2152-7199 ISSN Print: 2152-7180
DOI: 10.4236/psych.2018.97105 Jul. 20, 2018 1789 Psychology
Validation of the Flourishing Scale (FS),
Greek Version and Evaluation of Two
Well-Being Models
Theodoros A. Kyriazos, Anastassios Stalikas, Konstantina Prassa, Vasiliki Yotsidi,
Michael Galanakis, Christos Pezirkianidis
Department of Psychology, Panteion University, Athens, Greece
Abstract
The purpose of this study was to evaluate the factor structure, invariance, re-liability, convergent and discriminant validity of the Flourishing Scale using exploratory and confirmatory factor analysis in 2272 Greek adults (aged M = 35.54 years). We used the 3-faced validation method. After splitting the sam-ple in three parts (20%, 40% and 40%), we established a structure in the first 20% part with Exploratory Factor Analysis. Later on, the structure was re-examined in the second 40% part with Confirmatory Factor Analysis, con-firming the unidimensional structure of FS. This unidimensional structure was further cross-validated in the third part of the sample having equal power to the second one (40%) with a second CFA. In the final phase of the 3-faced validation method, strict measurement invariance was evaluated. The Tripar-tite Model of Mental well-being and the Two-Continua Well-being Model were also evaluated using FS as a well-being measure supporting FS construct validity further. Reliability (α and ω) and AVE convergent validity were also examined. Convergent and discriminant validity were examined using 12 dif-ferent measures. Normative data were also calculated. Considering all find-ings, FS is gender invariant, reliable, and valid measure for the Greek cultural context.
Keywords
FS Factor Structure, EFA, ICM-CFA, Measurement Invariance, Tripartite Well-Being Model, Two Continua Well-Being Model, Normative Data, Greece
1. Introduction
Well-being has been the focal point of western and eastern moral philosophers
How to cite this paper: Kyriazos, T. A., Stalikas, A., Prassa, K., Yotsidi, V., Galana-kis, M., & Pezirkianidis, C. (2018). Valida-tion of the Flourishing Scale (FS), Greek Version and Evaluation of Two Well-Being Models. Psychology, 9, 1789-1813.
https://doi.org/10.4236/psych.2018.97105
Received: June 21, 2018 Accepted: July 17, 2018 Published: July 20, 2018
Copyright © 2018 by authors and Scientific Research Publishing Inc. This work is licensed under the Creative Commons Attribution International License (CC BY 4.0).
DOI: 10.4236/psych.2018.97105 1790 Psychology for thousands of years, and has also been the central focus of positive psychology
(Linley, Maltby, Wood, Osborne, & Hurling, 2009;Cummins, 2003; Diener &
Lucas, 1999;Keyes et al., 2002). The positive psychology movement highlighted
that well-being is not the absence of ill-being. That is, lack of negative affect and illness does not equal the presence of positive affect and well-being or
flourish-ing (Seligman, 2002; Seligman, 2011). Generally, two well-being approaches
emerged: the subjective well-being (hedonic) and the psychological well-being (eudaimonic), or hedonia and eudemonia (Ryan & Deci, 2001).
Hedonia emphasizes on pleasure and avoidance of any displeasure(Diener et
al., 2003), subjective happiness, and enjoyment (Delle Fave et al., 2011). On the
other hand, eudaimonia focuses on personal growth, self-actualization, and purpose in life (Ryan & Deci, 2001; Ryff, 1989;Ryff & Keyes, 1995), drawing on the humanistic psychology (Silva & Caetano, 2013). Additional eudaimonic traits are optimism, self-esteem, enjoyment from self-expressive activities, au-tonomy, and vitality (Ruini, 2016; Ryan & Deci, 2001; Ryff, 1989; Waterman,
2008).
Generally, flourishing is closely related to eudemonic well-being (Deci &
Ryan, 2008;Ryan & Deci, 2001). In fact, Diener et al. (2010) initially called FS
“Psychological Well-being” (Diener et al., 2009), but consequently this name was changed to Flourishing Scale (FS) because it comprised additional dimensions beyond eudaimonic well-being. Flourishing is defined as a state of optimal psy-chological functioning (Keyes et al., 2002;Giuntoli et al., 2017). Keyes et al. (2002) described flourishing as an integration of three states: emotional, psychological, and social well-being. Specifically, flourishing integrates self-determination theory
(Deci & Ryan, 2000), the optimal experience or flow model (Csikszentmihalyi,
1990), the psychological well-being model (Ryff, 1989), and psychological,
emo-tional and social well-being (Keyes et al., 2002).
The operationalization of the above flourishing models brought about a ple-thora of eudaimonic well-being measures. The Flourishing Scale (FS) was de-veloped by Diener et al. (2010) adding to the flourishing measurement instru-ments by providing a brief measure that combined the essential components of previous models: life meaning and purpose (Ryff, 1989; Seligman, 2002;Steger et
al., 2006), quality in interpersonal relationships (Deci & Ryan, 2000;Ryff, 1989),
flow and engagement (Csikszentmihalyi, 1990;Seligman, 2011), contribution to the well-being of others (Putnam, 2000), personal competence (Deci & Ryan,
2000; Ryff, 1989), self-acceptance (Ryff, 1989), optimism (Carver &Scheier,
2009), receiving others’ respect (Brown, Nesse, Vinokur, & Smith, 2003),
meas-ured by eight items.
Psycho-DOI: 10.4236/psych.2018.97105 1791 Psychology logical Well-being by Ryff, 1989; and Satisfaction with Life Scale by Diener et al., 1985). The validation of the FS in Italian (Giuntoli et al., 2017), Indian (Singh et al., 2017), Portuguese (Silva & Caetano, 2013), Japanese (Sumi, 2014), and
Ira-nian(Khodarahimi, 2013) samples followed.
The Italian FS version (Giuntoli et al., 2017) was validated in two samples also indicating a single-factor structure using Confirmatory Factor Analysis (CFA). Measurement invariance was also examined. Internal consistency was .88 and convergent validity was examined with SPANE (Diener et al., 2010), PANAS
(Watson, Clark, & Tellegen, 1988), SHS (Lyubomirsky & Lepper, 1999), PWI
(International Well-being Group, 2006), and SGI (International Well-being Group, 2006). The Indian FS version (Singh et al., 2017) was validated in three samples with Exploratory Factor Analysis (EFA) and two Confirmatory Factor Analyses (CFA) confirming the single factor structure. Mean scores per gender was 43.10 for males and 44.65 for females and Cronbach’s alpha in the three samples was .80, .91 and .85. Convergent validity was examined using SPANE
(Diener et al., 2010) and the Mental Health Continuum-Short Form (Keyes,
2009), and it was supported.
In the Portuguese version (Silva & Caetano, 2013), internal consistency relia-bility in two samples was .83 (adults) and .78 (university students). The unidi-mensionality of FS factor structure was supported as indicated by a CFA and a Multi-group CFA (MGCFA). Mean scores were 42.92 (adults) and 44.51 (stu-dents). Convergent validity was established by statistically significant correla-tions with the Scale of Positive and Negative Experience (SPANE; Diener et al., 2010), the Satisfaction with life scale (SWLS; Diener et al., 1985), the Subjective Happiness Scale (SHS; Lyubomirsky & Lepper, 1999) and the Single-item meas-ure of happiness (Fordyce, 1977, 1988). The Japanese adaption of FS (Sumi,
2014) had a Cronbach’s alpha of .95 and the single factor structure was
con-firmed. Mean score was 36.63 and convergent and discriminant validity were supported by examining the relationship of FS with SPANE (Diener et al., 2010), SWLS (Diener et al., 1985), SHS (Lyubomirsky & Lepper, 1999), the Revised Life Orientation Test (R-LOT; Scheier et al., 1994), the PANAS (Watson et al., 1988), and Hopkins Symptoms Checklist (HSCL; DeLogatis et al., 1974). Finally, the Iranian version of FS was validated in a sample of adults. EFA indicated a single factor explaining 59.46% of the variance. Cronbach’s alpha was .89
(Khodarahi-mi, 2013). Concurrent validity was established using the Satisfaction with Life
Scale (Diener et al., 1985).
Regarding the validation of FS in different age groups, studies in an Indian cultural context used FS on school children (Singh & Junnarkar, 2015; Singh,
Ruch, & Junnarkar, 2014) and adolescents (Singh et al., 2017). MGCFA findings
unidimen-DOI: 10.4236/psych.2018.97105 1792 Psychology sionality of the FS was validated in Western, Eastern and Asiatic cultures, i.e. in-dividualistic and collectivistic ones (Hofstede, 2001; Triandis, 1995), special populations and different age groups.
Flourishing showed a positive correlation with resilience, positive affect, mental health continuum and its dimensions (Keyes, 2009) and SPANE-P (posi-tive experiences; Diener et al., 2010). It was negatively correlated with SPANE-N (negative experiences; as cited in Singh et al., 2017). Additionally, Diener et al.
(2010)suggested that FS and SPANE could be integrated to a three-factor model
of well-being (flourishing, positive feelings, and negative feelings). This hypo-thesis was later evaluated in other studies (Howell & Buro, 2015;Singh et al.,
2017; Giuntoli et al., 2017).
Well-being literature also devised the two continua model of mental health (see Keyes, 2005; Lim, 2014;Lupano Perugini et al., 2017;Petrillo et al., 2015) to empirically evaluate the hypothesis that mental health and mental illness are two distinct but linked dimensions (Keyes, 2005). This is yet another compound model containing a mental illness measure and a mental health measure. Testing alternative one-factor and two-factors models with EFA and CFA, this model empirically suggested that mental health and mental illness are not the opposite ends of a bipolar continuum; instead, they are two distinct but correlated di-mensions (see Perugini et al., 2017;Lamers et al., 2011;Petrillo et al., 2015).
The present study focuses on the following objectives: 1) To validate the FS, Greek version in an adult sample of the general adult population using the 3-faced validation method (Kyriazos, Stalikas, Prassa, & Yotsidi, 2018a, 2018b) with EFA and CFA; 2) To establish strict measurement invariance across gender; 3) To test two well-being models using FS as a well-being measure, namely the two continua model (Keyes, 2002, 2005) and the Tripartite Model of Mental well-being also proposed by (Keyes, 2002; see also Diener et al., 2010); 4) To examine internal consistency reliability and convergent/discriminant validity with 12 different measures.
2. Method
2.1. Participants
The sample consisted of 2272 Greek adults of the general population (females 63%) aged M = 35.54 years (SD = 12.35). The 51% of the participants were older than 33 years of age and an equal percentage of them were single (51%). The rest were either married/living together (41%) or divorced (8%). Most of the partici-pants (59%) did not have children, or had either 1 (14%), 2 children (22%), or more (5%). Most participants had a bachelor degree (42%), finished high-school (24%), held a postgraduate degree (19%), were undergraduate university stu-dents (14%), or received primary education (1%).
2.2. Materials
DOI: 10.4236/psych.2018.97105 1793 Psychology The FS (Diener et al., 2009,2010) is an 8-item unidimensional measure about general aspects of positive human functioning (e.g., “I am a good person and live a good life”). Responses are rated on a 7-point Likert scale from strong disa-greement (1) to strong adisa-greement (7). All items are positively worded. Possible score ranges from 8 (minimum flourishing) to 56 (maximum flourishing).
Di-ener et al. (2010) reported an internal consistency reliability of α = .87. FS was
translated in Greek by Stalikas, Kyriazos, & Kotsoni (2017) adopting the transla-tion/back-translation method (Brislin, 1970).
2) Scale of Positive and Negative Experience (SPANE-12)
This is a 12-item scale of subjective well-being. It contains two dimensions of positive and negative experiences, with six one-word items each. Items are scored on a Likert scale from 1 (very rarely or never) to 5 (very often or always). Experiences are evaluated on a 4-week time frame. Score on each dimension (SPANE-P and SPANE-N) can range from 6 to 30 and it is separately calculated. Their difference (Affect Balance or SPANE-B) can vary from −24 to 24. In this study, Cronbach’s alpha for SPANE-P, SPANE-N and SPANE total was .90, .85 and .91 respectively.
3) Scale of Positive and Negative Experience 8 (SPANE-8)
Except for the original version (SPANE-12), this study also included a second version (SPANE-8) with 8 items (4 in SPANE-P and 4 in SPANE-N). SPANE-8
(Kyriazos, Stalikas, Prassa, & Yotsidi, 2018b) is a revised structure containing
one general feeling per dimension (item pleasant in positive experiences and bad
in negative ones) instead of 3 in the original SPANE (Diener et al., 2010: p. 145). This resulted in a briefer structure with four positive (Pleasant, Happy, Joyful, Contented) and four negative (Bad, Sad, Afraid, Angry) items. Cronbach’s Alpha in this study was .85 for SPANE-8 P, .75 for SPANE-8 N and .84 for the total SPANE-8.
4) Warwick-Edinburgh Mental Well-Being Scale (WEMWBS)
The WEMWBS (Universities of Warwick and Edinburgh; Tennant et al., 2007) is a 14-item unidimensional measure of mental well-being and psycholog-ical functioning. Items are rated on a 5-point Likert scale from “None of the time” to “All of the time” indicating frequency. Score is summed ranging from 14 to 70. WEMWBS has been reported to have adequate internal consistency re-liability (.89 in student samples and .91 in adult samples; Tennant et al., 2007). Internal consistency reliability in this study was α = .91.
5) Brief Resilience Scale (BRS)
BRS (Smith, Dalen, Wiggins, Tooley, Christopher, & Bernard, 2008) is a
6-item measure of resilience, focusing on the ability to bounce back from stress and hardship. Responses are rated on a 5-point Likert scale from Strongly
Dis-agree (1) to Strongly Agree (5). Smith et al. (2008) reported Cronbach’s alpha
from .80 to .91. In this study Cronbach’s alpha was α = .80.
6) Mental Health Continuum-Short Form (MHC-SF)
DOI: 10.4236/psych.2018.97105 1794 Psychology social (SWB) and psychological well-being (PWB). Responses are rated on a 6-point Likert scale, indicating frequency (never, once or twice a month, about
once a week, two or three times a week, almost every day, every day) using a
4-week time frame. Internal consistency reliability for the total MHC-SF scale was reported by Keyes (2005) to be adequate (Cronbach’s alpha > .80). Internal reliability for the total scale in this study was α = .90.
7) The Gratitude Questionnaire (GQ-6)
The GQ-6 (McCullough, Emmons, & Tsang, 2002) is a 6-item measure of gra-titude experience in everyday life. Items are rated on a 7-point Likert scale (1 =
strongly disagree, 7 = strongly agree). GQ-6 has a unidimensional structure.
Possible scores range from 6 (less grateful) to 42 (most grateful). Items 3 and 6 are reverse-scored. The internal consistency reliability of GQ-6 in the original study was .82 (McCullough, Emmons & Tsang, 2002) and in this study it was es-timated to be α = .68.
8) Meaning in Life Questionnaire (MLQ)
The MLQ(Steger et al., 2006)measures the presence of and search for mean-ing in life, with a total of 10 items in two factors (presence of meanmean-ing and search for meaning). All items are rated on a 7-point Likert scale (from “
Abso-lutely True” to “Absolutely Untrue”). Possible scores for each scale range from 9
- 29 for Presence of Meaning and from 5 - 35 for Search for Meaning. Internal reliability in this study for the total scale was α = .78
9) Satisfaction with Life Scale (SWLS)
The Satisfaction with Life Scale(Diener, Emmons, Larsen, & Grifin, 1985) is a 5-item measure of perceived life satisfaction. Items are rated on a 7-point Likert scale (1 = Strongly Disagree, 7 = Strongly Agree). Internal consistency reliability (Cronbach’s alpha) has been reported to be from .79 to .89 (Pavot & Diener,
1993). In this study it was α = .88.
10) Trait Hope Scale (HS)
Trait Hope Scale (Snyder et al., 1991) measures trait hope with two factors: Agency and Pathways. Items are rated from 1 (Definitely False) to 8 (Definitely True) resulting to a possible score from 8 to 64. Snyder et al. (1991) reported that Cronbach’s alphas for the total scale varied from .74 to .84. Internal reliabil-ity in this study was α = .89.
11) World Health Organization Quality of Life-Brief scale (WHOQOL-BREF)
WHO Quality of Life-Brief scale (WHOQOL Group, 1998a, 1998b) is an assessment tool of perceived quality of life. It is the short version of the WHOQOL-100 (c.f. Skevington, 1999). It contains 26 items reflecting all life quality facets of WHOQOL-100. Responses are rated on a 5-point Likert scale indicating either intensity, or capacity, or frequency, or judgment (Skevington et
al., 2004). The instrument is divided in four QOL domains: Physical health,
DOI: 10.4236/psych.2018.97105 1795 Psychology
12) Depression Anxiety Stress Scale (DASS)
DASS (Lovibond & Lovibond, 1995) measures emotional distress with three 7-item dimensions, namely depression, anxiety and stress. The total of 21 items are rated on a 4-point Likert scale assessing intensity/frequency of distress (from
0 = did not apply to me at all to 3 = applied to me very much, or most of the
time) over the past week. The higher the score the more intense or frequent the emotional distress. Each factor has a distinct score ranging from 0 to 21. Internal consistency reliability was reported α =.97 for adults of the general population
(Henry & Crawford, 2005). Internal consistency reliability in this study for
De-pression, Anxiety, Stress and DASS-21 Total was α = .90, .88, .89 and .95 respec-tively (see also Kyriazos, et al., 2018a).
13) Depression Anxiety Stress Scale, Short form (DASS-9)
DASS-9 (Yusoff, 2013 and in Greek by Kyriazos, Stalikas, Prassa, Yotsidi,
2018a) is a short form of DASS-21 (Lovidond & Lovibond, 1995). This version is
a post hoc measure, empirically derived by Yusoff (2013). DASS-9 evaluates emotional distress with three 3-item dimensions, like DASS original (depression, anxiety, stress). All nine items are rated on a 4-point Likert scale evaluating both intensity and frequency of symptoms over the last week (from 0 = did not apply
to me at all to 3 = applied to me very much, or most of the time). The higher the
score the more intense/frequent the emotions of distress. Each factor has a dis-crete score varying from 0 to 9. Cronbach’s alphas for Depression, Anxiety and Stress factors were .52, .57, and .55 respectively, as reported by Yussof (2013). In this study, internal reliability for Depression, Anxiety, Stress and DASS-9 Total was .79, .77, .73 and .89 correspondingly (Kyriazos et al., 2018a).
2.3. Procedure
One hundred and fifty undergraduate psychology students assisted the online data collection procedure. Students forwarded a link to an electronic test battery (in Google Forms© format) to 15 - 20 adults from their social milieu. Students
received extra-credit for their participation in the study. All the fields of the dig-ital battery form were set as required. An introduction informed participants about the purpose of this study. Data were collected based on the following process. First, students received a brief, free workshop about the administration of psychology questionnaires in a digital form. Then, a period of pilot-testing followed to track potential problems in the procedure and record the completion time (approximately 15 minutes). After successful pilot testing, students received a link to the official study.
2.4. Research Design
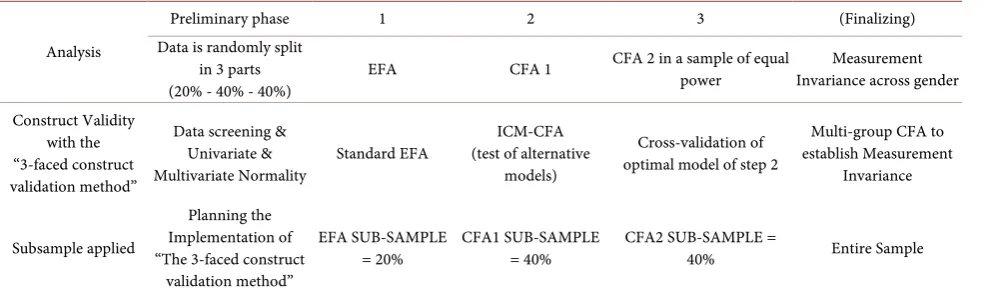
DOI: 10.4236/psych.2018.97105 1796 Psychology Table 1. Overview of the 3-faced construct validation method as implemented in FS.
Analysis
Preliminary phase 1 2 3 (Finalizing)
Data is randomly split in 3 parts
(20% - 40% - 40%) EFA CFA 1
CFA 2 in a sample of equal
power Invariance across gender Measurement
Construct Validity with the “3-faced construct validation method”
Data screening & Univariate &
Multivariate Normality Standard EFA
ICM-CFA (test of alternative
models)
Cross-validation of optimal model of step 2
Multi-group CFA to establish Measurement
Invariance
Subsample applied
Planning the Implementation of “The 3-faced construct
validation method”
EFA SUB-SAMPLE
= 20% CFA1 SUB-SAMPLE = 40% CFA2 SUB-SAMPLE = 40% Entire Sample
EFA = Exploratory factor analysis, ICM-CFA = Independent cluster model confirmatory factor analysis.
Regarding the factor analysis methods used in this study, in the first subsam-ple (EFA subsamsubsam-ple), Exploratory Factor Analysis (EFA) was carried out. Inde-pendent Cluster Model Confirmatory Factor Analysis (ICM-CFA) was applied in the second subsample (CFA 1 subsample). Only ICM-CFA models were tested because FS is a unidimensional scale and when the Exploratory Structural Equa-tion Modeling (ESEM) model includes one factor, it becomes an ICM-CFA model (Asparouhov & Muthen 2009; Marsh, Morin, Parker & Kaur, 2014). Si-milarly, CFA second-order models were not possible in a unidimensional struc-ture (Wang & Wang, 2012). The optimal model that emerged from the CFA 1 subsample was cross-validated in a different subsample of equal power (CFA 2). Then, a multi-group CFA (MGCFA) was carried out in the entire sample (N = 2272) using the CFA 2 optimal model as a baseline model, to test for strict mea-surement invariance across gender (see Table 1 for an overview of this method). A reliability analysis (α and ω) was carried out in the total sample. AVE Con-vergent validity and ConCon-vergent/Discriminant validity based on correlation analysis were evaluated in the entire sample using 12 measures of mental dis-tress, well-being, positivity and quality of life. Next, two CFA Well-being Models were evaluated: one using FS and DASS (Two Continua Model; Keyes, 2005) and a second using FS and SPANE (Diener et al., 2010). Finally, normative data were calculated.
Data were collected electronically on Google Forms® and were analyzed with SPSS Version 25 (IBM, 2017), Stata Version 14.2 (StataCorp, 2015), and MPlus Version 7.0 (Muthen & Muthen, 2012).
3. Results
3.1. Missing Values and Sample Power
DOI: 10.4236/psych.2018.97105 1797 Psychology total sample was used for EFA (nEFA = 452), the second 40% for CFA (nCFA1 =
910), and the third 40%—a sample of equal power—for another CFA (nCFA2 =
910). Sample-splitting (Guadagnoli & Velicer, 1988;MacCallum, Browne, &
Su-gawara, 1996) is a method of construct validity cross-check because the
re-searcher tests the optimal model in a different sample (Byrne, 2010; Brown,
2015). We termed the above analysis procedure “the 3-faced construct validation
method” (see details in Kyriazos et al., 2018a,2018b). The sample-to-variable
ra-tio for the EFA subsample (nEFA = 452) was 65.5 cases for each variable. For both
the CFA1 subsample (nCFA1 = 910) and the CFA2 subsample (nCFA2 = 910) it was
113.75 cases for each variable. A sample-to-variable ratio of 10:1 (Osborne &
Costello, 2004) to 20:1 (Schumacker & Lomax, 2015) is generally accepted.
Al-ternately, 500 - 1000 cases are generally regarded from adequate to excellent for factor analysis for scales with < 40 items like FS (Comrey & Lee, 1992;Singh et
al., 2016;DeVellis, 2017).
3.2. Univariate and Multivariate Normality
The data in the total sample and the three subsamples (N = 2272, nEFA = 452,
nCFA1 = 910, nCFA2 = 910) were non-normally distributed. Kolomogorov-Smirnov
tests (Massey, 1951) on each FS item were statistically significant with no excep-tion, at p < .001, indicating that all items for the total sample violated the univa-riate normality assumption.
Multivariate normality was examined with four tests: 1) Mardia’s multivariate kurtosis test (Mardia, 1970); 2) Mardia’s multivariate skewness test (Mardia,
1970); 3) Henze-Zirkler’s consistent test (Henze & Zirkler, 1990), and 4)
Door-nik-Hansen omnibus test (Doornik & Hansen, 2008). The null hypothesis was rejected for all four tests with all p values < 0.0001, suggesting a violation of mul-tivariate normality in all four samples (N = 2272, nEFA = 452, nCFA1 = 910, nCFA2 =
910).
3.3. Exploratory Factor Analysis (EFA)
In this phase of the 3-faced construct validation method, the unidimensional factor structure of FS was examined with EFA in the first subsample (20%, nEFA
= 452). MLR was used as a parameter estimator (c.f. Muthen & Muthen, 2012). MLR is a rescaling-based estimator suitable for non-normal distributions, calcu-lating standard errors and chi-square test, unlike similar estimation methods
(Wang & Wang, 2012; Brown, 2015). Furthermore, MLR is suitable for small
sample sizes (Bentler & Yuan, 1999; Muthen & Asparouhov, 2002; Wang &
Wang, 2012) like this split sample. Geomin factor rotation was used in all EFA
models. EFA model fit was evaluated by the limits proposed by Hu & Bentler
(1999) and Brown (2015): RMSEA (≤.06, 90% CI ≤ .06), SRMR (≤.08), CFI
(≥.95), TLI (≥.95). Additionally, the chi-square/df ratio ≤ 3 rule was also used
(Kline, 2016). Multiple fit measures when used simultaneously offer a more
conservative estimation of model fit (Brown, 2015).
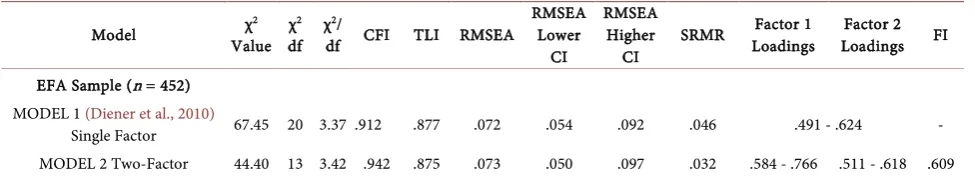
DOI: 10.4236/psych.2018.97105 1798 Psychology was proposed by Diener et al. (2010) and contains all FS items in one factor. MODEL 2 is a two-factor model extracted from the current dataset. Both models had generally tolerable fit, however some fit measures (TLI, RMSEA) were beyond acceptable limits (See Table 2). Next, we examined the FS factor struc-ture with CFA in a different subsample, to re-evaluate model fit.
3.4. Confirmatory Factor Analysis (CFA)
In this phase of the 3-faced construct validation method, we further examined FS dimensionality with Confirmatory Factor Analysis in a different subsample (40%, n = 910). CFA model fit was evaluated with the following criteria (Hu &
Bentler, 1999; Brown, 2015): RMSEA (≤.06, 90% CI ≤ .06), SRMR (≤.08), CFI
(≥.95), TLI (≥.95), and the chi-square / df ratio less than 3 (Kline, 2016). Again, MLR was used as a parameter estimator (c.f. Muthen & Muthen, 2012).
Only ICM-CFA models were tested because when the ESEM model includes one factor then it is equivalent to the classic CFA/SEM model (Asparouhov &
Muthen 2009;Marsh, et al., 2014). Similarly, CFA second order models were not
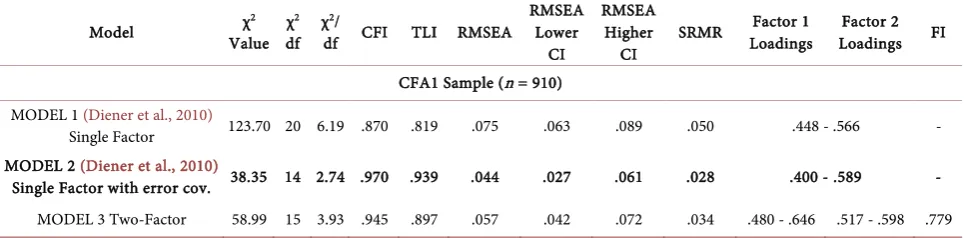
possible in a single factor structure (Wang & Wang, 2012). Given the above re-striction, the following three ICM-CFA models were evaluated with ICM CFA. MODEL 1 is the original single factor model proposed by Diener et al. (2010). MODEL 2 is a variation of MODEL 1 with error covariances added. MODEL 3 is a two factor model with items 1, 3, and 7 in Factor 1 and Items 2, 4, 5, 6, 8 in Factor 2, extracted in the previous EFA.
MODEL 1 had a poor fit. MODEL 2 had an acceptable fit with all fit measures within adequate fit limits (TLI = .939 > .90). Factor loadings were also accepta-ble, ranging from 0.400 to 0.589. MODEL 3 also had some measures in margi-nally lower values than required. To sum up, in the CFA 1 subsample (n = 910), MODEL 2—single factor model with error covariances added—showed optimal fit taking into consideration fit measures and factor loadings. Table 3 contains the fit statistics for all three models tested.
3.5. Cross-Validating the Optimal CFA Model in a Different
Subsample
[image:10.595.56.544.618.708.2]In this phase of the 3-faced construct validation method, we cross-validated the FS model that emerged from the CFA 1 subsample (40%, n = 910) with a second CFA in a new subsample of equal power (CFA 2, 40%, n = 910).
Table 2. Model fit for the EFA models of FS.
Model Value χ2 df χ2 χdf CFI TLI RMSEA 2/ RMSEA Lower CI
RMSEA Higher
CI SRMR
Factor 1
Loadings Loadings Factor 2 FI
EFA Sample (n = 452) MODEL 1 (Diener et al., 2010)
Single Factor 67.45 20 3.37 .912 .877 .072 .054 .092 .046 .491 - .624 - MODEL 2 Two-Factor 44.40 13 3.42 .942 .875 .073 .050 .097 .032 .584 - .766 .511 - .618 .609
DOI: 10.4236/psych.2018.97105 1799 Psychology Table 3. Model fit for the CFA 1 models of FS.
Model Value χ2 χdf 2 χdf CFI TLI RMSEA 2/ RMSEA Lower CI
RMSEA Higher
CI SRMR
Factor 1
Loadings Loadings Factor 2 FI
CFA1 Sample (n = 910) MODEL 1 (Diener et al., 2010)
Single Factor 123.70 20 6.19 .870 .819 .075 .063 .089 .050 .448 - .566 - MODEL 2 (Diener et al., 2010)
Single Factor with error cov. 38.35 14 2.74 .970 .939 .044 .027 .061 .028 .400 - .589 - MODEL 3 Two-Factor 58.99 15 3.93 .945 .897 .057 .042 .072 .034 .480 - .646 .517 - .598 .779
Factor 1 = Items 1, 3, 7, Factor 2 = items 2, 4, 5, 6, 8, FI = Factor intercorrelations; Estimator = MLR; Bold indicates optimal model fit.
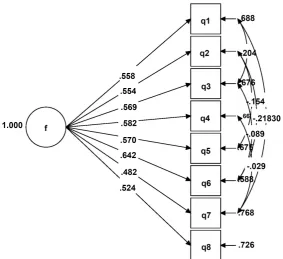
The optimal FS structure that emerged from the CFA 1 subsample was the single factor proposed by Diener et al. (2010)with error covariances added. This model was successfully validated in the new subsample of equal power. All fit statistics were within acceptable limits achieving a good fit. Factor loadings were also within adequate limits (0.482 - 0.642). All model fit statistics are presented
in Table 4 and the path diagram in Figure 1.
3.6. Measurement Invariance
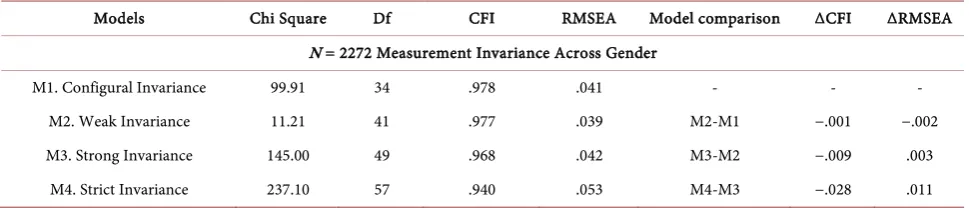
In this phase of the 3-faced construct validation method, we used the optimal FS model cross-validated in the CFA 2 subsample (40%, n = 910) as a baseline model to test strict measurement invariance across gender in the entire sample (N = 2272). The following measurement invariance criteria were used: ΔCFI ≤ −.01, and ΔRMSEA ≤ .015 (Chen, 2007).
First, the single factor FS model with error covariances was tested separately in each gender group (males, N = 832 versus females, N = 1440), to establish a baseline model. This model had a good fit for males and equally good for fe-males (see baseline model in Table 8). Then, this unidimensional model was tested concurrently in both gender groups (M1) presenting a good fit (see nested models in Table 6), therefore configural invariance was confirmed. Next, to examine weak invariance, factor loadings were constrained to equality. As pre-sented in Table 6, ΔCFI and ΔRMSEA for this nested model (M2) supported weak invariance. Subsequently, indicator intercepts were constrained to equality (M3), and both ΔCFI and ΔRMSEA suggested strong invariance. Finally, for the ultimate test of measurement invariance—strict invariance (Wang & Wang
2012)—indicator residuals were constrained to equality. The nested model
comparison showed that strict measurement invariance could not be supported, with ΔCFI (but not ΔRMSEA) too high to be acceptable (See Table 5 and Table 6).
3.7. Reliability and AVE Validity
DOI: 10.4236/psych.2018.97105 1800 Psychology Figure 1. The path of the optimal, unidimensional model with error covariances for FS confirmed in CFA 1 and cross-validated in CFA 2 in a sample of equal power.
Table 4. Model fit for the optimal model for FS in CFA 1 in a different subsample of equal power.
Model Value χ2 df χ2 χdf CFI TLI RMSEA 2/ RMSEA Lower CI
RMSEA Higher
CI SRMR
Factor 1
Loadings Loadings Factor 2 FI
CFA2 Sample (n = 910) MODEL 2 (Diener et al., 2010)
Single Factor with error cov. 50.00 14 3.57 .960 .921 .053 .038 .069 .029 .482 - .642 -
Factor 1 = Items 1, 3, 7, Factor 2 = items 2, 4, 5, 6, 8, FI = Factor intercorrelations; Estimator = MLR; Error Covariances added were item 7 - 1, item 7 - 4, item 3 - 1, item 5 - 2, item 6 - 3, item 6 - 2.
Table 5. FS Baseline model for measurement invariance across gender.
Model Chi-Square/Value Chi-Square/df Chi-square/df CFI TLI RMSEA Lower CI RMSEA Higher CI SRMR RMSEA
N = 2272 MODEL 1a (ONLY MALES)
Single factor with error Cov. 44.91 19 2.36 .974 .962 .040 .025 .056 .028 MODEL 1b (ONLY FEMALES)
MLR Single factor with error Cov 55.76 15 3.72 .980 .963 .043 .032 .056 .023
Estimator = MLR.
[image:12.595.56.540.526.622.2]DOI: 10.4236/psych.2018.97105 1801 Psychology Table 6. Fit Measures of the nested models tested to establish measurement invariance of FS.
Models Chi Square Df CFI RMSEA Model comparison ΔCFI ΔRMSEA N = 2272 Measurement Invariance Across Gender
M1. Configural Invariance 99.91 34 .978 .041 - - - M2. Weak Invariance 11.21 41 .977 .039 M2-M1 −.001 −.002 M3. Strong Invariance 145.00 49 .968 .042 M3-M2 −.009 .003
M4. Strict Invariance 237.10 57 .940 .053 M4-M3 −.028 .011
Estimator = MLR.
(Hair et al., 2010); 3) Average Variance Extracted (AVE; Fornell & Larcker,
1981) to evaluate convergent validity. Omega alone is unstable reliability meas-ure, permitting a potential error variance, as high as 50%. AVE in combination with ω coefficient offers a more reliable measure of convergent validity
(Malho-tra & Dash, 2011). The suggested cutoff value for AVE is .50 (Fomell & Larcker,
1981; Hair et al., 2010; Awang et al., 2015).
The internal reliability for all 8 items of FS in the total sample (N = 2272), measured by Cronbach’s alpha was α = .81. Omega Total reliability (McDonalds, 1999; Werts, Lim, & Joreskog, 1974) was .75 and AVE was .28. In the three sub-samples (nEFA = 452, nCFA1 = 910, nCFA2 = 910) Cronbach’s alpha was .79, .74,
and .78 respectively.
3.8. Correlation Analysis to Examine Convergent and
Discriminant Validity
The relationship between FS and other constructs was examined over the total sample (N = 2272). Constructs evaluated were categorized in five groups: 1) mental distress with the 3 dimensions of the DASS-21 (Lovibond & Lovibond,
1995) and the DASS-9(Yusoff, 2013; Kyriazos et al., 2018a); 2) well-being,
in-cluding WEMWBS (Tennant et al., 2007), MHC-SF (Keyes, 2008), and Satisfac-tion with life Scale (SWLS; Diener et al., 1985); 3) Affect measures comprising the Scale of Positive and Negative Experiences (SPANE; Diener et al., 2010) and SPANE-8 (Kyriazos et al., 2018b); 4) positivity scales comprising trait HOPE
(Snyder et al., 1991), Brief Resilience Scale (BRS; Smith et al., 2008), Meaning in
life Questionnaire (MLQ; Steger et al., 2006) and Gratitude 6 Questionnaire
(McCullough et al., 2002); 5) The WHOQOL-BREF(WHOQOL Group, 1998a,
1988b). All correlations are presented in Table 7.
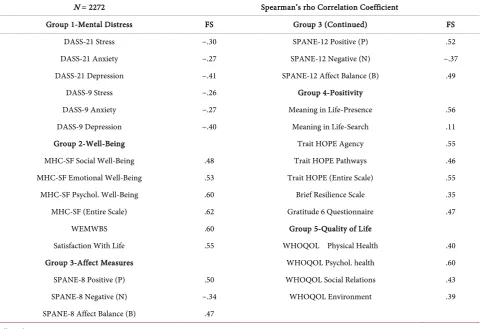
The correlations between FS and Group 1 (Mental Distress Scales) were nega-tive, ranged from moderate (−.26; DASS-21 Stress) to strong (−.41; DASS-21 Depression). The correlations between FS and Group 2 (Well-Being Scales) were on average strong (M = .56). Note that the strongest correlations were between FS and MHC-SF and WEMWB.
DOI: 10.4236/psych.2018.97105 1802 Psychology and SPANE-12 P, SPANE-12 N and SPANE-12 B were moderately strong, .52, –.37 and .49 respectively. Group 4 (Positivity Measures) showed positive, weak to strong correlations with FS. HOPE and Presence of Meaning were at the highest end of the range and Search for Meaning at the lowest. Regarding the correlations of FS with Group 5 (Quality of life Scales), FS had on average strong correlation with them (M = .46). All values were significant at p < 0.01 level (see
Table 7 for details).
3.9. Evaluation of Well-Being Models
The following two well-being models were tested in the entire sample (N = 2272).
The Tripartite Model of Mental well-being (Keyes, 2002)
The Tripartite model of hedonic and eudaimonic well-being was evaluated using FS and SPANE (Diener et al., 2010). It was hypothesized that FS will be equivalent to PWB and SPANE to SWB since Flourishing, PWB, and SWB are related to the eudaimonic facet of well-being. In turn, SPANE and SWB are in-terconnected to the hedonic facet of well-being (Singh et al., 2017). Table 8 presents the goodness-of-fit indices for this Tripartite model. The fit of this model was acceptable and factor intercorrelations found were the following:
Table 7. Bivariate Correlations between FS and other measures.
N = 2272 Spearman’s rho Correlation Coefficient
Group 1-Mental Distress FS Group 3 (Continued) FS DASS-21 Stress −.30 SPANE-12 Positive (P) .52 DASS-21 Anxiety −.27 SPANE-12 Negative (N) −.37 DASS-21 Depression −.41 SPANE-12 Affect Balance (B) .49
DASS-9 Stress −.26 Group 4-Positivity
DASS-9 Anxiety −.27 Meaning in Life-Presence .56 DASS-9 Depression −.40 Meaning in Life-Search .11
Group 2-Well-Being Trait HOPE Agency .55
MHC-SF Social Well-Being .48 Trait HOPE Pathways .46 MHC-SF Emotional Well-Being .53 Trait HOPE (Entire Scale) .55 MHC-SF Psychol. Well-Being .60 Brief Resilience Scale .35 MHC-SF (Entire Scale) .62 Gratitude 6 Questionnaire .47
WEMWBS .60 Group 5-Quality of Life
Satisfaction With Life .55 WHOQOL Physical Health .40 Group 3-Affect Measures WHOQOL Psychol. health .60 SPANE-8 Positive (P) .50 WHOQOL Social Relations .43 SPANE-8 Negative (N) −.34 WHOQOL Environment .39 SPANE-8 Affect Balance (B) .47
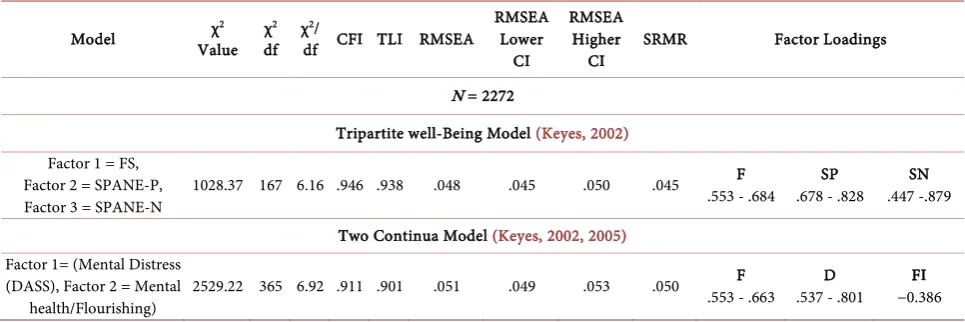
DOI: 10.4236/psych.2018.97105 1803 Psychology Table 8. Well-Being Models with FS, SPANE (Diener et al., 2010) and DASS-21 (Lovibond & Lovibond, 1995).
Model Value χ2 χdf 2 χdf CFI TLI RMSEA 2/ RMSEA Lower CI
RMSEA Higher
CI SRMR Factor Loadings N = 2272
Tripartite well-Being Model (Keyes, 2002)
Factor 1 = FS, Factor 2 = SPANE-P,
Factor 3 = SPANE-N 1028.37 167 6.16 .946 .938 .048 .045 .050 .045
F
.553 - .684 .678 - .828 SP .447 -.879 SN
Two Continua Model (Keyes, 2002,2005)
Factor 1= (Mental Distress (DASS), Factor 2 = Mental
health/Flourishing) 2529.22 365 6.92 .911 .901 .051 .049 .053 .050
F
.553 - .663 .537 - .801 D −0.386 FI
Estimator = MLR, FI= Factor Intercorrelations, F = FS, SP = SPANE Positive, SN = SPANE Negative, D = DASS-21.
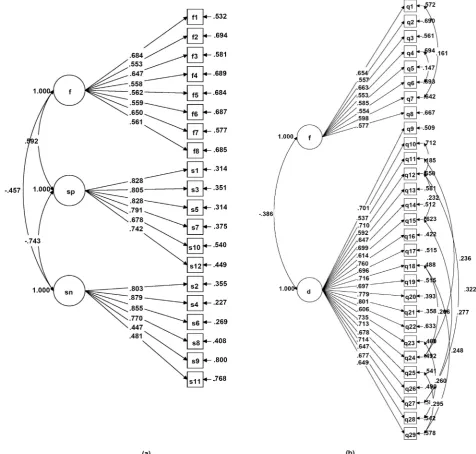
SPANE-P to FS .592, SPANE-N to FS −.457, and SPANE-N to SPANE-P −.743. Fit measures and Factor Loadings for the models are presented in Table 8 and path diagram in Figure 2(a).
The Two-Continua Model(Keyes, 2002, 2005)
The two-continua model (Keyes, 2002,2005) suggests that mental health and mental illness are two distinct but correlated dimensions, but not two opposite ends of a single continuum (Keyes et al., 2008). In other words, it graphically presents the central assumption of Positive Psychology, i.e. that wellbeing is not the absence of ill-being (Seligman & Csikszentmihalyi, 2000; Seligman, 2002;
Se-ligman, 2011).
In order to obtain evidence for the two continua model (Keyes, 2005), a CFA was carried out using the FS to measure mental health and the three DASS di-mensions (Lovibond & Lovibond, 1995) to measure mental illness (See Table 6
and Figure 2(b)). Specifically, we created a two factor model where factor 1 was
mental health represented by FS (Diener et al., 2010), and factor 2 was mental distress represented by DASS-21 (Lovibond & Lovibond, 1995) with three di-mensions collapsed in one. This two-factor model using FS and DASS-21 in two correlated factors showed acceptable fit. The correlation of FS and DASS was −.386. Mental Health dimension (FS) had factor loadings ranging from .553 to .663 while Mental Illness (DASS) had factor loadings range from .537 to .801(see Table 8 and Figure 2(b)).
3.10. Standardization of FS Scores
The means for the FS in the total sample (N = 2272) are presented in Table 9. Our data were non-normality distributed, thus means were not representative of FS scores (Crawford & Henry, 2004). Therefore, Table 9 converts FS scores to percentiles. The 50% of the respondents scored ≤ 46. For the original FS, more than half of the respondents (53%) in the US also scored ≤ 46, range 8 - 56
DOI: 10.4236/psych.2018.97105 1804 Psychology Figure 2. (a) Path diagram of the The Tripartite Model of Mental well-being (Keyes, 2002) using FS and SPANE (Diener et al., 2010), and (b) Path diagram of the Two-Continua Model (Keyes, 2002, 2005) using FS to measure mental well-being and DASS-21
(Lovibond & Lovibond, 1995) to measure mental distress. F = FS, SP = SPANE Positive, SN = SPANE Negative, D = DASS-21.
Table 9. Summary statistics and FS raw scores converted to percentiles.
N = 2272 Mean(SD) Range Percentile
10 20 25 30 40 50 60 70 75 80 90 FS 45.52 (6.02) 11-56 38 41 42 43.9 45 46 48 49 50 50 52
4. Discussion
The purpose of the present study was to validate the Flourishing scale (Diener et
[image:16.595.57.542.611.665.2]DOI: 10.4236/psych.2018.97105 1805 Psychology construct validation procedure called “3-faced construct validation method”
(Kyriazos et al., 2018a,2018b). First the sample was split (Guadagnoli & Velicer,
1988; MacCallum, Browne, & Sugawara, 1996) in three subsamples (20% for
EFA, 40% for a first CFA (CFA1) and 40% for a second equal-power CFA (CFA 2)]. Generally, sample-splitting is considered to be a cross-check method of con-struct validity (Brown, 2015;Byrne, 2010). The sample power was multiple times above the proposed limits (Osborne & Costello, 2004; Schumacker & Lomax,
2015;Singh et al., 2016; DeVellis, 2017) suggesting that factor loadings had
ro-bustness (Linley et al., 2009;Kline, 2016). In the first 20% part a factor structure was established with EFA. Two models were extracted in this phase. The unidi-mensional FS structure proposed by Diener et al. (2010)and a two-factor model with factor 1 containing items 1, 3, and 7 and factor 2 containing items 2, 4, 5, 6 and 8. Models showed a hardly tolerable fit, with some goodness-of-fit measures beyond acceptability (TLI, and RMSEA).
Next, we examined the FS factor structure further in the second subsample (40%) using Confirmatory Factor Analysis. This was the second phase of the
3-faced construct validation method. Three ICM-CFA models were tested
be-cause single factor ESEM models are equivalent to the ICM-CFA models
(Asparouhov & Muthen 2009; Marsh et al., 2014). Similarly, the single factor
structure of FS excluded the possibility of evaluating higher order structures like second order CFA (Wang & Wang, 2012). The optimal FS structure that emerged from the CFA 1 subsample was the single factor proposed by Diener et
al. (2010) with error covariances added. The model had goodness-of-fit
meas-ures in satisfactory levels. Error covariances were added in item 7 with item 1, in item 7 with item 4, in item 3 with item 1, in item 5 with item 2, in item 6 with item 3, and in item 6 with item 2. Generally, error covariances are regarded an overfitting when theoretically unfounded, however in this case FS is a unification of different well-being theories and error covariance is at some extend tolerable to account for content overlap and complexity of the theories.
In the next phase of the 3-faced construct validation method, we cross-validated the optimal unidimensional model of FS confirmed in the CFA 1 subsample (40%) in a different subsample (CFA 2) of equal power (40%). This model also showed a good fit with all goodness-of-fit measures in acceptable values. This unidimensional solution is a widely validated factor structure for FS in the west-ern cultures like Italian (Giuntoli et al., 2017) and Portuguese (Silva & Caetano, 2013), Asian cultures like Japanese (Sumi, 2014) and Indian (Singh et al., 2017), or Eastern cultures like Iranian (Khodarahimi, 2013). Thus, this unidimensional structure has been successfully adapted in both collectivistic and individualistic cultural contexts(Hofstede, 2001;Triandis, 1995).
DOI: 10.4236/psych.2018.97105 1806 Psychology were supported. Strict measurement invariance was partially supported. Mea-surement invariance is a very important property for a measure because it sug-gests that no measurement bias exist when measuring males and females
(Da-masio & Koller, 2015).
Additionally, we evaluated the reliability and validity of FS with the following three measures: 1) Cronbach’s alpha (Cronbach, 1951) to assess internal consis-tency; 2) Omega Total coefficient (ω total; McDonald, 1999;Werts, Lim, &
Jo-reskog, 1974) to examine construct reliability(Hoque et al., 2017); and 3)
Aver-age Variance Extracted (AVE; Fornell & Larcker, 1981) to evaluate convergent validity. Internal consistency reliability of the Greek adaptation of FS was ade-quate, achieving a value ≥ .80 (Nunnally & Berstein, 1994). Cronbach’s alpha was comparable to the values reported by Diener et al. (2010) and other studies (e.g. Singh et al., 2017). Omega reliability was equally satisfactory. This was not the case with AVE. Nevertheless, FS was designed to measure a different mental well-being dimension per item (Diener et al., 2010), so a low AVE is probably not surprising, because AVE is an indicator of converged validity (Malhotra &
Dash, 2011).
Convergent and discriminant validity were evaluated using 12 measures di-vided in five groups: 1) mental distress with the 3 factors of the DASS-21
(Lovi-bond & Lovi(Lovi-bond, 1995) and the DASS-9 (Yusoff, 2013;Kyriazos et al., 2018a),
namely Depression, Anxiety and Stress; 2) well-being, including Warwick- Edinburgh Mental Well-being Scale (WEMWBS; Tennant et al., 2007), Mental Health Continuum-Short Form (MHC-SF; Keyes, 2008), and Satisfaction with life Scale (SWLS; Diener et al., 1985); 3) Affect measures comprising the Scale of Positive and Negative Experiences (SPANE;Diener et al., 2010) and SPANE-8, a briefer version of SPANE (Kyriazos et al., 2018b); 4) positivity scales comprising trait HOPE(Snyder et al., 1991), Brief Resilience Scale (BRS; Smith et al., 2008), Meaning in life Questionnaire (MLQ; Steger et al., 2006) and Gratitude 6 Ques-tionnaire (McCullough et al., 2002); and 5) Quality of life dimensions by
WHOQOL-BREF (WHOQOL Group, 1998a, 1998b). FS showed moderate to
strong negative correlation with mental distress dimensions, with Depression at the highest negative value. FS had on average strong correlations with Well-Being Scales. The relationship between FS and MHC-SF (Keyes, 2008) and between FS and WEMWB (Tennant et al., 2007) had the strongest magnitude. Concerning the correlations between FS and affect measures (SPANE; Diener et
al., 2010), they were on average of moderate to strong magnitude. Positivity
measures of hope, life meaning and gratitude had a positive correlation with FS ranging from weak (MLQ Search for meaning in life; Steger et al., 2006) to strong (MLQ Presence of meaning in life and Trait Hope; Snyder et al., 1991). Finally, the correlations of FS with dimensions of life quality (WHOQOL-BREF;
WHOQOL Group, 1998a,1998b) were on average strong. Generally, the
magni-tude of the positive correlations ranged from low (MLQ Search for meaning in life; Steger et al., 2006) to strong (MHC-SF by Keyes, 2008 and WEMWBS by
DOI: 10.4236/psych.2018.97105 1807 Psychology
2017).
Moreover, two well-being models were evaluated. First, we replicated the Tri-partite well-being model. This model had FS in one factor, SPANE Positive Ex-periences on a second factor and SPANE negative ExEx-periences on a third factor. This composite structure has also been evaluated using FS and SPANE (Diener et al., 2010) by Singh et al. (2017) in an Indian sample and by Howell and Buro (2015) and Giuntoli et al. (2017) in an Italian sample. The models had an ac-ceptable fit with a factor intercorrelation below the cutoff value of .80. These re-sults support the hypothesis that mental well-being can be represented by three distinct but related dimensions using FS to measure mental health. This is in line with previous studies using FS (Singh et al., 2017;Howell & Buro, 2015) and with other measures of well-being too (Joshanloo, 2017).
Second, the Two Continua well-being model was evaluated. Originally attri-buted to Keyes (2002, 2005), this model suggests that mental health and mental illness are not opposite poles of the same dimension but two distinct but related constructs. Essentially this is the core assumption of Positive Psychology, that wellbeing is not merely the absence of ill-being (Seligman & Csikszentmihalyi, 2000; Seligman, 2002; Seligman, 2011), i.e. it is not a zero-sum game. The model here had DASS (Lovibond & Lovibond, 1995) in one factor as a mental distress dimension and FS as a well-being dimension in a second oblique factor. This model showed good fit suggesting that the Two Continua model is tenable in this cultural context using FS to measure mental health. Similar models—using MHC-FS as the mental health dimension—have been proposed by Keyes et al.
(2008) and replicated by Petrillo et al. (2015), and Perugini, Iglesiaa, Solanoa, &
Keyes (2017).
5. Conclusion
Finally, the general conclusion of this work is that the unidimensional structure of FS established by Diener et al. (2010) is confirmed in the Greek cultural con-text. The FS showed satisfactory psychometric properties and it is a reliable and valid well-being measure. FS Greek, as proposed by Diener et al. (2010) can complement the existing subjective well-being measures, as a brief measure of eudaimonic well-being. Another important finding is that the Greek adaptation of FS is gender equivalent.
DOI: 10.4236/psych.2018.97105 1808 Psychology as suggested by Byrne (2010) and Brow (2015). All the above limitations consi-dered, in the present study reports strong evidence for the construct validity, measurement invariance across gender, reliability, convergent and discriminant validity of the FS, Greek version.
References
Asparouhov, T., & Muthen, B. (2009). Exploratory Structural Equation Modeling. Struc-tural Equation Modeling, 16, 397-438. https://doi.org/10.1080/10705510903008204
Awang, Z., Afthanorhan, A., & Asri, M. A. M. (2015). Parametric and Non Parametric Approach in Structural Equation Modeling (SEM): The Application of Bootstrapping.
Modern Applied Science, 9, 58-67.https://doi.org/10.5539/mas.v9n9p58
Bentler, P. M., & Yuan, K. H. (1999). Structural Equation Modeling with Small Samples: Test of Global Self-Esteem. Journal of Personality and Social Psychology, 89, 623-642. Brislin, R. W. (1970). Back-Translation for Cross-Cultural Research. Journal of Cross-
Cultural Psychology, 1, 185-216. https://doi.org/10.1177/135910457000100301
Brown, S. L., Nesse, R. M., Vinokur, A. D., & Smith, D. M. (2003). Providing Support May Be More Beneficial than Receiving It: Results from a Prospective Study of Mortal-ity. Psychological Science, 14, 320-327.https://doi.org/10.1111/1467-9280.14461
Brown, T. A. (2015). Confirmatory Factor Analysis for Applied Research (2nd ed.). New York, NY: Guilford Publications.
Byrne, B. M. (2010). Structural Equation Modeling with AMOS: Basic Concepts, Applica-tions, and Programming (2nd ed.). New York, NY: Routledge.
Carver, C. S., & Scheier, M. F. (2009) Optimism. In S. Lopez (Ed.), The Encyclopedia of Positive Psychology (pp. 656-663). Chichester: Blackwell Publishing Ltd.
https://doi.org/10.1093/oxfordhb/9780195187243.013.0028
Comrey, A. L., & Lee, H. B. (1992). A First Course in Factor Analysis (2nd ed.). Hillsdale, NJ: Erlbaum.
Cronbach, L. J. (1951). Coefficient Alpha and the Internal Structure of Tests. Psychome-trika, 16, 297-334. https://doi.org/10.1007/BF02310555
Csikszentmihalyi, M. (1990). Flow: The Psychology of Optimal Experience. New York, NY: Harper & Row.
Cummins, R. A. (2003). Normative Life Satisfaction: Measurement Issues and a Homeos-tatic Model. Social Indicators Research, 64, 225-256.
https://doi.org/10.1023/A:1024712527648
Damasio, B., & Koller, S. H. (2015). Meaning in Life Questionnaire: Adaptation Process and Psychometric Properties of the Brazilian Version. Revista Latinoamericana de Psi-cologia, 47, 185-195. https://doi.org/10.1016/j.rlp.2015.06.004
Deci, E. L., & Ryan, R. M. (2000). Self-Determination Theory and the Facilitation of In-trinsic Motivation, Social Development, and Well-Being. American Psychologist, 55,
68-78.https://doi.org/10.1037/0003-066X.55.1.68
Deci, E. L., & Ryan, R. M. (2008). Hedonia, Eudaimonia, and Well-Being: An Introduc-tion. Journal of Happiness Studies, 9, 1-11.https://doi.org/10.1007/s10902-006-9018-1
Delle Fave, A., Massimini, F., & Bassi, M. (2011). Psychological Selection and Optimal Experience across Cultures: Social Empowerment through Personal Growth. New York, NY: Springer.https://doi.org/10.1007/978-90-481-9876-4
DOI: 10.4236/psych.2018.97105 1809 Psychology
Hopkins Symptom Checklist (HSCL): A Self-Report Symptom Inventory. Behavioral Science, 19, 1-15.https://doi.org/10.1002/bs.3830190102
DeVellis, R. F. (2017). Scale Development: Theory and Applications (4th ed.). Thousand Oaks, CA: Sage.
Diener, E., & Lucas, R. (1999). Personality, and Subjective Well-Being. In D. Kahneman, E. Diener, & N. Schwarz (Eds.), Well-Being: The Foundations of Hedonic Psychology
(pp. 213-229). New York, NY: Sage.
Diener, E., Emmons, R. A., Larsen, R. J., & Griffin, S. (1985). The Satisfaction with Life Scale. Journal of Personality Assessment, 49, 71-75.
https://doi.org/10.1207/s15327752jpa4901_13
Diener, E., Napa Scollon, C., & Lucas, R. E. (2003). The Evolving Concept of Subjective Well-Being: The Multifaceted Nature of Happiness. Advances in Cell Aging and Ger-ontology, 15, 187-219.https://doi.org/10.1016/S1566-3124(03)15007-9
Diener, E., Wirtz, D., Biswas-Diener, R., Tov, W., Kim-Prieto, C., Choi, D. et al. (2009). New Measures of Well-Being. In E. Diener (Ed.), Assessing Well-Being: The Collected Works of Ed Diener (pp. 247-266). New York, NY: Russell Sage Foundation.
https://doi.org/10.1007/978-90-481-2354-4_12
Diener, E., Wirtz, D., Tov, W., Kim-Prieto, C., Choi, D. W., Oishi, S. et al. (2010). New Well-Being Measures: Short Scales to Assess Flourishing and Positive and Negative Feelings. Social Indicators Research, 97, 143-156.
https://doi.org/10.1007/s11205-009-9493-y
Doornik, J. A., & Hansen, H. (2008). An Omnibus Test for Univariate and Multivariate Normality. Oxford Bulletin of Economics and Statistics, 70, 927-939.
https://doi.org/10.1111/j.1468-0084.2008.00537.x
Fordyce, M. W. (1977). The Happiness Measures: A Sixty-Second Index of Emotional Well-Being and Mental Health. Unpublished Manuscript, St. Meyers, FL: Edison Com-munity College.
Fordyce, M. W. (1988). A Review of Research on Happiness Measures: A Sixty Second Index of Happiness and Mental Health. Social Indicators Research, 20, 355-381. https://doi.org/10.1007/BF00302333
Fornell, C., & Larcker, D. F. (1981). Structural Equation Models with Unobservable Va-riables and Measurement Error: Algebra and Statistics. Journal of Marketing Research, 18, 382-388. https://doi.org/10.2307/3150980
Giuntoli, L., Ceccarini, F., Sica, C., & Caudek, C. (2017). Validation of the Italian Ver-sions of the Flourishing Scale and of the Scale of Positive and Negative Experience.
SAGE Open, 7, 1-12.https://doi.org/10.1177/2158244016682293
Guadagnoli, E., & Velicer, W. F. (1988). Relation to Sample Size to the Stability of Com-ponent Patterns. Psychological Bulletin, 103, 265.
https://doi.org/10.1037/0033-2909.103.2.265
Hair, J., Black, W., Babin, B., & Anderson, R. (2010). Multivariate Data Analysis (7th ed.). Upper Saddle River, NJ: Prentice-Hall, Inc.
Henry, J. D., & Crawford, J. R. (2005). The Short-Form Version of the Depression Anxie-ty Stress Scales (DASS-21): Construct ValidiAnxie-ty and Normative Data in a Large Non-Clinical Sample. British Journal of Clinical Psychology, 44, 227-239.
https://doi.org/10.1348/014466505X29657
DOI: 10.4236/psych.2018.97105 1810 Psychology
Hofstede, G. (2001). Culture’s Consequences: Comparing Values, Behaviors, Institutions, and Organizations across Nations (2nd ed.). Thousand Oaks, CA: Sage.
Hoque, A. S., Awang, Z., Jusoff, K., Salleh, F., & Muda, H. (2017). Social Business Effi-ciency: Instrument Development and Validation Procedure Using Structural Equation Modeling. International Business Management, 11, 222-231.
Howell, A. J., & Buro, K. (2015). Measuring and Predicting Student Well-Being: Further Evidence in Support of the Flourishing Scale and the Scale of Positive and Negative Experiences. Social Indicators Research, 121, 903-915.
https://doi.org/10.1007/s11205-014-0663-1
Hu, L., & Bentler, P. M. (1999). Cutoff Criteria for Fit Indexes in Covariance Structure Analysis: Conventional Criteria versus New Alternatives. Structural Equation Model-ing, 6, 1-55. https://doi.org/10.1080/10705519909540118
IBM (2017). IBM SPSS Statistical Software, Release 25. Spring House, PA: IBM Corpora-tion.
Joshanloo, M. (2017). Structural and Discriminant Validity of the Tripartite Model of Mental Well-Being: Differential Relationships with the Big Five Traits. Journal of Mental Health, 1-7.https://doi.org/10.1080/09638237.2017.1370633
Keyes, C. L. M. (2002). The Mental Health Continuum: From Languishing to Flourishing in Life. Journal of Health and Social Behavior, 43, 207-222.
https://doi.org/10.2307/3090197
Keyes, C. L. M. (2005). Mental Illness and/or Mental Health? Investigating Axioms of the Complete State Model of Health. Journal of Consulting and Clinical Psychology, 73,
539-548. https://doi.org/10.1037/0022-006X.73.3.539
Keyes, C. L. M. (2009). Atlanta: Brief Description of the Mental Health Continuum- Shortform (MHC-SF). http://www.sociology.emory.edu/ckeyes/
Keyes, C. L. M., Wissing, M., Potgieter, J., Temane, M., Kruger, A., & van Rooy, S. (2008). Evaluation of the Mental Health Continuum-Short Form (MHC-SF) in Setswa-na-Speaking South Africans. Clinical Psychology and Psychotherapy, 15, 181-192. https://doi.org/10.1002/cpp.572
Keyes, C., Shmotkin, D., & Ryff, C. (2002). Optimizing Well-Being: The Empirical En-counter of Two Traditions. Journal of Personality and Social Psychology, 82, 1007-1022. https://doi.org/10.1037/0022-3514.82.6.1007
Khodarahimi, S. (2013). Hope and Flourishing in an Iranian Adults Sample: Their Con-tributions to the Positive and Negative Emotions. Applied Research in Quality of Life, 8, 361-372. https://doi.org/10.1007/s11482-012-9192-8
Kline, R. B. (2016). Principles and Practice of Structural Equation Modeling (4th ed.). New York, NY: The Guilford Press.
Kyriazos, T. A., Stalikas, A., Prassa, K., & Yotsidi, V. (2018a). Can the Depression Anxiety Stress Scales Short Be Shorter? Factor Structure and Measurement Invariance of DASS-21 and DASS-9 in a Greek, Non-Clinical Sample. Psychology, 9, 1095-1127. https://doi.org/10.4236/psych.2018.95069
Kyriazos, T. A., Stalikas, A., Prassa, K., & Yotsidi, V. (2018b). A 3-Faced Construct Vali-dation and a Bifactor Subjective Well-Being Model Using the Scale of Positive and Negative Experience, Greek Version. Psychology, 9, 1143-1175.
https://doi.org/10.4236/psych.2018.95071
DOI: 10.4236/psych.2018.97105 1811 Psychology
https://doi.org/10.1002/jclp.20741
Lim, Y. J. (2014). Psychometric Characteristics of the Korean Mental Health Conti-nuum—Short Form in an Adolescent Sample. Journal of Psychoeducational Assess-ment, 32, 356-364.https://doi.org/10.1177/0734282913511431
Linley, P. A., Maltby, J., Wood, A. M., Osborne, G., & Hurling, R. (2009). Measuring Happiness: The Higher Order Factor Structure of Subjective and Psychological Well- Being Measures. Personality and Individual Differences, 47, 878-884.
https://doi.org/10.1016/j.paid.2009.07.010
Lovibond, S. H., & Lovibond, P. F. (1995). Manual for the Depression Anxiety Stress Scales. Sydney: Psychology Foundation.
Lyubomirsky, S., & Lepper, H. (1999) A Measure of Subjective Happiness: Preliminary Reliability and Construct Validation. Social Indicators Research, 46, 137-155.
https://doi.org/10.1023/A:1006824100041
MacCallum, R. C., Browne, M. W., & Sugawara, H. M. (1996). Power Analysis and De-termination of Sample Size for Covariance Structure Modeling. Psychological Methods, 1, 130. https://doi.org/10.1037/1082-989X.1.2.130
Malhotra, N. K., & Dash, S. (2011). Marketing Research an Applied Orientation. London: Pearson Publishing.
Mardia, K. V. (1970). Measures of Multivariate Skewness and Kurtosis with Applications.
Biometrika, 57, 519-530. https://doi.org/10.1093/biomet/57.3.519
Marsh, H. W., Morin, A. J. S., Parker, P. D., & Kaur, G. (2014). Exploratory Structural Equation Modeling: An Integration of the Best Features of Exploratory and Confirma-tory Factor Analysis. Annual Review of Clinical Psychology, 10, 85-110.
https://doi.org/10.1146/annurev-clinpsy-032813-153700
Massey, F. J. (1951). The Kolmogorov-Smirnov Tests for Goodness of Fit. Journal of American Statistical Association, 46, 68-78.
https://doi.org/10.1080/01621459.1951.10500769
McCullough, M. E., Emmons, R. A., & Tsang, J. (2002). The Grateful Disposition: A Conceptual and Empirical Topography. Journal of Personality and Social Psychology, 82, 112-127. https://doi.org/10.1037/0022-3514.82.1.112
McDonald, R. P. (1999). Test Theory: A Unified Treatment. Mahwah, NJ: Erlbaum. Muthen, B., & Asparouhov, T. (2002). Using Mplus Monte Carlo Simulations in Practice:
A Note on Non-Normal Missing Data in Latent Variable Models. Mplus Web Notes: No. 2.
Muthen, L. K., & Muthen, B. O. (2012). Mplus Statistical Software, 1998-2012. Los An-geles, CA: Muthén & Muthén.
Nunnally, J., & Berstein, I. (1994). Psychometric Theory. New York, NY: McGraw-Hill. Osborne, J. W., & Costello, A. B. (2004). Sample Size and Subject to Item Ratio in
Prin-cipal Components Analysis. Practical Assessment, Research & Evaluation, 9, 8. Pavot, W., & Diener, E. (1993). The Affective and Cognitive Context of Self-Reported
Measures of Subjective Well-Being. Social Indicators Research, 28, 1-20. https://doi.org/10.1007/BF01086714
Perugini, M. L. L., de la Iglesiaa, G., Solanoa, A. C., & Keyes, C. L. M. (2017). The Mental Health Continuum-Short Form (MHC-SF) in the Argentinean Context: Confirmatory Factor Analysis and Measurement Invariance. Europe’s Journal of Psychology, 13, 93- 108. https://doi.org/10.5964/ejop.v13i1.1163
Conti-DOI: 10.4236/psych.2018.97105 1812 Psychology
nuum-Short Form (MHC-SF) as a Measure of Well-Being in the Italian Context. Social Indicators Research, 121, 291-312.https://doi.org/10.1007/s11205-014-0629-3
Putnam, R. D. (2000). Bowling Alone. New York, NY: Simon &Schuster. https://doi.org/10.1145/358916.361990
Ryan, R. M., & Deci, E. L. (2001). On Happiness and Human Potentials: A Review of Re-search on Hedonic and Eudaimonic Wellbeing. Annual Review of Psychology, 52,
141-166.https://doi.org/10.1146/annurev.psych.52.1.141
Ryff, C. D. (1989). Happiness Is Everything, or Is It? Explorations on the Meaning of Psychological Wellbeing. Journal of Personality and Social Psychology, 57, 1069-1081. https://doi.org/10.1037/0022-3514.57.6.1069
Ryff, C. D., & Keyes, C. L. M. (1995). The Structure of Psychological Well-Being Revi-sited. Journal of Personality and Social Psychology, 69, 719-727.
https://doi.org/10.1037/0022-3514.69.4.719
Scheier, M. F., Carver, C. S., & Bridges, M. W. (1994). Distinguishing Optimism from Neuroticism (and Trait Anxiety, Self-Mastery, and Self-Esteem): A Reevaluation of the Life Orientation Test. Journal of Personality and Social Psychology, 67, 1063-1078. https://doi.org/10.1037/0022-3514.67.6.1063
Schumacker, R. E., & Lomax, R. G. (2015). A Beginner’s Guide to Structural Equation Modeling (4th ed.). New York, NY: Routledge.
Seligman, M. E. P. (2002). Authentic Happiness: Using the New Positive Psychology to Realize Your Potential for Lasting Fulfillment. New York, NY: Free Press.
Seligman, M. E. P. (2011). Flourish: A Visionary New Understanding of Happiness and Well-Being. New York, NY: Simon & Schuster.
Silva, A., & Caetano, A. (2013). Validation of the Flourishing Scale and Scale of Positive and Negative Experience in Portugal. Social Indicators Research, 110, 469-478. https://doi.org/10.1007/s11205-011-9938-y
Singh, K., Junnarkar, M., & Jaswal, S. (2017). Validating the Flourishing Scale and the Scale of Positive and Negative Experience in India. Mental Health, Religion & Culture, 19, 943-954.https://doi.org/10.1080/13674676.2016.1229289
Singh, K., Junnarkar, M., & Kaur, J. (2016). Measures of Positive Psychology, Develop-ment and Validation. Berlin: Springer.https://doi.org/10.1007/978-81-322-3631-3
Singh, K., Ruch, W., & Junnarkar, M. (2014). Effect of Demographic Variables and Psy-chometric Properties of the Personal Well-Being Index for School Children in India.
Child Indicators Research, 7, 1-15.
Skevington, S. M., Lotfy, M., & O’Connell, K. A. (2004). The World Health Organiza-tion’s WHOQOL-BREF Quality of Life Assessment: Psychometric Properties and Re-sults of the International Field Trial: A Report from the WHOQOL Group. Quality of Life Research, 13, 299-310.https://doi.org/10.1023/B:QURE.0000018486.91360.00
Smith, B. W., Dalen, J., Wiggins, K., Tooley, E., Christopher, P., & Bernard, J. (2008). The Brief Resilience Scale: Assessing the Ability to Bounce Back. International Journal of Behavioral Medicine, 15, 194-200.https://doi.org/10.1080/10705500802222972
Snyder, C. R., Harris, C., Anderson, J. R., Holleran, S. A., Irving, L. M., Sigmon, S. T., Yoshinobu, L., Gibb, J., Langelle, C., & Harney, P. (1991). The Will and the Ways: De-velopment and Validation of an Individual-Differences Measure of Hope. Journal of Personality and Social Psychology, 60, 570-585.
https://doi.org/10.1037/0022-3514.60.4.570
DOI: 10.4236/psych.2018.97105 1813 Psychology
StataCorp (2015). Stata: Release 14. Statistical Software. College Station, TX: StataCorp. Steger, M. F., Frazier, P., Oishi, S., & Kaler, M. (2006). The Meaning in Life
Question-naire. Assessing the Presence of and Search for Meaning in Life. Journal of Counseling Psychology, 53, 80-93.https://doi.org/10.1037/0022-0167.53.1.80
Sumi, K. (2014). Reliability and Validity of Japanese Versions of the Flourishing Scale and the Scale of Positive and Negative Experience. Social Indicators Research, 118, 601-615. https://doi.org/10.1007/s11205-013-0432-6
Tennant, R., Hiller, L., Fishwick, R., Platt, S., Joseph, S. et al. (2007). The Warwick- Edinburgh Mental Well-Being Scale (WEMWBS): Development and UK Validation.
Health and Quality of Life Outcomes, 5, 63. https://doi.org/10.1186/1477-7525-5-63
Triandis, H. C. (1995). Individualism and Collectivism. Boulder, CO: Westview.
Wang, J., & Wang, X. (2012). Structural Equation Modeling. Hoboken, NJ: Wiley, Higher Education Press. https://doi.org/10.1002/9781118356258
Waterman, A. S. (2008). Reconsidering Happiness: A Eudaimonist’s Perspective. Journal of Positive Psychology, 3, 234-252.https://doi.org/10.1080/17439760802303002
Watson, D., Clark, L. A., & Tellegen, A. (1988). Development and Validation of Brief Measures of Positive and Negative Affect: The PANAS Scales. Journal of Personality and Social Psychology, 54, 1063-1070. https://doi.org/10.1037/0022-3514.54.6.1063
Werts, C. E., Linn, R. N., & Karl, G. J. (1974). Interclass Reliability Estimates: Testing Structural Assumptions, Educational and Psychological Measurement, 34, 25-33. https://doi.org/10.1177/001316447403400104
WHOQOL Group (1998a). The World Health Organization Quality of Life Assessment (WHOQOL): Development and General Psychometric Properties. Social Science & Medicine, 46, 1569-1585.https://doi.org/10.1016/S0277-9536(98)00009-4
WHOQOL Group (1998b). Development of the World Health Organization WHOQOL BREF Quality of Life Assessment. Psychological Medicine, 28, 551-558.
https://doi.org/10.1017/S0033291798006667