Abstract— We analyzed heartbeat-intervals with our own program of detrended fluctuation analysis (DFA) to quantify the irregularity of the heartbeat. The present analysis revealed that normal healthy subjects have the scaling exponent of 1.0, and ischemic heart disease pushes the scaling exponent up to 1.2 – 1.5. We conclude that the scaling exponent, calculated by the DFA, reflects a risk for the “failing” heart. The scaling exponents could determine whether the subjects are under sick or in healthy conditions on the basis of cardiac physiology.
Index Terms— DFA, Extra-systole, Heartbeat interval analysis, Ischemic heart disease.
I. INTRODUCTION
The cardiovascular disease is one of the biggest social health problems in advanced communities. For solving the problems, a lot of progresses have already been made. In the U. S., the death from coronary artery disease has substantially decreased in about 20 years, which is from 1980 to 2000 [1]. However, we must acknowledge that "silent heart attacks" still go often unnoticed and, unfortunately, in spite of progress of biomedical analysis techniques, more than 40% of heart attacks still go undiagnosed [2]. More research and experiments are necessary to improve diagnostic methods. We have done experiments on crustacean animal models (lobsters) using detrended fluctuation analysis (DFA). What we have shown was that the scaling exponent calculated by the DFA can well distinguish two types of hearts, one connected to and the other disconnected to the cardiac control center in the brain [3]. We also studied crab heartbeats in normal conditions and in terminal conditions when life was coming to an end. In those studies, we revealed that DFA could describe brain-heart interaction quantitatively [4]. Recently, we revealed that, at a high scaling exponent, ranging from about 1.2 to 1.5, myocardial damage, which is
Manuscript received June 11, 2008.
T. Yazawa is with Tokyo Metropolitan University, Hachioji, Tokyo 197-0397 Japan (corresponding author phone: +81-426771111; fax: +81-462392350, e-mail: [email protected]).
K. Tanaka is with Biomedical Cardiology Research Group, Tokyo Metropolitan University, (e-mail: [email protected]).
T. Katsuyama is also with Biomedical Cardiology Research Group, Tokyo Metropolitan University, and with Numazu Institute of Technology, Numazu, Shizuoka, Japan. (e-mail: [email protected]).
induced by accidental injury from implanted metal-electrodes, has triggered the crab’s heart sudden arrest. It occurred like "silent heart attacks." We thus have hypothesized that DFA is a useful method to diagnose the heart’s condition of model animals, even in human hearts. In order to calculate the scaling exponent quickly, without a complex keyboard manipulation of the PC, we developed a semi-automated DFA program, which works on the PC [5].
In this report we applied our DFA method to human subjects. The DFA distinguished two types of living/pumping hearts, one is: Normal hearts and the other is sick hearts, which have received a by-pass surgery or stent placement with the PCI (per cuteneous coronary intervention) due to ischemic heart failure.
II. METHODS A. Finger blood-pressure pulse
Heartbeats were recorded by a conventional method, either electrically or mechanically in our series of studies. From human subjects we mostly used the finger pulse recording with a Piezo-crystal mechanic-electric sensor, connected to a Power Lab System. (AD Instruments, Australia). All data were recorded at 1 KHz in rate of sampling.
B. DFA methods
We made our own programs for measuring beat-to-beat intervals and for calculating the approximate scaling exponent (DFA program). After recording pulses, we first made the beat-to-beat interval time series. Then, we calculated the approximate scaling exponent from the time series data. For preparing Figures in this report, we presented (1) heartbeat-data by plotting heart rates against time, which is the original data used for the analysis (DFA), (2) the approximate scaling exponents, which is the result of DFA, and (3) a graph. From the graph, one can read approximate a slope to which the exponent corresponds directly. As shown in the figures, beating hearts show a fluctuating pattern of intervals. One can recognize that we can hardly predict the scaling exponent by eye-observation of such time series data. Only a DFA program can do that. Thus, the DFA can find out hidden information carried by quantitative measures in a dynamically changing interval of heartbeat and velocity of blood flow under the functional control of the autonomic nervous system. An EKG-chart data cannot tell us what the
The Scaling Exponent Calculated by the
Detrended Fluctuation Analysis,
Distinguishes the Injured Sick Hearts
Against Normal Healthy Hearts
scaling exponent is. (Note: We believe that we could be able to sense the value of an exponent with our eyes from an instant recording if we have hundreds of experiences to watch both, real fluctuation data and the DFA results.) The DFA methods have already been documented [6, 8].
C. Background
The DFA is an analytical method in physics, based on the concept of “scaling” [7, 8]. The DFA was applied to understand a “critical phenomenon” [7, 9, 10]. Systems near critical points exhibit self-similar properties. Systems that exhibit self-similar properties are believed to be invariant under a transformation of scale. Finally, the DFA was expected to apply to any biological system, which has the property of scaling. Stanley and colleagues have considered that the heartbeat fluctuation is a phenomenon, which has the property of scaling. They first applied the scaling-concept to a biological data in the late 1980’s to early 1990’s [9, 10]. They emphasized on its potential utility in life science [10]. However, although the nonlinear method is increasingly advancing, a biomedical computation on the heart seems not to have matured technologically. Indeed we still ask us: Can we decode the fluctuations in cardiac rhythms to better diagnose a human disease?
D. DFA programs
We made our own programs for measuring the beat-to-beat intervals and for calculating the approximate scaling exponent of the interval time series. The concepts for computation have already been reported [6]. We describe it here on the most basic level.
Firstly, we obtain the heartbeat data digitized at 1 KHz. About 3,000 beats are necessary for a reliable calculation of an approximate scaling exponent. Usually a continuous record for about 50 minutes at a single testing is required. We use an EKG or finger pressure pulses.
Secondly, our own program captured pulse peaks. Using this program, we identified the true-heartbeat-peaks in terms of the time appearances of peaks. In this procedure we can reject unavoidable noise-false peaks. As a result we obtained a sequence of peak time {Pi}. This {Pi} involved all true-heartbeat-peaks from the first peak to the ending peaks, usually ca. 3,000 peaks.
Practically, by eye-observation on the PC screen, all real peaks were identified and all noise peaks (by movement of the subject) were eliminated. Experiences on neurobiology and cardiac physiology are necessary when deciding whether a spike-pulse is a cardiac signal or a noise signal. Finally, our eyes confirmed, read, these entire beats.
Thirdly, using our own program, intervals of the heartbeat {Ii}, such as the R-R intervals of an EKG, were calculated, which is defined as:
Fourth, the mean-interval was calculated, which is defined as:
where N is the total number of interval data.
Fifth, the fluctuation value was calculated by subtracting a mean value from each interval data, which is defined as:
Sixth, a set of beat-interval-fluctuation data {Bi} upon which we do the DFA, was obtained by adding each value derived from the equation (3), which is defined as:
Here the maximum number of i is the total number of the data point, i.e., the total number of peaks in a recording. In the next step, we determine a box size, τ (TAU), which represents the numbers of beats in a box and which can range from 1 to a maximum. Maximum TAU can be the total number of heartbeats to be studied. For the reliable calculation of the approximate scaling exponent, the number of total heartbeats is hopefully greater than 3,000. If TAU is 300, for example, we can obtain 10 boxes.
Seventh, we calculate the variance, successively, as expressed by Eqs. (5) and (6).
Here, n is the number of boxes at a box size τ (TAU). In each box, we performed the linear least-square fit with a polynomial function of 4th order. Then we made a detrended time series {B'i} as Eq. (5).
Here we adopted a method for “standard deviation analysis.” This method is probably the most natural method of variance detection [see ref 11]. Mathematically, this is a known method for studying “random walk” time-series.
The present DFA study is a typical example for the "random walk" analysis on the heartbeats.
Finally, eighth, we plotted a variance against the box size. Then the scaling exponent is calculated, by seeing in the slope portrayal. Most of the computations mentioned above, which are necessary to obtain the scaling exponent, are automated. The automatic program relatively quickly gives us an approximate scaling exponent. Although we cannot have a critical discussion if the exponent is mathematically and medically correct (i.e., whether a healthy heart has precisely 1.0, for example), we would like to insist that our automatic program is helpful and reliable to distinguish a normal state of the heart (scaling exponent exhibits near 1.0) from a sick state of the heart (high or low exponent). Consequently, we can distinguish the heart’s condition in three categories of the exponent: Normal, high, and low.
III. RESULTS
We report some case studies. In the figures, the slope shown in each graph (Variance vs. Box size), exhibits the scaling exponent.
A. Case 1
A subject (male age 65), whose heartbeats are shown in Fig. 1, once visited to us and told us that he had a problem with his heart. He did not give us any other information, but challenged us and ordered: “Check my heartbeat with your machine, and tell me if something is wrong with my heart.” We started measurement of his finger pulses. After a while, our DFA calculation gave us a certain conclusion: “High exponent.” The result of the analysis is shown in Fig. 1. Together with the observations of his pulse behavior (i.e., changes of pulses in rate and amplitude) on the screen, we convinced that he had a “failing heart” or a similar diagnosis. He asked: “What is wrong with my heart?” I felt I must tell him the truth. I replied to him: “According to our experience, I am sorry to tell you, that I diagnosed your heart and is indeed having a problem with its heartbeats. I wonder if there is a partially injured myocardium in your case, such as the ischemic heart.” After hearing my words, he was astonished and he mentioned what a cool system it is and how correct my interpretation is. He explained that attending team implanted a defibrillator to him, on account of the damage of an apex of the heart in its left ventricle. He continued: “Please call me if your analysis machine will be commercially available in the future. I will buy it.”
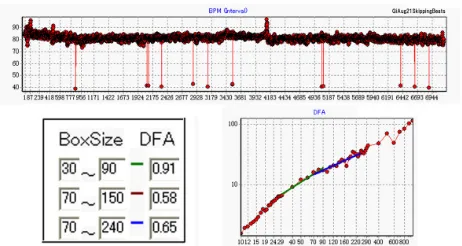
Most heart attacks (or stroke) start slowly. Sometimes they go away and return. Suffering from such a small heart failure damages the heart muscles. However, we often overlook the symptoms. So, people could have a progressive worsening of symptoms. If the symptom is mild, we hardly notice them. However, the heartbeat-fluctuation-patterns are exhibiting/insisting that here there is a “failing heart.” Case 1 story indeed provides evidence that we can notice if we use the DFA. Figure 1 shows that the man’s ischemic heart exhibited a high exponent 1.49 (box size, 30-140 beats), suggesting a serious heart disease.
Figure 1. A DFA of sick heart. Ischemic heart disease. The scaling exponent is high, see Box size 70-270. Male age 65.
B. Case 2
[image:3.595.319.536.55.174.2]The heart, which has already received emergency surgery of coronary arteries, exhibited a high exponent too (Fig. 2). Its exponent was 1.26 (box size, 30-140 beats).
Figure 2. Other example for the DFA of a sick heart. A subject, who had one stent placement and two bypass operations when he got heart attack. The scaling exponent is high, see Box size 30-270.
Male age 60.
C. Case 3
Normal hearts. Following examples show how a healthy heart behaves. The scaling exponents for normal hearts always exhibit the scaling exponent near 1.0 (fifty subjects age from 9 to 84, Japanese, White-American, Black-American, Iranian, Indonesian, White-European, have been tested). Two person’s cases studies are shown here (Fig. 4). Both graphs show that they had the scaling exponent of 1.0. Finger pulse data of one of the two subjects is shown (Fig. 3).
Figure 3. Finger pulse recording and heart rate for a normal healthy subject (male 25 years). The scaling exponent for this subject is 1.0,
[image:3.595.310.542.271.394.2] [image:3.595.309.554.586.719.2]Figure 4. Two DFA examples of normal hearts. Male age 50 (left) and male age 25 (right). See Eq. (5), where we performed the linear
least-square fit with a polynomial function of 1st to 4th order, but results were almost all the same and exponent were near 1.0.
D. Case 4
[image:4.595.306.547.51.247.2]Subjects who have arrhythmia, which is extra-systolic beats or so-called premature ventricular systolic beats. In this case, they are apparently normal subjects (male age 75, female 57, male 56, male 55, female 44), but they all exhibited arrhythmia (Fig. 5). All of them exhibited this abnormal beat less frequently, less than one time per min (or less than 30 times per hour) in number. Thus, in this frequency, this symptom of irregularity is nothing being serious according to professional's textbook, although it is understandable that everyone worries about that his or her hearts are beating in a manner of unpleasant feelings. However, it is not sick (see Lown and Wolf 1971, ref 13). All of their scaling exponents were discovered as lower than 1.0 (Fig. 6). It is apparent that subjects in Case 4 are different from those shown in Case 3.
Figure 5. An example record of arrhythmia. One extra-systolic beat can be seen near the end of the trace. Male age 75.
Figure 6. A DFA of extra-systolic heartbeats. Upper record shows 12-skipped heartbeat during the period of record, ca. 7,000 beats, lasting for about one and a half hour. The scaling exponent is low,
[image:4.595.51.287.69.184.2]less than 1.0. Female age 57.
Figure 7. DFA on the data with or without arrhythmic beats. A, Entire data. B, Analysis of entire data. C, Analysis of data, which eliminated the early part, which included two skipping arrhythmic beats. Female age 57. The same subject as shown in Fig. 6, but this
was recorded one year after Fig. 6 was taken.
The analysis of those hearts which exhibited arrhythmia (Figs. 5 and 6) suggested that a major cause of lowering the scaling exponent was the consequence of a skipping beat. We tested this hypothesis (Fig. 7). In Figure 7, two arrhythmic beats were recoded during ca. 5,500 beats (Fig. 7A). Analysis in shown in Fig. 7B, showed a low exponent like one year ago (Fig. 6). However, we discovered that the subject, who does not show any extra-systolic beats (Fig. 7B) but who used to have many extra-systolic beats (Fig. 6), showed a quite similar scaling exponent (compare Fig. 7A and Fig. 7B). This analysis suggests that the DFA does not watch a trivial part of data. Instead, the DAF watches a dynamical change over time, all period length of the data. A few skipping beats are not significantly affecting the results of the DFA.
IV. DISCUSSION
We need strategies to combat a disease. Although many cardiovascular diseases (CVD, heart attacks and strokes) are preventable through simple lifestyle measures, many countries only reimburse treatment and not prevention. Lifestyle measures are not costly and also confer major added value in terms of less obesity, diabetes as well as less CVD. Multidisciplinary approach is extremely important. Indeed, this correspondence, dealing with the DFA of the heartbeat, is resulting from a long string of biological experiments over decades of cardiovascular electro-physiological research on lobster-crab hearts [14-20].
[image:4.595.53.287.447.522.2] [image:4.595.49.280.558.681.2]a breaking event of a slow-down in heart rates, where an event lasts for seconds [18]. We got an idea that this model is the perfect model, which tests discrimination between sick and healthy hearts, and tested the hypothesis. Consequently, we could figure out that the DFA can tell whether the subject has a healthy heartbeat or not in models. Finally, in the present study, we proved it in human hearts that the DAF can tell who has an ischemic hearts, which are leading to the cause of a sudden cardiac arrest.
Since the integrated circuit technology has enormously advanced, it is conceptually potential to build a small but powerful computation mobile heart sensor, capable of generating DFA scaling exponent every 30 to 60 min. We could test the device on anyone who equipped the device to the body to measure his/her heartbeat. If they were in a healthy heart condition, they would get an ideal scaling exponent from the device, which they were wearing.
A real time observation of both, EKG-signal and biological condition of a specimen, is important to interpret the physiological meaning of the scaling exponent. We did all on-line EKG recordings by ourselves. We interviewed those subjects in front of us how their physicians diagnosed their hearts and how they treated this sickness and so forth . This information assisted greatly our understanding of the physiological meaning of the exponent. However, surprisingly, we deduced that a person (Case 1 in the results section) had a sick heart without knowledge of sickness and treatment before and the DFA provided the accuracy of tests. We can interpret/speculate the relationship between changes of the scaling exponent and changes in the pumping behavior of the heart. It seems that, until recently, clinicians took recordings and physicists analyzed the recordings. We performed both, recordings and analysis by the same scientists. This is one important point of advantage in this study.
Other important points of our present studies are, that we made our own PC program, which assisted the accuracy of the peak- identification of heartbeats and then the calculation of the scaling exponent. Our DFA program shortened the period length of a time-consuming analysis. The small but new program freed us from complicated PC tasks before gaining the result of a calculation of the scaling exponent. As a result, we can concentrate more on physiology instead of physics. This lead us to handle many data, sampled from various subjects.
Identifying and remedying poor health condition earlier in our life careers would reduce subsequently and potentially occurring undesired incidence in the heart and unwanted treatments to the heart.
Strategies to prevent an undesired incidence need to look at the appropriateness of fluctuation, but research into this is made more difficult because hospitals, homes, schools etc. are not currently equipped EKG-DFA programs and there are no routine surveys to look at the benefits of DFA. We need a machine, which can automatically inspect-calculate the scaling exponent. We are currently developing the idea for a simple wearable heart-measuring machine. In addition, we need it for an inexpensive price, rather than for a high price, such as the cardiac diagnosing machines in the hospital. Everyone, wealthy or in poverty, should have the “right” to
have access to this. All individuals either yellow, white, or black races in humans, in our tests, all exhibited the identical 1.0 if their hearts were beating with a healthy rhythm, i.e., 1/f rhythm [22].
ACKNOWLEDGMENT
This work was supported by a Grant-In-Aid for Scientific Research, No. 1248217 (TY) and No. 14540633 (TY). We thank G. W. Channell, for her English revision. We are very grateful to all volunteers, for allowing us to test their heartbeats by finger pulse tests.
REFERENCES
[1] E. S. Ford et al., Explaining the Decrease in U.S. Deaths from Coronary Disease, 1980–2000. The New Eng. J. Med. Vol, 356, 2007, No. 23, pp. 2388-2398.
[2] A. de Torbal, E. Boersma et al. Incidence of recognized and unrecognized myocardial infarction in men and women aged 55 and older: the Rotterdam Study. European Heart Journal. Vol. 27, 2006, pp. 729-736.
[3] T. Yazawa, K. Kiyono, K. Tanaka, and T. Katsuyama, "Neurodynamical control of heartbeat in spiny lobster, Panulirus japonicus", Izvestiya VUZ. Applied Nonlinear Dynamics. Vol. 12, 2004, No. 1-2, pp. 114-121.
[4] T. Yazawa, K. Tanaka, T. Katsuyama, Neurodynamical Control of the Heart of Healthy and Dying Crustacean Animals. Proceedings of
CCCT2005 Austin, Texas, USA. Vol. I. Ed. H.W. Chu et al. T. Yazawa, K. Tanaka, T. Katsuyama, and M. Otokawa. Nonlinear
neurodynamical control of the heart of crustaceans. Bull. Univ. Housei Tama Vol. 20, 2005, pp, 7-20.
[5] T. Yazawa, K. Tanaka, T. Katsuyama, A Predictive and Preventative Computation for the diagnosis of the Heartbeat Control Systems: DFA for the Risk of Mortality in Both, Animal Models and Humans WMSCI 2007 Proceedings Vol. IV. Ed. N. Callaos et al. pp172-176.
[6] T. Katsuyama, T. Yazawa, K. Kiyono, K. Tanaka, M. Otokawa. Scaling analysis of heart-interval fluctuation in the in-situ and in-vivo heart of spiny lobster, Panulirus japonicus. Bull. Univ. Housei Tama Vol. 18, 2003, pp. 97-108 (in Japanese).
[7] H. E. Stanley, Phase transitions. Power laws and universality. Nature, Vol. 378, 1995, p554.
[8] P. Ch. Ivanov, A. L. Goldberger and H. E. Stanley, Fractal and multifractal approaches in physiology, The science of disasters: Climate disruptions, heart attacks, and market, A. Bunde et al. (Springer Verlag, Berlin, 2002).
[9] C. -K. Peng, S. Havlin, H. E. Stanley, and A. L. Goldberger, Quantification of scaling exponents and crossover phenomena in nonstationary heartbeat time series, Chaos Vol. 5, 1995 , pp, 82-87. [10] A. L. Goldberger, L. A. N. Amaral, J. M. Hausdorff, P. C. Ivanov, and
C. –K. Peng, Fractal dynamics in physiology: Alterations with disease and aging. PNAS Vol. 99, suppl. 1, 2002, pp, 2466-2472.
[11] N. Scafetta, and P. Grigolini, Scaling detection in time series: Diffusion entropy analysis. Phys. Rev. E Vol. 66, 2002, pp, 1-10
[12] M. F. Shlesinger, Mathematical physics: First encounters, Nature Vol. 450, 2007, pp, 40-41
[13] B. Lown, M. Wolf, Approaches to sudden death from coronary heart disease. Circulation, Vol. 44, 1971, pp, 130-142
[14] T. Yazawa, K. Kuwasawa, Intrinsic and extrinsic neural and
[15] J. L. Wilkens, T. Yazawa and M. J. Cavey, Evolutionary derivation of the American lobster cardiovascular system an hypothesis based on morphological and physiological evidence. Invertebrate Biol. Vol. 116, 1997, pp, 30-38.
[16] T. Yazawa, J. L. Wilkens, H. E. D. J. ter Keurs, M. J. Cavey, Structure and contractile properties of the ostial muscle (musculus orbicularis ostii) in the heart of the American lobster. J. Comp. Physiol. B. Vol. 169, 1999, pp, 529-537.
[17] T. Yazawa, T. Katsuyama, Spontaneous and repetitive cardiac slowdown in the freely moving spiny lobster, Panulirus japnicus J. Comp. Physiol. A. Vol. 187, 2001, pp, 817-824.
[18] T. Yazawa, T. Katsuyama, A. Katou, H. Kaizaki, M. Yasumatsu, T. Ishiwata, H. Hasegawa, and M. Otokawa, Fourier spectral analysis and micro-bore column HPLC analysis of neuronal and hormonal regulation of crustacean heart. Bull. Housei Univ. Tama, Vol. 16, 2001, pp, 29-40 (in Japanese).
[19] T. Yazawa, K. Tanaka, and T. Katsuyama, Neurodynamical control of the heart of healthy and dying crustacean animals, CCCT2005, July 24-27, Austin, Texas, USA, Proceedings, Vol. 1, 2005, pp, 367-372. [20] T. Yazawa, K. Tanaka, A. Kato, T. Nagaoka, and T. Katsuyama,
Alternans Lowers the Scaling Exponent of Heartbeat Fluctuation Dynamics in Animal Models and Humans. WCECS2007, San Francisco, USA, Proceedings, Vol. 1, 2007, pp, 1-6.
[21] J. L. Wilkens, L. A. Wilkens, and B. R. McMahon, Central control of cardiac and scaphognathite pacemakers in the crab, Cancer magister. J. Comp. Physiol. A Vol. 90, 1974, pp, 89-104.