Abstract—A well grounded understanding of process efficiency is essential for the sustainable success of organizations. This paper presents a novel method for analyzing the efficiency of business processes. It combines Data Envelopment Analysis (DEA) and Business Process Simulation (BPS) on process level. DEA is used to measure the efficiency of a process while BPS analyzes potential changes leading to a better efficiency. The combination of DEA and BPS is a promising approach for analyzing the structure of process (in-)efficiency.
Index Terms—Data Envelopment Analysis (DEA), Business Process Simulation (BPS), Efficiency, Business Process Management
I. INTRODUCTION
major challenge for companies is the adaption of their business processes to ongoing environmental changes often triggered by intense competition. In order to achieve this, efficient business processes are essential [1]. As a consequence, business processes have to be evaluated and enhanced continuously. A well grounded analysis of process efficiency is essential in this context. This paper will show an approach to evaluate process efficiency by combining Data Envelopment Analysis (DEA) and Business Process Simulation (BPS).
DEA, on the one hand, is an approach from the category of frontier analysis to measure the efficiency of Decision Making Units (DMUs) based on a limited set of assumptions only [2]. BPS, on the other hand, is a common method for analyzing the structure of business processes with e.g. the goal of efficiency improvement. Usually both methods are discussed separately in literature. However, as proposed in this paper, combing both methods can be a powerful way to analyze business processes in detail. DEA is an appropriate instrument for identifying efficient units (e.g. processes and process instances). But it delivers no indication about how to improve
A. Dohmen is with the Frankfurt School of Finance and Management, Sonnemannstraße 9-11, 60314 Frankfurt am Main, Germany (corresponding author to provide phone: +49 69 154008754; e-mail: [email protected]).
M. Leyer is with the Frankfurt School of Finance and Management, Sonnemannstraße 9-11, 60314 Frankfurt am Main, Germany (e-mail: [email protected]).
a unit’s low efficiency. In contrast to this, BPS is an adequate solution to analyze the reasons for different levels of efficiency on a process level. BPS can be used to build different simulation models and simulate different scenarios. This allows for an understanding of the behaviour of a process and an analysis of the effects of inefficiency indicators on process performance by experimental modifications [3].
First a short introduction to the methods DEA and BPS is given (Section 2). Afterwards, existing literature dealing with a combination of both methods will be reviewed (Section 3). In the next section, a new approach for combining DEA and BPS on process level is presented (Section 4). Finally, a short summary and an outlook on further steps are provided (Section 5).
II. THEORETICAL FOUNDATION
According to [4], efficiency in general is the relation between aspired performance and resources utilized. This means that efficiency has to be regarded as a relative concept. In the context of this paper efficiency is defined following the Pareto-Koopmanns definition: „Full (100%) efficiency is attained for an object […] if and only if none of its inputs or outputs can be improved without worsening some of its other inputs and outputs“ [5]. However, it can never be captured if inputs or outputs can theoretically be improved. As a consequence, in production theory those units are defined as efficiency, which capture the best actual efficiency, deriving an empirical production function. In addition, there exist many different forms of efficiency. In this paper only technical efficiency will be taken into account [4]. Technical inefficiency covers deviations in terms of input or output levels.
A. Data Envelopment Analysis
DEA is a non-parametric, non-stochastic efficiency measurement method developed by [2]. For each object to be measured (DMU), an efficiency score is assessed via the derivation of a production frontier determined by the empirically best-practice Decision Marking Units. The distance from a peer object on the best practice frontier determines the efficiency score [6]. DEA is based on limited assumptions and is especially applicable in cases where
input-Combining Data Envelopment Analysis And
Business Process Simulation For Analyzing The
Efficiency Of Business Processes
A. Dohmen and M. Leyer
output-relations are analyzed and the production function is unknown [5].
Generally, DEA has been used to detect efficiency on an organizational level. However, there always exist parts of a company which are more and others which are less efficient. Measuring on an organizational level might thus forego opportunities to detect the “real” inefficient parts. Efficiency measurement on a process level induces a perspective of the organization’s efficiency in production. [7] presented a method to measure efficiency on a process level with Data Envelopment Analysis. In this context, DEA is applied on a process instances’ level, indicating that each process instance is considered to be a DMU. According to [8] “the case (also named process instance) is the ’thing’ which is being handled, e.g. a customer order, a job application, an insurance claim, a building permit, etc.”. This indicates that a process instance has to pass all relevant process steps before it has been fully processed. Applying DEA on a process instances’ level assesses an empirical production function of the process from the best-practice process instances. The efficiency score is calculated by the distance from its peer best practice process instance located on the efficient frontier. Aggregating the efficiency scores (e.g. by calculating the mean) gives an indication about the process efficiency. This approach by [7] is the basis for the combination with BPS presented in this paper.
B. Business Process Simulation
A business process (also the term process is used in this paper) is characterized by a set of connected activities necessary for delivering a defined business outcome [9]. Every single outcome is described by a process instance incorporating the information about the required activities per output. Within a business process, employees, machines and IT systems are transferring inputs into outputs. This takes place changing the status of process instances step by step [10]. For example, a manager receives a loan application (status: no decision), handles the application and finally accepts it (status: decision).
If a business process is changed, it is mostly difficult to anticipate the consequences of this change. Here, it is impossible to experiment with real-world processes in order to analyze cause-and-effect relationships. Therefore, BPS can be used to illustrate the functionality of actual processes during a time lapse [11]. To enable this, models are used reflecting the relevant characteristics of a real world process under analysis. Typically, dynamic models are applied allowing for the reproduction of different scenarios of a process over time. Applying changes to these models, the investigation of BPS takes place by means of “what if” questions [12]. This can be for example the question what would happen to the efficiency of handling process instances if a process improvement had been developed. Furthermore, stochastic influences on the changes (random distributions like the point of time of an event or environmental influences) can be incorporated [13]. Typically, BPS aims on evaluating consequences of
alternative process structures, changes of demand on key performance indicators and bottlenecks within a process [14]. Consequently, the use of BPS allows for a basic understanding of processes, generates options for changes and an evaluation of effects of these changes [3].
III. LITERATURE REVIEW
In literature very few approaches can be found which aim to combine DEA and BPS.
One possibility is the combination of using BPS to generate data as input for applying a DEA. There are case studies from [15] and [16] adopting this in the context of line balancing. Their focus is on using DEA as a tool for comparing different assembly line balancing strategies aiming to find the most efficient one. As they need data for the values of input and output of the DEA they use simulation to generate the necessary data. As a consequence, their focus is on the efficiency of the whole process under analysis and not on the single objects within a process. Furthermore, there is no real combination of both methods in terms of analyzing the same units. Although both methods are applied on process level, the main focus is on the application of the DEA. BPS is simply used as a tool to generate data.
Another approach has been published by [17]. He presents a further combination of both methods applying DEA on the company level to identify one company as benchmark unit. As this company is the most efficient one, its processes should be further examined using BPS. Another possibility is the transfer and simulation of the efficient process structure to a less efficient company. To achieve this, he defines three necessary steps: (1) Obtain data: either historical data or generated by simulation. Data consists of input and output of companies. (2) DEA analysis: Analysis of data using DEA to identify one company as benchmark unit. (3) Simulation analysis: Simulation of the processes of the benchmark unit performing a sensitivity analysis or applying the process structure to a less efficient unit and compare results. This approach is also applying the methods BPS and DEA on different units. DEA is used on company level, delivering information which unit should be analyzed further using BPS.
IV. MODEL FOR INTEGRATING DEA AND BPS ON PROCESS LEVEL
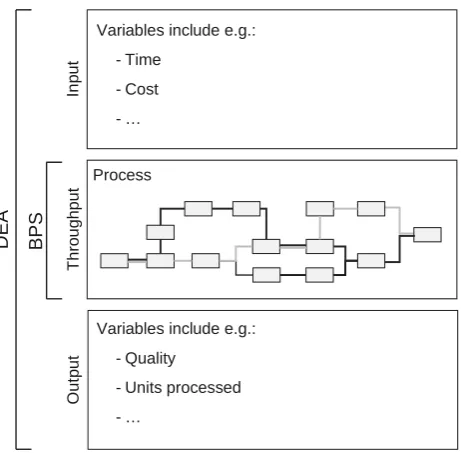
Having the basic foundations of both methods in mind, the idea is to combine the advantages in an application on process level. As Fig. 1 shows, both methods applied on a process level focus on different aspects.
DEA is purely based on an input-output-model for efficiency measurement. The throughput is considered to be a “blackbox” [1]. Here, BPS provides the opportunity to analyze this blackbox in terms of simulation scenarios and their influence on efficiency. Applying either DEA or BPS is very useful but delivers answers to different dimensions (either process efficiency in terms of an input-output-model or simulated input-output data for different scenarios). Additionally, the comparison of different process alternatives using only BPS is not satisfying. Especially after applying a business engineering both alternatives are two different processes. Therefore, the idea is to combine both methods on process level. This can be done in the following way: DEA can be used to analyze and evaluate simulation results of a BPS in terms of efficiency. As a result different BPS scenarios can be compared with a standardized efficiency value for the process. In the long run, this aims at a continuous improvement of process efficiency.
To ensure a continuous improvement the idea is to apply the method combination iteratively in a multistage approach. This application is structured in consecutive phases as exhibited in Fig. 2.
[image:3.595.308.552.392.713.2]Phase 1: Within phase 1, the basic conditions for the analysis have to be defined. As a starting point the goal of efficiency improvement has to be set, e.g. a reduction in cycle time, in cost or both. Output variables to be considered in DEA can further be e.g. process instances processed or an indicator for the process instances’ quality. The definition of
Fig. 1: Application areas of DEA and BPS on process level
the input and output variables to be analyzed in terms of process efficiency is thus the first step.
Depending on the chosen input and output variables possible changes in the process that might have an influence on the input-output-model can be defined. Here, options for changes are available on a strategic as well as an operational level. Changes on a strategic level aim on changing the process structure and take place in a long term (e.g. process engineering). In contrast to that, operational changes influence the parameters of a given process structure in the short-term (e.g. sensitivity analysis) [18].
Phase 2: For a given business process a DEA can be applied to measure the efficiency of process instances and subsequently of the process by using the DEA approach proposed by [7]. As DEA can apply a multiple input-output-model, the efficiency of a process can be measured by integrating all performance indicators defined in phase 1.
The following application of BPS should follow the typical steps of a BPS project [20]. At the beginning scope and aim of the BPS are defined (Step 1). In this case, this is the change
Fig. 2: Schematic model for combination of DEA and BPS on process level
Out
p
ut
T
h
ro
u
ghpu
t
DEA
Process
In
p
u
t
BPS
Variables include e.g.:
- Time
- Cost
- …
Variables include e.g.:
- Quality
- Units processed
- …
DEADEA
Phase 2
Phase 3
Phase n Phase 1:
Step 1: Definition of input-output-variables of interest in terms of process efficiency
Step 2: Definition of possible changes in the
throughput that influence the input-output-relation
BP
S
BP
S
DEADEA
BP
S
BP
S
DE
A
DE
A
BPSBPS
[image:3.595.53.284.501.728.2]of throughput to enhance the efficiency of the defined input-output-variables as defined in phase 1. Then, the necessary data for building a simulation model has to be collected (Step 2). Basically, this is the same as used for the DEA but includes some additional information e.g. the process model and the staff availability. Thereupon, the simulation model of the current process can be built (Step 3). However, BPS is not a standardized tool, which can be used straightforward. In fact, a process has to be analyzed and structured in advance to build a simulation model. Only after this effects of “what if” questions can be simulated [19].
All changes that are assumed to have an influence on the input-output-relation can be modeled now and their behavior under different scenarios is observed (Step 4). Doing this, BPS thus simulates changes in the process throughput under different scenarios and provides new input-to-output data for the whole process and single process instances.
Possible options for changes could be modifications of the process model, the reallocation of staff or the sequence of process instances. Having simulated the “what if” scenarios results can be compared and evaluated by again using DEA (Step 5). This will be done by providing the simulation data per process instance for the DEA. Afterwards, comparing the DEA results for process efficiency in different simulated scenarios allows choosing the one showing the highest efficiency improvement compared to the initial situation.
Phase 3: The scenario chosen in the last step of phase 2 is again analyzed by using BPS to identify further opportunities of efficiency improvement in terms of the previously defined input and output variables (e.g. time, cost etc.). Again the options for changes being available now, can be applied in simulation scenarios. This leads to new simulation results which are then again compared by using DEA. This procedure is continued (Phase n) until the efficiency of the process reaches a satisfactory or predefined level. As the environment is changing continuously the circumstances where a high efficiency was reached might change, too. Therefore, the analysis of efficiency using both methods can be seen as continuous improvement procedure.
V. CRITICAL ACCLAIM A. Advantages
The application of BPS and DEA within the proposed method is closely connected. The data used for the analysis is derived from the same level of the process under analysis. Furthermore, the possible options for changes in the throughput simulated with BPS are defined based on the chosen input-output-variables of the DEA. Furthermore, the application takes place in an iterative way using BPS results for DEA and the other way round. Thus, the approach method combines the advantages of using DEA for analyzing input-output-relations and BPS for further examining the throughout which is considered to be a “blackbox” in most efficiency measurement techniques [1].
Another major advantage is the constant basis of measurement of the process efficiency. Whenever DEA is applied it uses the same input-output-variables which have been defined in phase 1. This is necessary to ensure that the efficiency measurement results stay comparable between the different phases, especially if a process has been completely re-engineered in the simulation phase. Using simply BPS in this situation it is not possible to rank simulation scenarios in terms of process efficiency [16]. As a consequence of the proposed method, all process scenarios simulated in every phase can be compared with each other, leading to a true iterative approach for approximating the best process design and process execution in terms of the previously defined variables for efficiency measurement.
B. Limitations
If input-output-variables are changed the comparability between process scenarios of the last phases is not given any more. In that case the basis of measurement has changed. Only DEA results using the same input-output-variables can be compared in terms of identifying an efficiency improvement of an implemented change in the process. Nevertheless, it should be possible to alter input-output-variables within the continuous improvement of a process, e.g. in case the strategic positioning has changed leading to different process performance indicators. In such a case, one has to start with phase 1 again and the DEA results must not be compared with previous scenarios incorporating different input-output-variables. This indicates that goals of efficiency improvement including the relevant input-output-variables have to be chosen carefully at the very beginning.
VI. CONCLUSION
An efficient value creation is essential to companies in virtually any industry. The efficiency of processes is thus important to be measured adequately and analyzed for their potential of efficiency improvements. Frontier analysis – like Data Envelopment Analysis – is a powerful method for efficiency measurement, whereas BPS has shown to be successful in analyzing the structure of process efficiency such as the sensitivity of process design changes towards efficiency. Applying DEA for measuring the process efficiency as proposed by [7] and a subsequent analysis of the process structure by BPS indicates great potential for detailed analysis of the efficiency of business processes. This paper has shown the conceptualization of combining DEA and BPS for analyzing process efficiency. In current ongoing research, this approach will be applied to a case study covering data of a loan application process of a German bank.
REFERENCES
[2] A. Charnes, W. W. Cooper, and E. Rhodes, "Measuring the efficiency of decision making units," Eur J Oper Res, vol. 2, no. 4, July 1978, pp. 429–444.
[3] R. Doomun and N. V. Jungum, "Business process modelling, simulation and reengineering: call centres," BPMJ, vol. 14, no. 6, 2008, pp. 838– 848.
[4] U. Cantner, J. Krüger, and H. Hanusch, Produktivitäts- und Effizienzanalyse. Der nichtparametrische Ansatz. Berlin, Heidelberg: Springer-Verlag, 2007.
[5] W. W. Cooper, L. M. Seiford, and J. Zhu, "Data Envelopment Analysis. History, Models and Interpretations," in Handbook on Data Envelopment Analysis, W. W. Cooper, L. M. Seiford, and J. Zhu, Eds. Boston, MA: Kluwer Academic, 2004, p. 4.
[6] M. K. Epstein and J. C. Henderson, "Data Envelopment Analysis for Managerial Control and Diagnosis," DSJ, vol. 20, no. 1, June 1989, pp. 90–119.
[7] A. Burger and J. Moormann, "Detecting Intrinsic Inefficiency on Process Level: Benchmarking of Transactions in Banking," in Proc. BPM 2008 Int. Workshops, Berlin, Heidelberg: Springer-Verlag, 2009, pp. 146–157. [8] W. M. P. van der Aalst, H. A. Reijers, A. J. M. M. Weijters, B. F. van Dongen, A. K. A. de Medeiros, M. Song, and H. M. W. Verbeek, "Business Process Mining An Industrial Application," Inf. Sys., vol. 32, no. 1, July 2007, p. 713.
[9] T. H. Davenport and J. E. Short, "The New Industrial Engineering. Information Technology and Business Process Redesign," SMR, vol. 31, no. 4, July 1990, pp. 11–27.
[10] A. Greasley, "Using DEA and Simulation in Guiding Operating Units to Improved Performance," JORS, vol. 56, no. 6, June 2005, pp. 727–731. [11] J. Banks, Handbook of Simulation. Principles, Methodology, Advances,
Applications, and Practice. New York: John Wiley & Sons, 1998. [12] P. Bratley, B. L. Fox, and L. E. Schrage, A Guide to Simulation. New
York: Springer-Verlag, 1987.
[13] R. Roy and S. E. Meikle, "The Role of Discrete Event Simulation Techniques in Finite Capacity Scheduling," JORS, vol. 46, no. 11, November 1995, pp. 1310–1321.
[14] J. Banks, J. S. Carson, and B. L. Nelson, Discrete-Event System Simulation. New Jersey/NJ: Prentice Hall, 1996.
[15] P. R. McMullen and G. V. Frazier, "Using Simulation and data envelopment," J Prod Anal, no. 11, April 1998, pp. 149–168.
[16] M. Braglia and A. Petroni, "Data envelopment analysis for dispatching rule selection," Production Planning & Control, vol. 10, no. 5, July-August 1999, pp. 454–461.
[17] A. Greasley, "Using process simulation within a business-process reengineering approach," BPMJ, vol. 9, no. 4, 2003, pp. 408– 420.
[18] M. T. Wynn, M. Dumas, C. J. Fidge, A. H. M. ter Hofstede, and W. M. P. van der Aalst, “Business Process Simulation for Operational Decision Support,” in Proc. BPM 2007 Int. Workshops, Berlin, Heidelberg: Springer-Verlag, 2008, pp. 66–77.
[19] F. Liebl, Simulation. Problemorientierte Einführung. München: Oldenbourg, 1995.