Deciphering priority
areas for improving
project risk management
through critical analysis
of pertinent risks in the
Zambian construction
industry
Peer reviewed and revised
Abstract
Risk identification is the first step in the risk-management process. A plethora of current studies in literature dwell overwhelmingly on risk identification much to the exclusion of the source, and the possible mitigation interventions. In a limited effort to address this deficiency in the body of knowledge, this article reports the results of a study conducted using 15 purposive semi-structured interviews and 198 questionnaires targeting clients, contractors and consultants in the building sector in Zambia. This study uses threats to identify improvement areas in the Zambian Construction Industry (ZCI). As a consequence, this research uses the pertinent risk factors as a point of critical analysis to recommend improvement areas for project risk management.
Findings show that most of the risks could be categorised as managerial, technical and finance related and could severally be associated with clients, consultants, and contractors compared to project managers. These could be mitigated in the pre-contract phase and construction phase, with the most deficient knowledge areas being cost management, procurement management, integration management, communication man-age ment, and scope manman-agement. This article provides areas of focus for built environ ment professionals to improve project delivery and thereby enhance project execution efficiency.
Keywords: Building sector, risk identification, Pareto analysis, project risk management, Zambia
Chipozya Kosta
Tembo-Silungwe
Mrs Chipozya K. Tembo-Silungwe, School of Construction Economics and Management, University of the Witwatersrand, Johannesburg, South Africa. Phone: +27 11 717 7625, email: <[email protected]>
Nthatisi Khatleli
Dr Nthatisi Khatleli, Senior lecturer, School of Construction Economics and Management, University of the Witwatersrand, Johannesburg, South Africa. Phone: +27 11 717 7651, email: <[email protected]>
DOI: http://dx.doi. org/10.18820/24150487/ as24i2.1
ISSN: 1023-0564 e-ISSN: 2415-0487 Acta Structilia 2017 24(2): 1-43
Abstrak
Risiko-identifikasie is die eerste stap in die risikobestuursproses. ’n Oorvloed bestaande literatuurstudies handel oorweldigend oor die identifisering van risiko’s tot die uitsluiting van die bron en moontlike versagtende intervensies. In ’n beperkte poging om hierdie tekort aan kennis aan te spreek, het hierdie studie 15 doelgerigte semi-gestruktureerde onderhoude en 198 vraelys-opnames gedoen wat kliënte, kontrakteurs en konsultante in die bousektor in Zambië teiken. Bevindinge toon dat meeste van die risiko’s gekategoriseer kan word as bestuurs-, tegniese en finansies verwant en kan afsonderlik met kliënte, konsultante en kontrakteurs geassosieer word met projekbestuurders. Dit kan verminder word in die voorkontrakfase en konstruksiefase, met die mees gebrekkige kennisareas, naamlik kostebestuur, verkrygingsbestuur, integrasiebestuur, kommunikasiebestuur en omvangsbestuur. Hierdie artikel bied fokusareas vir geboue in die omgewing om projeklewering te verbeter en sodoende die doeltreffendheid van projekuitvoering te verbeter.
Sleutelwoorde: Bou-sektor, risiko-identifikasie, Pareto-analise, projek risikobestuur, Zambië
1.
Introduction
2001: 634; Choudry, Aslam, Hinze & Arain, 2014: 1-9; Lyons & Skitmore, 2004: 60).
The construction industry in Zambia is characterised by quality shortfalls, cost and time overruns as well as project abandonment (Kaliba, Muya & Sichombo, 2009a; Muya, Kaliba, Sichombo & Shakantu, 2013; Auditor General’s Office, 2006-2012: Online). The Auditor General Reports focus on public-sector projects carried out by various government ministries, agencies and authorities. In addition, the Zambia Development Agency reports that the Zambian Government procures over 70% of work in the Republic (ZDA, 2013: Online).
Given the aforementioned, risks are prevalent in the ZCI and are affecting performance. In terms of volume, building sector projects are the majority (ZDA, 2013: online), yet few studies in the Zambian context have identified risks affecting this sector, apart from risks identified by Mañelele and Muya (2008) from a subsection of the sector. This study is, therefore, justified by focusing on the whole building sector where it is unclear in which areas the knowledge is lacking and where professionals should focus to alleviate the situation. Given this knowledge gap, a literature study on project cycle and knowledge areas, risk categories as well as on risk factors in the construction industry of developing countries helped identify risks and assist in categorising these risks into various risk categories determined by the identified risk factor. By categorising the risks identified from the literature review, combined with the risks identified from semi-structured interviews, this study listed pertinent risk factors which were ranked in a questionnaire survey as a point of critical analysis to recommend improvement areas, possible mitigation and alleviation for project risk management in the Zambian Construction Industry.
2.
Nature of risks
Risks can be known or unknown (Chapman & Ward, 2003: 98). Unknown risks are referred to as uncertainties. Jaafari (2001: 89) defines uncertainty in project contexts as “an unknown probability of impact of a project variable on its objective function”. A further extension of Jafaari’s (2001: 89) postulation is that certain events have a 100% probability chance of occurrence, while totally uncertain events have 0% probability chance of occurrence. Risk has to be understood as the uncertainty that can be measured, while uncertainty is the risk that cannot be measured (Serpella, Ferrada, Howard & Rubio, 2014: 655). Nonetheless, both have an impact on project delivery if unmanaged (Hilson, 2002: 239). This study focuses on the known risks influencing performance in the ZCI. Anything that increases risk or susceptibility is a risk factor (Zou, Zhang & Wang, 2007: 605). Risk factors usually have measureable characteristics or elements (Business Dictionary, 2016: Online), especially when they pertain to volatile issues such as exchange rate, interest rate, labour shortage, or market price.
2.1 Risk categories in the construction industry
Therefore, contracts for use in such an area should cover political risks. The classifications or categorisations of risks may occur in various forms such as political, economic, social, technological, legal, and environmental. Others are impact related, such as insurable or uninsurable; acceptable or unacceptable. Another classification could be positive or negative (Ebrahimnejad, Mousav & Seyrafianpour, 2010: 577). Some of these risks could emanate from a contractual relationship, while others are non-contractual (Murdock & Hughes, 2001: 83). Zou et al. (2007: 605), on the other hand, categorise the risks as quality related, cost related and time related. However, the broader classification of risk is internal and external (Tah & Carr 2000: 492; Barlish, Marco & Thaheem, 2013: 709). Furthermore, the concept of risk owner may be used as a classification method; such categorisations have been used by Jarkas and Haupt, (2015: 175-177) who categorise the risks as client related, contractor related, consultant related only when they pertain to internal risks. In this categorisation, risks external to the project team are classified under the umbrella term of external risks. When risks eventuate, more than one party may be affected. In this article, the concept of risk owner is used to refer to who is supposed to manage a particular risk (Smith et al., 2014: 4).
Internal risks could be local (labour, plant, subcontractors, materials, and site) and global (construction, design, financial [company/ project] location, precontract, client, contractual, environmental, management, and time frame). External risks include economic, physical, political and technological (Tah & Carr, 2000: 492). Zavadskas, Turskis and Tamoscitience (2008: 351) suggest internal risks (stakeholders, designers, contractors, subcontractors and suppliers) and external risks (economic, social, weather, protetivism). Barlish et al. (2013: 709) formulate a risk taxonomy/category for the construction industry as internal (client/owner, design, job site related, subcontractor, operational, and managerial) and external risks (political, financial/economic, social, cultural, technological, legal regulation, and environment).
provides evidence that risk categories are selected, based on the nature of information needed.
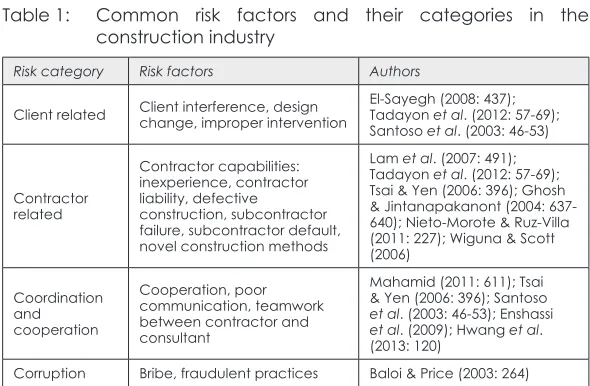
Risk factors can cause many risks and form a causal network with the risks (Tah & Carr, 2000: 500). Moreover, risks are triggered by risk factors (Ebrahimnejad et al. 2010: 576). Various research has been conducted on risk factors affecting the construction industry. Table 1 shows the various risk categories and risk factors found in previous research. Internal risk (within the control of a project team) categories include design risks, productivity risks, client-related risks, contractor risks, and management risks. External risk (beyond the control of a project team) categories include economic, legal, force majeure, political, and social (Table 1).
2.2 Risk factors in the construction industry
Table 2 highlights the various risk factors found in the construction industry as identified in different developing countries, namely China, Egypt, Ghana, India, Indonesia, Jordan, Malaysia, Mozambique, Nigeria, Pakistan, Poland, South Africa, Sri-Lanka, Swaziland, Uganda, Vietnam, and Zambia.
Knowledge of the risk factors affecting other developing countries provides a basis for risk mitigation or alleviation of similar risks. Some of the risks identified are construction sector specific, while others apply to a whole industry. Financial, planning and operational risks seem rampant in developing countries (see Table 2).
Table 1: Common risk factors and their categories in the construction industry
Risk category Risk factors Authors
Client related Client interference, design change, improper intervention El-Sayegh (2008: 437); Tadayon et al. (2012: 57-69); Santoso et al. (2003: 46-53)
Contractor related
Contractor capabilities: inexperience, contractor liability, defective
construction, subcontractor failure, subcontractor default, novel construction methods
Lam et al. (2007: 491); Tadayon et al. (2012: 57-69); Tsai & Yen (2006: 396); Ghosh & Jintanapakanont (2004: 637-640); Nieto-Morote & Ruz-Villa (2011: 227); Wiguna & Scott (2006)
Coordination and cooperation
Cooperation, poor communication, teamwork between contractor and consultant
Mahamid (2011: 611); Tsai & Yen (2006: 396); Santoso et al. (2003: 46-53); Enshassi et al. (2009); Hwang et al. (2013: 120)
[image:6.421.56.351.346.539.2]Risk category Risk factors Authors
Cost Cost overruns, estimator related, poor cost control
Baloi & Price (2003: 264); Zou et al. (2007: 605); Wiguna & Scott (2006); Medda (2007: 216)
Delay
Delay in resolving disputes, time overruns, tight project schedules, time constraints, unrealistic schedules
El-Sayegh (2008: 437); Tadayon et al. (2012: 57-69); Goh & Abdul-rahman (2013: 25); Turkey (2011: Online); Ghosh & Jintanapakanont (2004: 637-640); Medda (2007: 216)
Design
Design changes, design defects, delay in producing detailed drawing, design issues, engineering design
Santoso et al. (2003: 46-53); Oztas & Okmen (2005: 234); Enshassi et al. (2009); El-Sayegh (2008: 437); Medda (2007: 216); Chung et al. (2010: 47-53); Kuo & Lu (2013: 602-614); Nieto-Morote & Ruz-Villa (2011: 227); Wiguna & Scott (2006); Oztas & Okmen (2005: 234); Medda (2007: 216)
Economic and financial
Inflation rates, delayed payment, market, exchange rates, financial failure of client, price inflation, uncertainty in price, level of competition, market, unavailability of funds, financial failure of contractor
Wiguna & Scott (2006); Ghosh & Jintanapakanont (2004: 637-640); Baloi & Price (2003: 264); Zou et al. (2007: 605); El-Sayegh (2008: 437); Goh & Abdul-rahman (2013: 25); Mahamid (2011: 611); Turkey (2011: Online); Kuo & Lu (2013: 602-614); Chung et al. (2010: 47-53); Medda (2007: 216); Lam et al. (2007: 491); Xu et al. (2012: 896); Ebrahimnejad et al. (2010: 581)
Environment Inclement weather, unforeseen site ground conditions
Wiguna & Scott (2006); Zou et al. (2007: 605)
Force majeure Invasions, natural hazards Kuo & Lu (2013: 602-614); Enshassi et al. (2009); Chung
et al. (2010: 47-53)
Legal Difficulty in obtaining permits, frequent changes in law and statutory regulations
Lam et al. (2007: 491); Tsai & Yen (2006: 396); Xu et al. (2012: 896)
Management Construction management, project management, site management
Risk category Risk factors Authors
Political
Frequent changes in statutory laws, government action and regulations, change in law, public risk
Enshassi et al. (2009); Mahamid (2011: 611); Tsai & Yen (2006: 396); Lam et al. (2007: 491); Tadayon et al. (2012: 57-69); Chung et al. (2010: 47-53); Medda (2007: 216)
Productivity
Shortage of labour, lack of manpower, inadequate staff by contractor, low equipment efficiency, equipment unavailability, construction equipment maintenance, labour productivity, resource risk, construction delay
Santoso et al. (2003: 46-53); Kartam & Kartam (2001: 329-333); Wiguna & Scott (2006); Oztas & Okmen (2005: 234); Turkey (2011: Online); Mahamid (2011: 611); El-Sayegh (2008: 437); Zeng & Smith (2007: 589-600); Dikmen & Birgnoul (2007: 60-66); Hwang et al. (2013: 120); Enshassi et al. (2009); Zou et al. (2007: 605); Ghosh & Jintanapakanont (2004: 637-640); Kuo & Lu (2013: 602-614); Mahamid (2011: 611)
Project related
Engineering risks, inadequate site investigation, project complexity, site factor physical/technical, unclear scope
Nieto-Morote & Ruz-Villa (2011: 227); Lam et al. (2007: 491); Dikmen & Birgnoul (2007: 60-66); Zeng & Smith (2007: 589-600); Xu et al. (2012: 896); Tadayon et al. (2012: 57-69); Wiguna & Scott (2006); Oztas & Okmen (2005: 234); El-Sayegh (2008: 437)
Third parties Right-of-way problems Ghosh & Jintanapakanont (2004: 637-640); Turkey (2011: Online)
Social Culture, human factors Lam et al. (2007: 491); Chung et al. (2010: 47-53); Zeng & Smith (2007: 589-600)
Table 2:
Risk factors in selected developing countries
Country
Author
Nature of construction
Financial and payment Improper planning Operational risks Economic risks Design risks
Change orders and scoping
Owner related Weather conditions
Poor site management Coordination
Subcontractor
Inadequate contractor experience
Inadequate site investigation
Poor contract and project management
Political instability China Zou et al. (2007: 605) x x Egypt
Khodeir & Mohamed (2014: 5)
Construction x x x x Frimpong et al. (2003: 324) x x x x
Agyakwa-Baah & Chileshe (2009:
933) Construction x x x x India
Iyer & Jha (2005: 291)
x x x x Doloi et al. (2012: 484) x x x x Indonesia
Wiguna & Scott (2006: 1129-1135)
Buildings
x
x
x
x
Soepriyono (2013: 465-472)
x
x
x
x
Jordan
Odeh & Battaineth (2002: 70)
Construction x x x x x x Sweis et al. (2008: 672-674) x x x x Malaysia
Goh & Abul-Rahman (2013: 25)
x x Shehu et al. (2014: 64) x
Tipili & IIyasu (2014: 11-13)
Construction
x
x
x
x
Belel & Mahmood (2012: 3-4)
x
x
x
x
Aibinu & Odeyinka (2006: 672)
x x x x Mozambique Muianga et al. (2014: Online) Construction x x x x x x x Pakistan Choudry et al. (2014: 1-9) x x x x Poland
Skorupka (2008: 121-122)
Construction
x
x
x
South Africa
Chihuri & Pretorius (2010: Online)
Engineering and construction
x x x Sri-Lanka Perera et al. (2009: 93) Roads x x x x Perera et al. (2014: 1) Roads x x x x Uganda Apolot et al. (2011) Construction x x x x Vietnam Le-Hoai et al. (2008) x x x x Zambia
Mañelele & Muya (2008: 4)
2.3 Risks, project cycle and knowledge areas
Given that the gap identified is a knowledge gap, it is important to have a basic understanding of construction stages and processes in order to determine where the knowledge gaps could reside. Different risks factors affect a project at different stages of the project, while some risk factors may permeate all stages and processes of the project. The generic stages of the project include:1 - Pre-project stage, 2 - Pre-construction stage, 3 - Construction stage, 4 - Post-construction stage (Kagioglou, Cooper, Aouad & Sexton, 2000: 148-150), while PMBOK (2008: 18) and ISO 21500 (2012: online) highlight the following processes: 1 - Initiate, 2 - Plan, 3 - Execute, 4 - Controlling, 5 - Close out. Though risks mostly eventuate and manifest themselves in the construction phase (Lehtiranta, 2014: 129; Osipova & Eriksson, 2011: 1151), this does not entail that this is the stage where the risks have their source.
The PMBOK (2008: 67-69) further outlines knowledge areas for practice and application as shown below. Other knowledge areas are also considered:
• Integration Management (PMBOK 2008: 71-101): The knowledge area is devoted to identifying and defining the work in all project phases. This knowledge area deals with efficiently integrating changes into the project at all stages. • Scope Management (PMBOK, 2008: 103-128): This knowledge
area deals with the project scope, project requirement scope, project work, making the work breakdown structure, making the scope baselines, and managing the scope of the project. This area aims to plan the ways in which to keep the project within the established boundaries. This is applied at initiation, planning, and control/monitoring.
• Time Management (PMBOK, 2008: 129-163): The project managers/leaders estimate the duration of the tasks in this knowledge area. Tasks are sequenced here and the choices of resources required for achieving the objective of the project are made. The schedule is monitored and managed to keep the project on track. This knowledge area permeates planning, execution, and control/monitoring.
• Quality Management (PMBOK, 2008: 189-213): This is the knowledge area where the quality requirements for project deliverables are planned and tracked. In this area, all the quality issues are monitored and fixed. This is applied to planning, execution, and monitoring/control.
• Human Resources Management (PMBOK, 2008: 215-241): This comprises the essential processes to define the ways in which human resources are utilised, developed, acquired, and managed. This is dealt with in the planning and execution phases.
• Communications Management (PMBOK, 2008: 243-270): The knowledge area defines how communications within the project will work. The project manager/leader makes the communication management plan, ensures the plan is followed, and controls information flow within the project. The knowledge area permeates all phases of a project.
• Risk Management (PMBOK, 2008: 273-311): This consists of identifying risks, planning risk management, conducting risk assessments, and controlling risks. This knowledge is used in the planning and control/monitoring phases. The area concentrates on identifying, analysing, and planning responses to both ‘threat risks’ (negative) and ‘opportunity risks’ (positive).
• Procurement Management (PMBOK, 2008: 313-340): This deals with the processes, which project managers/leaders usually follow to acquire the material required for the successful completion of the project. In this knowledge area, project managers/leaders come up with the plan for conducting procurements, controlling the procurements, and closing out the procurements. This is utilised in the planning, execution, controlling/monitoring, and closing out phases.
• Stakeholder Management (PMBOK, 2008: 261-265): The area encompasses all the processes used by a project manager/ leader for recognising and satisfying those who are affected by the project. The affected party can be either internal or external in nature. Close attention needs to be paid to stakeholders who have a powerful positive or negative impact on the project. This is applied throughout the project cycle. • Claim Management (Lichtenthaler, 2017: online): This is the
the phases of detection, examination, and correction of the defects. This occurs in the construction phase.
• Safety management defines the safety obligations on all duty holders, including the client, project supervisor for design process and construction process (Smart market report, 2013: 15). This is normally planned in the pre-contract stage by either the design team or the contractor submits a risk management plan at the tender stage. It is executed in the construction phase.
• Project Financial Management: This process brings together planning, budgeting, accounting, financial reporting, internal control, auditing, procurement, disbursement, and the physical performance of the project with the aim of managing project resources properly and achieving the project’s objectives (NCTC, 2017: online). This is normally planned in the pre-contract stage and executed in the construction phase. It is done in the form of an audit to check the planned against the actual work completed.
• Environmental management (He, 2010: 208). This is the management of the impacts of a project management’s activities on the environment. It provides a structured approach to planning and implementing environment-protection measures. This is normally planned in the pre-contract stage and executed in the construction phase. The knowledge areas are important for managing a project, as project management is the application of knowledge to achieve the project objective(s). Therefore, these knowledge areas were used as the basis for determining knowledge gaps.
3.
Methodology
This article is part of a bigger study on risk allocation on building projects; therefore, the methodology reported here reflects what was done for the whole study. Saunders, Lewis, and Thornhill (2012: 138) suggest that the methodology comprises the research philosophy, approaches and strategies, choices in methods, time horizons, techniques and procedures for data collection and analysis. The research used a pragmatism philosophy.
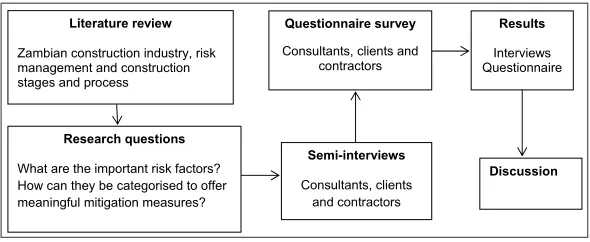
Figure 1. The methods chosen are semi-structured interviews and questionnaire surveys collected in a cross-sectional manner. Therefore, the research is both qualitative and quantitative, because the approach makes use of both numbers and words in determining the pertinent risks impacting on the Zambian building sector and further, deciphering the root causes of such risks. This approach was deemed appropriate, as the nature of the problem is a practical one. The importance of this worldview is that it focuses attention on the research problem and uses several approaches to derive knowledge about the problem (Creswell & Clark, 2011: 45-46). A deeper understanding of the nature of the risks enabled the identification of possible target areas for improvement. The study respondents were consultants, clients and contractors involved in building projects in the Zambian construction industry.
Research flow diagram
Research questions What are the important risk factors? How can they be categorised to offer meaningful mitigation measures?
Semi-interviews Consultants, clients
and contractors Questionnaire survey Consultants, clients and
contractors Literature review
Zambian construction industry, risk management and construction stages and process
Results Interviews Questionnaire
Discussion
Figure 1: Research flow diagram applicable to this article
3.1 Sampling method
[image:13.421.71.366.235.356.2]probability (random sampling and stratified random sampling) and non-probability (purposive and census) for the various categories of respondents as shown in Tables 3 and 4.
3.1.1 Semi-structured interviews
The purposive method was employed for the semi-structured interviews to select participants, with at least 10 years’ experience in the construction industry, from diverse backgrounds, professions and project experiences. The purposive heterogeneous sampling was intentionally selected for this purpose. This method of sampling enables accessing respondents from diverse backgrounds with in-depth knowledge about a particular issue (Adams et al., 2012: 87: Babbie, 2013: 126). Leedy and Ormrod (2014: 196) propose a sample of five to 25 participants for semi-structured interviews. In this research, 15 respondents participated, as shown in Table 3. Triangulation of risk factors from different respondents was used as a measure of validity for the interviews.
3.1.2 Questionnaire survey
The questionnaire survey utilised three types of sampling: simple random sampling for consultants who are ordered or arranged according to services (for example, Architecture, Quantity Surveying and Engineers), while a simple census was done for clients and project managers, as these populations were less than 30 (Saunders et al.,
2012: 266). For contractors, stratified random sampling was used, as the contractors targeted were listed in different building categories and had different capacities, thereby presenting heterogeneous characteristics across groups and homogeneous characteristics within groups. Each contractor grade (grades 1-3) was treated as a stratum where proportional samples were drawn (Adams et al., 2012: 89). For building category grade 1, limitation of contract value to be tendered is over K40Million (US$ 4 M); grade 2 between K20M and K40 (US$ between 2M & 4M), while the grade 3 category is K10M and K20M (US$ between 1M & 2M) using an exchange rate of 1US$=K9.77.
3.2 Sample size
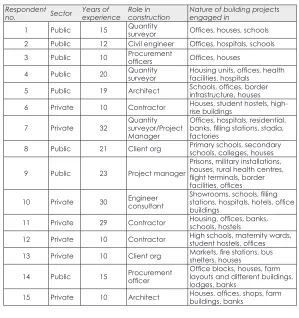
Table 3: Respondent profile for interviewees sampled purposively
Respondent
no. Sector Years of experience Role in construction Nature of building projects engaged in
1 Public 15 Quantity surveyor Offices, houses, schools 2 Public 12 Civil engineer Offices, hospitals, schools 3 Public 10 Procurement officers Offices, houses
4 Public 20 Quantity surveyor Housing units, offices, health facilities, hospitals
5 Public 19 Architect Schools, offices, border infrastructure, houses
6 Private 10 Contractor Houses, student hostels, high-rise buildings
7 Private 32 Quantity surveyor/Project Manager
Offices, hospitals, residential, banks, filling stations, stadia, factories
8 Public 21 Client org Primary schools, secondary schools, colleges, houses
9 Public 23 Project manager
Prisons, military installations, houses, rural health centres, flight terminals, border facilities, offices
10 Private 30 Engineer consultant Showrooms, schools, filling stations, hospitals, hotels, office buildings
11 Private 29 Contractor Housing, offices, banks, schools, hostels
12 Private 10 Contractor High schools, maternity wards, student hostels, offices
13 Private 10 Client org Markets, fire stations, bus shelters, houses
14 Public 15 Procurement officer Office blocks, houses, farm layouts and different buildings, lodges, banks
15 Private 10 Architect Houses, offices, shops, farm buildings, banks
Table 4: Respondent profile for questionnaire survey
Category Sampling/selection
strategy Subgroup Population Responses
Response rate %
Contractors as at 14 August 2014
Stratified random sampling
Group 1 51 22 43.1
Group 2 30 15 50.0
Group 3 69 43 62.3
Consultants (firms) engaged in buildings
Random sampling
Quantity
surveyor 36 32 88.9
Engineers 32 28 87.5
[image:15.421.68.367.66.384.2]Category Sampling/selection
strategy Subgroup Population Responses
Response rate %
Project managers
(firms) Census
Project
managers 17 14 82.0
Clients Census Public (ministries) Private
6 5
4 2
66.7 40.0
Total 300 198 66.0
The sample size for construction-related professionals was calculated in accordance with the table recommended by Krejcie & Morgan (1970: 608). The table gives recommended sample sizes for general research activities, applicable to any defined population. From the table, the recommended sample size for a population of 300 is 169, for 10 000 it is 370, and for 1 000 000 it is 384. This recommendation validates the sample size of 198 as efficient for the population of 300.
3.3 Data collection
Data collections were twofold: semi-structured interviews and a self-administering questionnaire. An interview protocol was used to collect the primary data for the semi- structured interviews in a face-to-face interaction.
The interview protocol had three main sections. The first section included questions regarding the background of the respondent; the second section, questions on the risks perceived as pertinent to building projects, and the last question addressed the possible risk management and mitigation measures for the risks used in practice. This article deals with only the analysis on pertinent risks. During the interview sessions, probing questions were asked to gain a deeper understanding (Babbie, 2013: 253). The interviews ranged between 30 minutes and 70 minutes. The interviews were captured using a digital recorder. Back-up notes were taken during the session in case any problems occurred with the audio-taping and for respondents who did not agree to be audio-recorded. The recording was then transcribed prior to the commencement of the analysis.
of encountered risks. A reliability test using Cronbach’s Alpha was calculated for the 55 items and the reliability test scored was 0.96. According to Reynold and Santos (1999: 35-36), a Cronbach’s alpha value greater than 0.7 implies that the instrument is reliable.
3.4 Response rate
Of the 222 questionnaires distributed, 198 completed questionnaires were returned, resulting in an overall response rate of 66% (see Table 3). This is beyond the response rate, recommended by Moyo and Crafford (2010: 68) for the built environment, of between 7% and 40%. The number of purposive interviews was well within the range of recommended numbers advocated by Leedy and Ormrod (2014: 196) of between five and 25 respondents (see Table 3). The response rates demonstrate a high level of reliability.
3.5 Data analysis
The research for the semi-structured interviews used content analysis to determine pertinent risk factors and other categories arising. For the questionnaire survey, descriptive statistics in the form of frequency/counts, mean and standard deviation were calculated. In addition, Pareto analysis was conducted to determine the stage at which most of the risks could be mitigated, the owners of the risks considered pertinent, the possible deficiency in knowledge areas using the project management body of knowledge (PMBOK, 2008) and to determine the risk categories of the pertinent risks. A total of 31 pertinent risk factors were generated from a list of 55 important risks generated from the literature and semi-structured interviews. From the literature, over 100 risk factors were generated; some of these were eliminated because they do not apply either to the context of building projects or in the Zambian built environment, e.g. snow, and so on.
3.5.1 Qualitative data analysis from the interviews
The qualitative data arising from the interviews was transcribed and a manual 10-step thematic content analysis, adapted from Burnard (1991: 463-466), was conducted and strictly followed as follows:
1. Notes were made after the interviews regarding topics discussed during the interviews. The interest was mainly in areas considered pertinent to the study.
3. The categories were revisited in order to expand on their meaning in terms of what they were telling the researchers. 4. Any commonalities between categories were identified
and the categories were ranked according to whether they were major or minor categories in terms of the themes they encapsulated.
5. Once the ranking was done, the categories were compared and contrasted, in order to merge and observe any inclinations.
6. A similar approach was done for all the transcripts.
7. The categories from different transcripts were further juxtaposed to identify any fits or divergences, in order to elicit any useful signals from the data.
8. The next stage was simply to check if there was uniformity in all the transcripts in the data.
9. Once discrepancies were dealt with, some categories were merged and some had to be subcategories, as they could, in the whole, be subsumed by major categories.
10. In the last stage, the transcripts were revisited to find out whether all that needs to be done was done, and to avoid any major mistakes in recording data.
In addition to the thematic analysis after the risk factors were identified, a process of categorisation took place. The project management body of knowledge (2008) processes and knowledge areas were used to map out the processes and knowledge areas of the project in which the identified risks could be mitigated. Kagioglou
et al.’s (2000: 148-150) stages of contract were also used to map out the stages in the construction process where the risk factors reside. This was done to give an indication of the project process and stages where a risk could be alleviated or eliminated.
3.5.2 Quantitative data analysis (Questionnaire)
Mbachu & Taylor (2014: 29); Wang & Yuan (2011: 214)]. In addition, Pareto analysis was used. This technique prioritises possible changes by identifying the problems that might be resolved by making the proposed changes. The analysis is based on the Pareto principle, also known as the 80/20 rule, based on the idea that 20% of the causes generate 80% of the results (Kendrick, 2010: online). The Pareto is guided by the following procedure:
• Identify and list problems (risk factors);
• Identify the root cause for each (knowledge area, phase in project, risk category);
• Score problem;
• Group problems together by root cause;
• Add up the score of each group (Kendrick, 2010: online)
4.
Results and discussion
4.1 Respondent profile
The respondents for the interviews had an average of 17 years’ experience, a median of 15 years, and a mode of 10 years. The minimum qualification was first degree, except for procurement officers who had training at advanced diploma level. Table 4 shows that the respondents have been involved in various types of projects with a mix of small- to large-scale building projects.
4.2 Nature of building works engaged in
4.2 Nature of building works engaged in
Figure 2: Building works by volume
New Construction
34%
Renovation 23% Demolition
13% Rebuilding
14%
Extension 16%
Building work by volume
New construction Renovation Demolition Rebuilding Extension
Figure 1: Building works by volume
The findings from the questionnaire survey show that the majority of works, in which consultants, project managers and contractors are engaged, are new works (34% by volume). Renovations and refurbishments (23% by volume) of existing buildings are also common, followed by extension (16% by volume) of existing buildings (Figure 2). The least practised are rebuilding works (14%), which are often necessitated by demolition works (13%).
4.3 Types of buildings
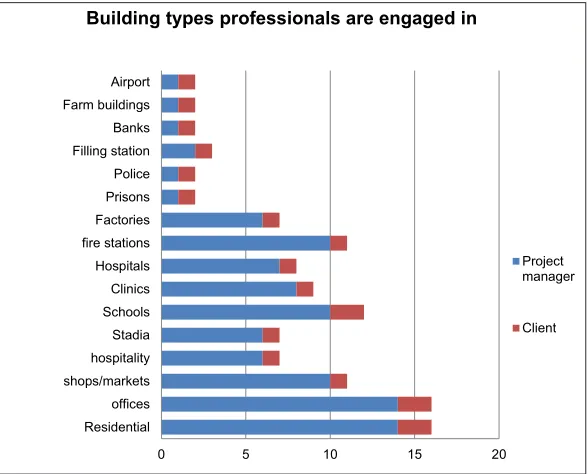
[image:20.421.55.354.55.234.2]
0 5 10 15 20
Residential offices shops/markets hospitality Stadia Schools Clinics Hospitals fire stations Factories Prisons Police Filling station Banks Farm buildings Airport
Building types professionals are engaged in
Project manager
Client
Figure 2: Types of buildings - Questionnaire survey
On examining the two data sets closely (Table 3 and Figure 2), it appears that the common building types in the Zambian construction industry are residential, offices, schools, fire stations and health facilities such as clinics, health centres and hospitals.
4.4 Pertinent risks in the building sector
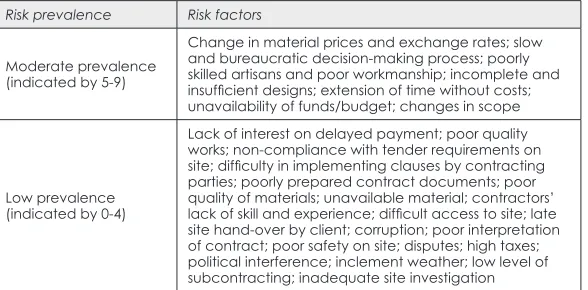
To gain an understanding of the pertinent risks in the Zambian building sector, the respondents were asked to identify pertinent risks, which have been categorised according to prevalence, depending on the count from the content analysis. Table 5 shows the results from the interview data.
Table 5: Risk factors from interviewees
Risk prevalence Risk factors
High prevalence (indicated by 10-15)
[image:21.421.72.366.56.293.2] [image:21.421.69.368.463.526.2]Risk prevalence Risk factors
Moderate prevalence (indicated by 5-9)
Change in material prices and exchange rates; slow and bureaucratic decision-making process; poorly skilled artisans and poor workmanship; incomplete and insufficient designs; extension of time without costs; unavailability of funds/budget; changes in scope
Low prevalence (indicated by 0-4)
[image:22.421.60.354.57.202.2]Lack of interest on delayed payment; poor quality works; non-compliance with tender requirements on site; difficulty in implementing clauses by contracting parties; poorly prepared contract documents; poor quality of materials; unavailable material; contractors’ lack of skill and experience; difficult access to site; late site hand-over by client; corruption; poor interpretation of contract; poor safety on site; disputes; high taxes; political interference; inclement weather; low level of subcontracting; inadequate site investigation
Table 5 shows that the majority of the pertinent risks categorised as highly prevalent are financial in nature, while those categorised as moderately important are mainly linked to scoping and technical know-how. Lastly, the low importance category includes diverse risks that could be termed project specific. These could be linked to managerial or operational risks. The interview data helped generate risks for the questionnaire.
Interviews revealed that clients and consultants (60%) perceived that contractors account for more risks, followed by external risks. In addition, the findings from the interviews and questionnaire point out that stages in the risk management include risk identification (using brainstorming, checklist, local knowledge, and expert judgement) and qualitative risk (brainstorming and expert judgement) analysis, communication and occassional monitoring, especially in the public sector, due to lack of finance and inadequate personnel.
4.5 Pertinent risk categories and risk owner
risk factors affecting construction in the Zambian building sector. The pertinent factors are shown in Table 6.
Table 6: Pertinent risks factors in the Zambian building sector from questionnaire survey
Risk factor N Mean deviationStd. rankRisk
Lack of clarity of drawings and technical
specifications 180 4.328 .775 1
Contractor’s underestimate of construction cost 194 4.309 .793 2
Client’s financial stability 197 4.254 .787 3
Contractor’s financial difficulties 191 4.157 .904 4
Defective workmanship and rework 193 4.124 .767 5
Poor supervision 184 4.103 .878 6
Poor quality materials 193 4.067 .872 7
Errors and omissions in design drawings 192 4.057 .875 8
Unclear scope of works 185 4.054 .901 9
Inadequate site investigation 191 4.037 .903 10
Poor coordination and communication 192 4.036 .808 11
Poor supervision on site 190 4.016 .826 12
Inadequate budgeting and contingencies 194 4.016 .908 13 Poor planning of resources - materials, labour,
equipment 195 4.010 .919 14
Delay in payment process by the client 194 3.990 .846 15
Lack of inspection of works 189 3.990 .881 16
Delay in consultant’s approval of materials
submission 197 3.980 .926 17
Inadequate specification 194 3.974 .890 18
Escalation in material prices 191 3.974 .986 19
Lack of coordination among design disciplines 190 3.963 .939 20 Delay in contractor’s payment certification by
the consultant 193 3.953 .909 21
Poor labour productivity 192 3.938 .890 22
Omission in design contract documents 189 3.937 .873 23
Risk factor N Mean deviationStd. rankRisk
Delay in consultant’s approval of shop drawings 193 3.907 .953 25 Delay in consultant’s response to requests for
information 196 3.898 .900 26
Unstable exchange rates 191 3.895 .906 27
Ineffective monitoring of risks 193 3.855 .935 28
Late delivery of materials 192 3.849 .900 29
Lack of experience in similar projects 194 3.835 .860 30
Frequent change of orders by client 192 3.823 .921 31
Though not all respondents ranked each risk, the responses obtained present a reliable overview. The respondents were diverse in nature and some decided not to provide a response for areas outside their expertise, as they feel that they are not qualified to rank the risk or that their knowledge on the influence of a particular risk was limited.
Table 7: Pertinent risk factors in the Zambian building sector
Risk factor Internal External Risk category Risk owner
Lack of clarity of drawings and
technical specifications X Design Consultant
Delay in consultant’s approval
of materials submission X Managerial Consultant
Inadequate site investigation X Technical Consultant
Inadequate specification X Technical Consultant
Omission in design contract
documents X Design Consultant
Delay in contractor’s payment
certification by the consultant X Managerial Consultant Delay in consultant’s response
to requests for information X Managerial Consultant
Delay in consultant’s approval
of shop drawings X Managerial Consultant
Poor supervision X Managerial Consultant
Errors and omissions in design
drawings X Design Consultant
[image:24.421.55.351.56.195.2]Risk factor Internal External Risk category Risk owner
Poor quality materials X Technical Consultant/ Contractor
Poor supervision on site X Managerial Contractor/ Project manager Poor planning of resources -
materials, labour, equipment X Managerial Contractor
Contractor’s underestimate of
construction cost X Financial Contractor
Late delivery of materials X Managerial Contractor
Lack of experience in similar
projects X Technical Contractor
Contractor’s financial difficulties X Financial Contractor Defective workmanship and
rework X Technical Contractor
Unstable exchange rates X Economic Client/ Contractor
Escalation in material prices X Economic Client/ Contractor
Client’s financial stability X Financial Client
Delay in payment process by
the client X Managerial Client
Frequent change orders by
client X Managerial Client
Inadequate budgeting and
contingencies X Technical Client/ Consultant
Unclear scope of works X Managerial Client
Poor coordination and
communication X Managerial Project manager
Lack of inspection of works X Managerial Project manager/ Consultant Lack of coordination among
design disciplines X Managerial Project manager
Holding key decisions in isolation X Managerial Project manager
4.5.1 Risk categories
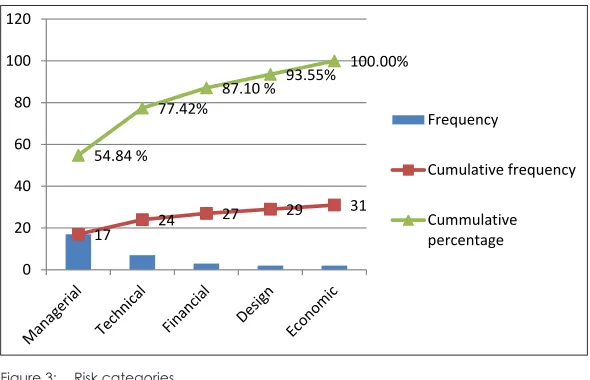
Figure 3 shows the risk categories for the pertinent risks, with over half (54.84%) of the risks being managerial/operational in nature. The lowest categories are economic risks (which is normally grouped with financial risks) and design. Economic risks are normally external in nature, while financial risks are normally internal, hence the need to separate them in this instance. The Pareto chart shows that the managerial, technical and financial risks are risk categories associated with 80% of the pertinent risks.
[image:26.421.57.352.167.357.2]Figure 4: Risk categories
17 24 27
29 31
54.84 %
77.42% 87.10 %
93.55% 100.00%
0 20 40 60 80 100 120
Frequency
Cumulative frequency
Cummulative percentage
Figure 3: Risk categories
These results are not different to risks categories shown in Tables 1 and 2 for risks found in other countries. Therefore, the planning phase and monitoring phase should be given particular attention to these categories of risk. Moreover, going by the Pareto analysis, it can be argued that paying particular attention to these processes will result in mitigation of 80% of the risks (Kendrick, 2010: online).
4.5.2 Risk owner
Figure 5: Risk owner analysis
13
24 31
37 21.21%
54.55% 63.64%
100.00%
0 20 40 60 80 100 120
Frequency
Cumulative frequency
Cummulative percentage
Figure 4: Risk owner analysis
The Pareto chart in Figure 4 shows all project participants as risk owners of pertinent risks at 80%. However, consultants and contractors account for over 50% of the risks. This means that both parties’ contractor and consultant (normally acting on behalf of clients) should contribute more in managing risk.
4.6 Pertinent risks according to project stage and knowledge area
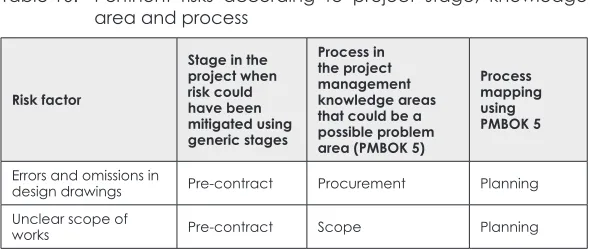
The mitigation stages for the pertinent risks shows that the majority of the risks occur in the construction phase, while others occur in the planning stage-pre-contract phase (see Table 10).
Table 10: Pertinent risks according to project stage, knowledge area and process
Risk factor
Stage in the project when risk could have been mitigated using generic stages
Process in the project management knowledge areas that could be a possible problem area (PMBOK 5)
Process mapping using PMBOK 5
Errors and omissions in
design drawings Pre-contract Procurement Planning
Unclear scope of
[image:27.421.71.366.411.536.2]Risk factor
Stage in the project when risk could have been mitigated using generic stages
Process in the project management knowledge areas that could be a possible problem area (PMBOK 5)
Process mapping using PMBOK 5
Inadequate site
investigation Pre-contract Scope Planning
Inadequate budgeting and
contingencies Pre-contract Cost Planning
Inadequate
specification Pre-contract Procurement Planning
Omission in design
contract documents Pre-contract Procurement Planning Clarity of drawings
and technical
specifications Pre-contract Procurement Planning
Lack of experience in
similar projects Tender stage-Pre-contract Human resources Planning Contractor’s
underestimate of construction cost
Tendering-Pre-Contract Cost Planning
Contractor’s financial
difficulties Construction Cost Execution
Defective workmanship and
rework Construction Quality
Monitoring and control
Poor supervision by
consultants Construction Integration Monitoring and control Poor quality materials Construction Quality Execution Poor coordination and
communication Construction Communications Whole project cycle Poor supervision on
site - contractor Construction Integration Execution Poor planning of
resources - materials,
labour, equipment Construction Procurement Execution Delay in payment
process by the client Construction Cost Execution
Lack of inspection of
works Construction Integration Monitoring and control Delay in consultant’s
approval of materials
Risk factor
Stage in the project when risk could have been mitigated using generic stages
Process in the project management knowledge areas that could be a possible problem area (PMBOK 5)
Process mapping using PMBOK 5
Escalation in material
prices Construction Cost Execution
Delay in contractor’s payment certification
by the consultant Construction Cost
Monitoring and control
Poor labour
productivity Construction Human resources Execution Holding key decisions
in isolation Construction Communication Execution Delay in consultant’s
approval of shop
drawings Construction Time Execution
Delay in consultant’s response to requests
for information Construction Integration Execution Unstable exchange
rates Construction Cost Monitoring and control
Ineffective monitoring
of work Construction Integration Monitoring and control Late delivery of
materials Construction Procurement Execution
Lack of coordination among design
disciplines Project cycle Communication
Monitoring and control
Frequent change
orders by client Project cycle Scope Execution
Client’s financial
stability Project cycle Financial Whole project cycle
4.6.1 Risk stage
Figure 6: Risk stage
19 28 31
61.29%
90.32% 100.00%
0 20 40 60 80 100 120
Frequency
Cumulative frequency
Cummulative percentage
Figure 5: Risk stage
4.6.2 Knowledge area
[image:30.421.58.352.312.514.2]Several knowledge areas are essential for managing projects. The pertinent areas that seem to be attributed to the risks are shown in Figure 6.
Figure 7: Knowledge area
7 12
16 19 22 24
26 28 30 31
22.58% 38.71%
51.61% 61.29%
70.97%77.42%
83.87%90.32%
96.77%100.00%
0 20 40 60 80 100 120
Frequency Cumulative frequency Cummulative percentage
The Pareto analysis in Figure 6 shows that 80% of the pertinent risks are caused by inappropriate application and/or lack of knowledge in cost management, procurement management, integration management, human resources management, communication management, time management, and scope management. The knowledge areas accounting for over 50% of performance are cost, procurement, scope, and integration management.
4.6.3 Process management
The Pareto analysis in Figure 7 shows that 80% of the pertinent risks are caused by inappropriate application and/or lack of knowledge in project execution, project planning, and monitoring and control. The processes accounting for over 50% of ineffective processes are execution and planning.
29.03% 54.84%
93.55%100.00%
12 21
29 31
0 20 40 60 80 100 120
Frequency
Cummulative percentage Cumulative frequency
Figure 7: Processes
5.
Discussion
[image:31.421.70.364.225.435.2]5.1 Nature of pertinent risks and risk owner
The results show that the majority of the pertinent risks are internal in nature. This implies that the mitigation of these risks lies within the project team on a given project. Therefore, risks can be reduced by careful risk planning (Goh & Abul-Rahman, 2013: 21) by the project team. This can be coupled with the selection of participants with capabilities to mitigate such risks. The important risks are from the managerial, technical and financial categories. This implies that the contracting parties must pay particular attention to these categories of risk and sharpen their skills in the aforementioned management areas. This could be dealt with during the pre-contract phase. The results in section 4.5.2 show that all project participants, to some extent, account for the risks experienced on projects. Nevertheless, both parties (client and contractor) should carry out their roles to mitigate risks (Lehtiranta & Junnonen, 2014: 143; Mu, Chen, Chohr & Peng, 2014: 453) and improve performance. From a traditional procurement perspective, the client needs to put more effort into risk mitigation. This is important, because the interviews revealed that clients and consultants (60%) perceived that contractors account for more risks, although the analysis by risk owner proves otherwise. It has been argued that perceptions influence how risks are responded to and planned for (Lehtiranta, 2014: 641). Moreover, Amundurud and Aven (2015: 43) argue that decisions on risk are strongly dependent on perception. Consequently, imperfect perceptions may account for improper risk response and planning (Floricel, Bonneau, Aubry & Sergi, 2014: 1093). The imperfect perception by parties in the building sector could account for the poor performance in the sector. The findings provide evidence that both parties contribute to undesirable performance (quality shortfalls, cost/time overruns). This calls for the parties to manage their risks better.
5.2 Stage of project where risks should be mitigated
unclear specifications and omissions in design eventuate. Planning should, therefore, be effectively carried out to reduce risks in the construction stage.
5.3 The deficient knowledge areas
The PMBOK (2008: 69) posits that effective management of projects requires the application of all knowledge areas. While risk management is a distinct knowledge area, it has been demostrated, in this instance, that other knowledge areas must be applied, in order to manage risks in the construction industry, as the findings show that, for effective mitigation to be in place, all other knowledge areas might need to be applied. The Zambian building sector professionals need to gain more knowledge in cost management, procurement management, integration management, communication manage-ment, time managemanage-ment, human resources managemanage-ment, and scope management, in order to mitigate 80% of the eventuating risks. It has been argued that risks occur on projects due to lack of skill in risk management (Dey, 2001: 634; Chileshe & Kikwasi, 2014). The findings show that skill is also needed in other knowledge areas. This view is supported by Perez, Gray & Martin (2016: 8) who identify project management, technical and business management skills as skills needed for effective risk management in Queensland. In addition, the findings from the interviews and questionnaire point out that stages in the risk management conducted include risk identification and qualitative risk analysis, communication and occassional monitoring, especially in the public sector, due to lack of finance. It was clear that quantitative risk analysis is rarely done, due to lack of knowledge. This implies that the posibility of occurrence and impacts of such risk rarely have values attached to the possible loss.
6.
Conclusion
the pertinent risks and to point out possible mitigation and alleviation area for risks.
The mentioned knowledge areas, coupled with an improvement of skill in quantitative risk analysis and risk monitoring by contractors and consultants, could improve project delivery in the building sector. However, the gaps identified in this study may not be the same for other sectors of construction, such as roads, bridges, and so on. Therefore, a similar methodology could be applied to other sectors to decipher the knowledge areas needed in relation to the risks faced in the specific sector, in order to improve project delivery.
References
Adams, J., Khan, H.T.A., Raeside, R. & White, D. 2012. Research methods for graduate business and social science students. 8th edition. Washingston DC: Sage.
Agyakwa-Baah, A. & Chileshe, N. 2009. An empirical study of risk analysis and its impact on construction projects - the case of Ghana. Proceedings of the 6th International Conference on Innovation in Architecture, Engineering and Construction (AEC), 9-11 June 2009, State College, Pennsylvania (PA). Loughborough University, U.K., Pennsylvania State University, pp. 926-938.
Aibinu, A. & Odeyinka, A. 2006. Construction delays and their causation factor in Nigeria. Journal of Construction Engineering and Management, 132(7), pp. 667-677. https://doi.org/10.1061/ (ASCE)0733-9364(2006)132:7(667)
Al-Bahar, J.F. & Crandall, K.C. 1990. Systematic risk management approach for construction project. Journal of Construction Engineering and Management, 116(3), pp. 533-546. https://doi. org/10.1061/(ASCE)0733-9364(1990)116:3(533)
Alinaitwe, H.M. (Eds). Proceedings of the Second International Conference on Advances in Engineering and Technology, 31 January-1 February 2011, Entebbe, Uganda. Uganda: Macmillan, pp. 305-311.
Amundurud, O. & Aven, T. 2015. On how to understand and acknowledge risk. Realibility Engineering and System Safety, 142, pp. 42-47. https://doi.org/10.1016/j.ress.2015.04.021
the Second International Conference on Advances in Engineering and Technology, 31 January-1 February 2011, Entebbe, Uganda. Uganda: Macmillan, pp. 305-311.
Ardeshir, A., Mohajeri, M. & Amiri, M. 2016. Evaluation of safety risks in construction using Fuzzy Failure Mode and Effect Analysis (FFMEA).
Scientia Iranica. Transaction C, Chemistry, Chemical Engineering,
23(6), pp. 2546-2556.
Auditor General’s Office. 2009. Report of the Auditor General on the accounts of the Republic for the financial year ended 31st December 2009, for the period 2006-2009.Lusaka, Zambia: Government Press. [online]. Available at: <http://www.ago.gov.zm> [Accessed: 15 February 2017].
Auditor General’s Office. 2013. Report of the Auditor General on the accounts of the Republic for the financial year ended 31st December
2012, for the period 2009-2012. Lusaka, Zambia: Government Printers.
[online]. Available at: <http://www.ago.gov.zm> [Accessed: 15 February 2017].
Australian & New Zealand Risk Management Standard-AS/NZS 436. 1999. Australian & New Zealand Risk Management Standard. s.l.: Australian & New Zealand Risk Management Standard.
Babbie, E. 2013. The practice of social research. 13th international edition. Boston: Wadsworth Cengage learning.
Baloi, D. & Price, A. 2003. Modelling global risk factors affecting construction cost performance. International Journal of Project Management, 21(4), pp. 261-269. https://doi.org/10.1016/ S0263-7863(02)00017-0
Barlish, K., Marco, D. & Thaheem, A. 2013. Construction risk taxonomy: An international convergence of academic and industry perspectives. American Journal of Applied Sciences, 10(7), pp. 706-713. https://doi.org/10.3844/ajassp.2013.706.713
Belel, A.Z. & Mahmood, H. 2012. Risk management practices in the Nigerian construction industry - A case study of Yola. Continental Journal of Engineering Sciences, 7(3), pp. 1-6.
Bryman, A. & Bell, E. 2015. Business research methods. International 4th edition. Oxford: Oxford University Press.
Business Dictionary. 2016. Online business dictionary. [online]. Available at: <www.businessdictionary.com/> [Accessed: 15 February 2017].
Cano, A. del & Cruz, M.P. de la. 2002. Integrated methodology for project risk management. Journal of Construction Engineering and Management, 128(6), pp. 473-485. https://doi.org/10.1061/ (ASCE)0733-9364(2002)128:6(473)
Chapman, C. & Ward, C. 2003. Project risk management: Processes, techniques and insights. Chester: Wiley.
Charoenngam, C. & Yeh, C.-Y. 1999. Contractual risk and liability sharing in hydropower construction. International Journal of Project Management, 17(1), pp. 29-37. https://doi.org/10.1016/ S0263-7863(97)00064-1
Chihuri, S. & Pretorius, L. 2010. Managing risk for success in South African engineering and construction project environment. South African Journal of Industrial Engineering, 21(2), pp. 63-77. https://doi. org/10.7166/21-2-50
Chileshe, N. & Kikwasi, G.J. 2014. Risk assessment and management practices (RAMP) within the Tanzanian construction industry: Implementation barriers and advocated solutions. International Journal of Construction Management, 14(4), pp. 239-254. https://doi. org/10.1080/15623599.2014.967927
Choudry, R., Aslam, M., Hinze, J. & Arain, F. 2014. Cost and schedule risk analysis of bridge construction in Pakistan: Establishing risk guidelines. Journal of Construction Engineering and Management,
140(7), pp.1-9. https://doi.org/10.1061/(ASCE)CO.1943-7862.0000857 Chung, D., Hansher, D.A. & Rose, J.M.R. 2010. Toward the betterment of risk allocation: Investigating risk perceptions of Australian stakeholders groups to PPP toll road projects. Research in Transportation Economics, 30(1), pp. 43-58. https://doi.org/10.1016/j. retrec.2010.10.007
Creswell, W.J. & Clark, P.L.V. 2011. Designing and conducting mixed methods research. London: Sage.
Dey, K.P. 2001. Decision support system for risk management.
Management Decision, 39(8), pp. 634-649. https://doi. org/10.1108/00251740110399558
construction projects. Canadian Journal of Civil Engineering, 33(1), pp. 58-68. https://doi.org/10.1139/l05-087
Doloi, H., Sawhney, A., Iyer, K. & Rentala, S. 2012. Analysing factors affecting delays in India construction projects. International Journal of Project Management, 30(4), pp. 479-489. https://doi.org/10.1016/j. ijproman.2011.10.004
Ebrahimnejad, S., Mousav, S.M.I. & Seyrafianpour, H. 2010. Risk identification and assessment for BOT projects: A Fuzzy Multi-Attribute decision-making model. Expert Systems with Application, 37(1), pp. 575-586. https://doi.org/10.1016/j.eswa.2009.05.037
Enshassi, A., Al-Najjar, J. & Kumaraswamy, M. 2009. Delays and cost overruns in the construction projects in the Gaza strip. Journal of Financial Management of Property and Construction, 14(2), pp. 126-151. https://doi.org/10.1108/13664380910977592
Floricel, S., Bonneau, C., Aubry, M. & Sergi, V. 2014. Extending project management research: Insight from social theories. International Journal of Project Management, 32(7), pp. 1091-1107. https://doi. org/10.1016/j.ijproman.2014.02.008
Frimpong, Y., Oluwoye, J. & Crawford, L. 2003. Causes of delay and cost overruns in construction of groundwater projects in a developing country: Ghana as a case study. International Journal of Project Management, 21(5), pp. 321-326. [online]. Available at: <http://dx.doi.org/10.1016/S0263-7863(02)00055-8> [Accessed: 15 February 2017].
Ghosh, S. & Jintanapakanont, J. 2004. Identifying and assessing the critical risk factors in an underground rail project in Thailand: A factor analysis approach. International Journal of Project Management,
22(8), pp. 633-643. https://doi.org/10.1016/j.ijproman.2004.05.004 Goh, S.C. & Abul-Rahman, H. 2013. The identification and management of major risks in the Malaysian construction industry.
Journal of Construction In Developing Countries, 18(1), pp. 19-32. He, Y. 2010. Environmental management on projects. International Journal of Business Management, 5(1), pp. 205-210.
Hilson, D. 2002. Extending the risk process to manage opportunities.
International Journal of Project Management, 20(3), pp. 235-240. https://doi.org/10.1016/S0263-7863(01)00074-6
International Journal of Project Management, 32(1), pp. 116-124. https://doi.org/10.1016/j.ijproman.2013.01.007
ISO. 2012. International Organization for Standardization. International standard ISO 21500. Guidance on project management. [online]. Available at: <https://www.iso.org/obp/ui/#iso:std:iso:21500:en> [Accessed: 20 January 2017].
Iyer, K. & Jha, K.N. 2005. Factors affecting cost performance: Evidence from Indian construction projects. International Journal of Project Management, 23(4), pp. 283-295. https://doi.org/10.1016/j. ijproman.2004.10.003
Jafaari, A. 2001. Management of risks, uncertainties and opportunities on projects: Time for a fundamental shift. International Journal of Project Management, 19(2), pp. 89-101. https://doi.org/10.1016/ S0263-7863(99)00047-2
Jarkas, A.M. & Haupt, C.T. 2015. Major construction risk factors considered by general contractors in Qatar. Journal of Engineering, Design and Technology, 13(1), pp. 165-194. https://doi.org/10.1108/ JEDT-03-2014-0012
Kagioglou, M., Cooper, R., Aouad, G. & Sexton, M. 2000. Re-thinking construction: The generic design and construction process protocol.
Engineering, Construction and Architectural Management, 7(2), pp. 141-153. https://doi.org/10.1108/eb021139
Kaliba, C.J., Muya, M. & Sichombo, B. 2009a. Cost escalation and schedule delays in road construction. International Journal of Project Management, 13(1), pp. 522-531. https://doi.org/10.1016/j. ijproman.2008.07.003
Kaliba, C.J., Muya, M. & Sichombo, B. 2009b. The need to reduce costs, schedule overruns and quality shortfalls in construction.
Proceedings of the 4th Built Environment Conference 17-19 May 2009, Livingstone, Zambia. Bellville, South Africa: Association of Schools of Construction of Southern Africa, pp. 154-158.
Kartam, N.A. & Kartam, S.A. 2001. Risk and its management in Kuwait construction industry: A contractor’s perspective. International Journal of Project Management, 19(6), pp. 325-335. https://doi. org/10.1016/S0263-7863(00)00014-4
Krejcie, R.V. & Morgan, D.W. 1970. Determining sample size for research activities. Educational and Psychological Measurement, 30(3), pp. 607-610. https://doi.org/10.1177/001316447003000308 Kuo, Y.C. & Lu, S.T. 2012. Using fuzzy multiple criteria decision making approach to enhance risk assessment for metropolitan construction projects. International Journal of Project Management, 31(4), pp. 602-614. https://doi.org/10.1016/j.ijproman.2012.10.003
Lam, K., Wang, P., Lee, T.K. & Tsang, Y.T. 2007. Modelling risk allocation decision in construction contracts. International Journal of Project Management, 25(5), pp. 485-493. https://doi.org/10.1016/j. ijproman.2006.11.005
Leedy, P.D. & Ormrod, J.E. 2014. Practical research planning and design. 10th edition. New York: Pearson.
Le-Hoai, L., Lee, Y.D.L. & Lee, J.Y. 2008. Delay and cost overruns in Vietnam large construction projects. KSCE Journal of Civil Engineering,
12(6), pp. 367-377. https://doi.org/10.1007/s12205-008-0367-7
Lehtiranta, L. 2014. Risk perceptions and approaches in multi-organisations: A critical review 2000-2012. International Journal of Project Management, 32(4), pp. 640-653. https://doi.org/10.1016/j. ijproman.2013.09.002
Lehtiranta, L. & Juunonen, J.-M. 2014. Stretching risk management standards: Multi-organisational perspectives. Built Environment Project and Asset Management, 4(2), pp. 128-145. https://doi. org/10.1108/BEPAM-06-2013-0019
Lichtenthaler, M. 2017. Project and claim management at a glance. [online]. Available at: <https://www.doag.org/formes/servlet/DocN avi?action=getFile&did=5018332> [Accessed: 10 October 2017]. Lyons, T. & Skitmore, M. 2004. Project risk management in the Queensland engineering construction industry: A survey. International Journal of Project Management, 22(1), pp. 51-61. https://doi. org/10.1016/S0263-7863(03)00005-X
Mahamid, I. 2011. Risk matrix for factors affecting time delay in road construction projects: Owner’s perspectives. Engineering, Construction and Architectural Management, 18(6), pp. 609-617. https://doi.org/10.1108/09699981111180917