Abstract— Integration of sustainable development in the business and supply chain is potentially a source of competitive differentiation for firms. Sustainable supply chain (SSC) management is the management of material, information and capital flows as well as cooperation among companies along the supply chain while taking goals from all three dimensions of sustainable development, i.e., economic, environmental and social, into account which are derived from customer and stakeholder requirements. By using the quality function deployment (QFD) as a product/system development tool, an effective SSC structure can be obtained. The objective of this study is to apply an extended QFD methodology in SSC by introducing a new group decision making (GDM) approach that takes into account incomplete information of decision makers by means of fuzzy set theory. This methodology is compatible with the requirements of the various stakeholders, suppliers, manufacturers and clients, involved in the supply chain. Finally, to assess the validity of the proposed approach, a specific supply chain example is given.
Index Terms—Fuzzy sets, incomplete preference relations, quality function deployment, sustainable supply chain management.
I. INTRODUCTION
Organizations worldwide are continuously trying to develop new and innovative ways to gain and maintain a competitive advantage in the global market. In response to heightened governmental regulations and rising public awareness of the effect of industrial production on the environment, many organizations are now undertaking major initiatives to transform their supply chain processes [1]. Consideration is given to the convergence of supply chains and sustainability [2]. The emergence of sustainable supply chain (SSC) is one of the most significant developments in the past decade, offering the opportunity for companies to align their supply chains in accordance with environmental and sustainability goals.
Great efforts have recently resulted in increasing the environmental performance of supply chains. However, to obtain more sustainable solutions, organization properties must meet SSC and customer requirements. Especially, quality function deployment (QFD) is one of the techniques for designing needs of customer and turning them into
1
Manuscript received March 23, 2010. This work was financially supported by The Scientific and Technological Research Council of Turkey (TUBITAK).
G. Büyüközkan is with the Industrial Engineering Department, Galatasaray University, İstanbul, 34357 Turkey (corresponding author to provide phone: +90 212 227 4480; fax: +90 212 259 5557; e-mail: [email protected] ).
practical measures. This approach enables the firms to become proactive to quality problems rather than taking a reactive position by acting on customer complaints. The approach bases on total quality management, which offers a vast technique to ensure the improvement of quality and productivity. QFD is comprised of major group decision making (GDM) processes. In practice, determining the weights of customer requirements (CRs) is a GDM process. This mainly because of the ‘danger’ of relying on a single decision maker (DM) with his/her limitations of experiences, preferences or biases about the issues involved, and the fact that individuals are often unable to clearly identify their own states. Multiple DMs, thus GDM, are often preferred rather than a single DM to avoid the bias and minimize the partiality in the decision process [3]–[6].
Generally, different and/or even subjective opinions are quite often in a GDM process due to the limitations of experience and impreciseness. Obviously, the importance of each CR in QFD is determined by a group of people with ambiguity. In addition, due to constraints as time pressure, lack of expertise in related issue, etc.; decision makers (DMs) may develop incomplete preferences in which some of the elements cannot be provided. Under such circumstances, fuzzy set theory [7] and incomplete preference relations [8]–[14] can be applied to deal with group decisions when the information is imprecise and missing.This paper develops a new fuzzy logic based GDM approach in QFD with incomplete preference relations.Moreover, aspecific supply chain example is provided to show the proposed GDM approach can be effectively used in QFD. As incomplete preferences in fuzzy environments are not widespread yet, there exists no study in literature that neither combines it with QFD or any other methods, nor applies it inSSC management (SSCM)field.
The paper is organized as follows. In section 2, SSCM concept and model description are given. Section 3 describes the proposed approach and computational procedure step by step. After the application of the SSC model in Section 4, Section 5 contains some concluding remarks.
II. SUSTAINABLESUPPLYCHAINMANAGEMENT
A. Requirements for a SSCM
Firstly to provide a sense of its concept, SSC contains the integration of environment, economic and social performances. The interaction between sustainability and supply chains is the critical next step from recent
G. Çifçi is with the Industrial Engineering Department, Galatasaray University, İstanbul, 34357 Turkey (e-mail: [email protected] ).
Analysis of the Sustainable Supply Chain
Structure with Incomplete Preferences
examinations of operations and the environment [15] and operations and sustainability [16]. Interest in green and now sustainable supply chains has been growing for over a decade and the topic is becoming mainstream [16]–[19]. Seuring and Müller [20] define SSC as “the management of material, information and capital flows as well as cooperation among companies along the supply chain while taking goals from all three dimensions of sustainable development, i.e., economic, environmental and social, into account which are derived from customer and stakeholder requirements”. Another definition comes from Pagell and Wu [18]: “SSC is one that performs well on both traditional measures of profit and loss as well as on an expanded conceptualization of performance that includes social and natural dimensions”. Discussions of sustainability are driven by the basic notion that a supply chain’s performance should be measured not just by profits, but also by the impact of the chain on ecological and social systems [18], [21]–[23].
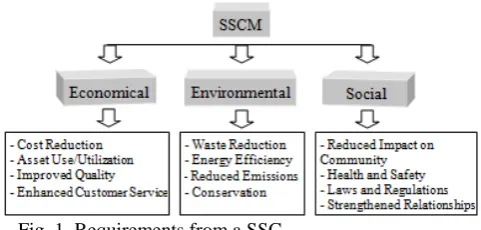
[image:2.595.48.289.360.475.2]Different authors and researchers have defined SSCM from similar and different perspectives, driving forces and purposes. However, all SSCM structures have commonly tree main aspects, namely economical, environmental and social. Fig. 1 depicts the requirements defined according to literature survey and expert views.
Fig. 1. Requirements from a SSC
Economical requirements (CR1): There is no doubt that
cost reduction and continuing financial benefit are fundamental goals of a supply chain. A number of studies have found that an increased emphasis on sustainability in the supply chain is related to lower costs and a neutral or positive effect on value [24]–[26]. Asset utilization is another important concern in SSC [27]–[30]. Reducing the materials used is needed for efficiency of the supply chain. Quality level should be maximized because quality is sine qua non for environmental protection and sustainable development. Quality is a widely accepted performance indicator for SSCs and it represents a common driving force for sustainable supply activities [24], [31], [32]. Finally, to enhance customer service is one the main focuses of SSCs. Several studies identified a trend that organizations are integrating environmental processes to their supply chains to reduce operating costs and improve their customer service [24]–[26].
Environmental Requirements (CR2): The four major
economical requirements dimensions are waste reduction, emission reduction, energy efficiency and conservation. The environmental based expectations of companies from a SSC are reduction of waste produced, material substitution through environmental sourcing of raw materials, waste minimization of hazardous materials, efficient use of energy, fuel and
environment conservation [1], [28], [30], [32]. The environmental practices are dependent on wider aspects to be integrated in order to achieve firm’s goal of waste elimination and lower environmental impact. Hence, firms must integrate environmental aspects to ensure corporate survival and toward sustainable development. Rothenberg [33] noted that pollution prevention-environmental activities are often value-added for the firm since they reduce costs through material use reduction or through the avoidance of waste management costs.
Social Requirements(CR3): Social requirements comprise
four main dimensions such as reduced impact on community, health and safety, strengthened relationships, and laws and regulations. The aims to comply with legal requirements and to create a systematic management system have been reported as important driving forces for companies to implement sustainable/environmental activities [26], [32], [34]. Commitment to health and safety which meets minimum legal requirements is also needed as a social responsibility in a SSC. As final target, strengthened customer and business partner relationships is an important requirement for a SSC. By this means, firms can gain competitive advantage and improve firm performance.
B. Design Requirements for a SSCM structure
As a result of the literature survey in the previous section and expert views, determined design requirements (DRs) for a SSCM are:
DR1: Price strategy
DR2: SC optimization
DR3: Supplier management
DR4: Flexible technology
DR5: Delivery performance
DR6:Environmental management system (ISO quality
standards)
DR7: Environmental product design
DR8:Environmental activity capability (reuse, recycle,
back packaging, ...)
DR9: Eco-friendly transportation
DR10: Collaboration with partners
DR11: Employee Practices (labor education, …)
DR12: Protecting rights (suppliers, customers,
property, etc.)
III. INTEGRATEDQFD METHODOLOGY
A. HOQ of QFD
unified accounts of the QFD concepts and procedures, which is uncommon for such a popular methodology and may be quite confusing for non-specialists [36].
The technique is characterized by a matrix called the House of Quality (HOQ) which is represented in Fig. 2. This matrix contains information about what to do (e.g., what customers want), how to do it (e.g., how technically CRs can be achieved), and the relationships between each of these aspects; prioritization of CRs and DRs; and what are the company's target levels. Quality functions are deployed by carrying ''how to do'' into the successive HOQ as ''what to do'' [37]. The detailed steps of HOQ applied in this paper can be seen in Sec. III-C.
Hows – SSC Design Requirements Whats
-SSC Customer Requirements
Relation Matrix CR
Analysis
[image:3.595.344.510.141.223.2]DR Analysis
Figure 2. HOQ for SSC development
B. Incomplete Preference Relations
Recently, linguistic preference relations used by decision makers to express their linguistic preferences when comparing decision alternatives have been investigated in many documents [38]–[41]. Each of these preference relations necessitates the completion of all n(n-1)/2 judgments in its entire top triangular portion. Sometimes, however, it is difficult to obtain such a preference relation. This may be due to an expert not possessing a precise or sufficient level of knowledge of part of the problem, or because that expert is unable to discriminate the degree to which some options are better than others [10]. Since QFD approach contains multiple DMs and group decision process, with the use of incomplete preference relations, the evaluation would be more strong and healthier. As incomplete fuzzy preferences are not widespread as of today, incomplete preference studies are limited in the literature [10]–[14], [42], [43]. In addition there exists no study in the literature that neither combines those with QFD, nor any applications in the SSCM field.
C. The Computational Procedure of Proposed Approach
Step by step description of the proposed approach is as follows.
Step 1: “Whats”: This first step can also be called as
identifying the CRs. In this step customer requirements must be identified and placed on the left side of the house. These requirements can be identified by making questionnaires to customers, by expert views, by literature survey, etc.
Step 2: “Priority Analysis”: In this step, a comparison of the CRs is wanted to determine the importance degrees. However, the information gained from DMs may not be adequate to accurately assign the importance degrees. We will overcome this obstacle through fuzzy GDM.
Step 2.1: “CR Evaluation”. Firstly, for the purpose of measuring the importance degrees among CRs, it is required
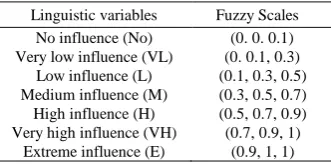
to design a comparison scale. The scale shown in Table I is used to indicate the relative strength of each pair of elements p~ij = (plij, pmij, puij) which indicates the importance among the compared criteria (importance ofioverj) wherei=
[image:3.595.57.283.224.311.2]j= 1,2,…,n.
Table I. Corresponding linguistic terms Linguistic variables Fuzzy Scales
No influence (No) (0. 0. 0.1) Very low influence (VL) (0. 0.1, 0.3)
Low influence (L) (0.1, 0.3, 0.5) Medium influence (M) (0.3, 0.5, 0.7) High influence (H) (0.5, 0.7, 0.9) Very high influence (VH) (0.7, 0.9, 1)
Extreme influence (E) (0.9, 1, 1)
Step 2.2: “Completion of the missing values”. Once the DMs construct and evaluate the fuzzy pairwise comparison matrices of components, defuzzify those using Eq. (1).
10
ij x ij
x
ij 1/2 p p d
p
F ~ inf ~ sup ~ (1)
Then, missing values in a DM’s incomplete preference relation can be computed. Based on Tanino’s [44] “additive transitivity” property, by using an intermediate alternativeay, the preference value of pij (i ≠ j) can be calculated in three ways [10]:
1. Frompij piy pyj0.5, we obtain the estimate 5
. 0
1
yj iy y
ij p p
cp (2)
2. Frompyj pyipij 0.5, we obtain the estimate 5
. 0
2
yi yj y
ij p p
cp (3)
3. Frompiy pij pjy0.5, we obtain the estimate 5
. 0
3
jy iy y
ij p p
cp (4)
The preference value of one alternative over itself is always assumed to be equal to 0.5.
Step 2.3: “Checking the consistency level”. When working with the incomplete preference relation, the following sets can be used to estimate its consistency level:
1
ij
H = {y ≠ i, j |(i, y),(y, j)
EV} (5)2
ij
H = {y ≠ i, j |(y, i),(y, j)
EV} (6)3
ij
H = {y ≠ i, j |(i, y),(j, y)
EV}. (7)where EV is the set of pairs of alternatives for which the expert provides preference values, and Hij1 ,Hij2,Hij3 are
the sets of intermediate alternative ay(y ≠ i,j) that can be used
to estimate the preference value pij (i ≠ j) using (5)–(7), respectively.
The consistency level CLij, associated with a preference value pij (i ≠ j)
EV,
2 1
1 ij ij ij i j ij
CP CP p
CL ,αij
[0,1] (8)is defined as a linear combination of the average of the completeness values associated to the two alternatives involved in that preference degree CPiand CPj,
) 1 ( 2
#
n EV
where #EV is the number of preference values known. And
its associated error
pij, 3 2 1 3
2 ij ij ij
ij
p p p
p (10)
where
;
1,2,3, 0 # , 0 #
1
lotherwise H if H p cp
p ijl
l ij l ij H j ij kl ij ij (11) and
; , ,
1,2,3. 0 # 0 # 0 # 0 # 0 # 0 # , 1 , 2 ,
3 1 2 3
abc
otherwise H H H if H H H if c ij b ij a ij ij ij ij (12)
withαij= f
#EVi#EVj#
EViEVj
, beingfa decreasing function with f
0 1 and f
4(n1)2
0,
2 ) 1 ( 4 # # # 1 n EV EV EVEVi j i j
ij
.
(13)Detailed information about incomplete fuzzy preference relations and their mathematical formulation are given in [10].
Step 2.4: “Aggregation of the evaluations”. This process will reflect the opinions of the majority of the DMs. On this line, let
pij1,...,pijl be the set of values to be aggregated for any,
i j R where the number DMs is denoted asl=1,...,Lk. Then the ordered weighted geometric (OWG) operator which is defined as:
l k k w L l l ij L ij ij ij G p p p p
1 2 1 ,...,, . (14)
where, (1,..., )
k L
w w
W is an exponential weighting vector, such that wl
0,1 and
w
l
1
, and eachl ij
p is the lth largest
valued element in the set
kLk
ij k ij k
ij p p
p 1, 2,..., [4], [45]. The OWG operator reflects the fuzzy majority if we calculate its weighting vectorWby means of a fuzzy linguistic quantifier [46]. In this study, we make use of the fuzzy majority which is a soft majority concept expressed by a fuzzy linguistic quantifier. Proportional quantifiers, such as most, at least half, may be represented by fuzzy subsets of the unit interval, [0,1]. Then, for any r[0,1], Q(r) indicates the degree to which the proportionris compatible with the meaning of the quantifier it represents. For a non decreasing relative quantifier, Q, the weights are obtained as
k
k
l Ql L Ql Lw / 1/ ,l= 1,…,LkwhereQ(y) is defined as: 0, ify< a; (y-a)/(b-a), ifayb; and 1, ifyb. Note that
a,b,y [0,1] and Q(y) indicates the degree to which the proportionyis compatible with the meaning of the quantifier it represents. Some examples for the relative quantifiers are “most” (0.3, 0.8), “at least half” (0, 0.5) and “as many as possible” (0.5, 1). When the fuzzy quantifier Q is used for calculating the weights of the OWG operator G
W , it is represented by G
Q
. Therefore, the collective multiplicative relative importance relation is obtained as follows;
kLk
ij k ij k ij G Q k
ij p p p
p 1, 2,..., , 1ijn. (15)
Step 2.5: “Obtaining priorities from the judgment matrix”. After the group opinion collected in the matrixP, it must be exploited to determine the importance weights of the criteria. Note that in P, the ij element reflects the relative importance of criterion i compared to criterion j. Next, calculate the quantifier guided importance degree of each criterion, which quantifies the importance of one criterion compared to others in a fuzzy majority sense. By using the OWG operator, we have
p j n
QGID i 1 log GQ ij : 1,..., 2
1
9
. (16)
for alli= 1,...,n. Finally, the obtained QGIDivalues should be normalized, i.e., QGIDi QGIDi /iQGIDi , to have the importance degrees in percentage. These steps need to be pursued in all nodes of the evaluation model.
Step 3: “Hows”: This step can also be called as
developing/defining DRs. The first step of the DR part is transforming CRs to technical attributes. DRs are specified on the basis of the company’s operational or managerial resource allocation plans in order to satisfy the customers. In defining the DRs, the most important point is, finding direct solutions to defined CRs.
Step 4: “Relation Matrix”: Here relationship matrix is constructed between CRs and DRs. Each of the DRs is correlated individually to each of the CRs by considering to what extent a requirement contributes to meeting customer needs for the attribute. Depending upon the impact of the DRs on meeting CRs for the attribute, “Empty=no relationship”, “1=possible relationship”, “3=moderate relationship”, and “9=strong relationship” is assigned.
Step 5: “Prioritizing DRs”:The importance of each DR is computed using the relationship matrix and the relative importance of each CR. The accuracy of the results in this step relies heavily on the quality of the relationship matrix. This computation process intertwines CRs with DRs. That is, the resulting value determines the relative weight of each DRs as compared to CRs. The importance of each DR is calculated as the sum of each CR importance value multiplied by the quantified relationship between the same CR and the current DR.
IV. APPLICATION OF THESSC MODEL
Here, the SSC model determined in Sec. II is illustrated with the proposed approach. In our example there are three DMs, namely project manager, R&D engineer and top manager.
Step 1: “Whats”: The SSC model determined in Sec. II comprises the whats-CRs.
Step 2: “Priority Analysis”:
Step 2.1:Table II gives the evaluation of the DMs for the purpose of measuring the importance degrees among primary level factors namely economic (CR1), environmental (CR2) and social (CR3) requirements.
Table II. Incomplete linguistic evaluation of DMs
DM1 DM2 DM3
CR1 CR2 CR3 CR1 CR2 CR3 CR1 CR2 CR3
CR1 - M M - x x - x x
CR3 x x - x x - VH H
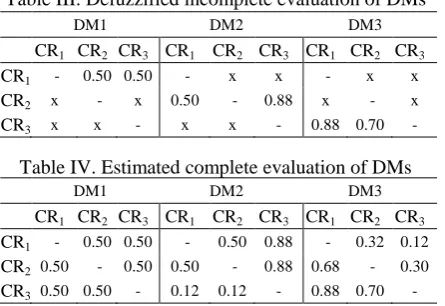
[image:5.595.59.282.144.297.2]-Step 2.2:To complete the missing values, firstly by using Eq. (1), Table III which shows the defuzzified incomplete preferences of the group is obtained. Eqs. (2-4) are used to estimate the missing values shown in Table IV.
Table III. Defuzzified incomplete evaluation of DMs
DM1 DM2 DM3
CR1 CR2 CR3 CR1 CR2 CR3 CR1 CR2 CR3
CR1 - 0.50 0.50 - x x - x x
CR2 x - x 0.50 - 0.88 x - x
CR3 x x - x x - 0.88 0.70
-Table IV. Estimated complete evaluation of DMs
DM1 DM2 DM3
CR1 CR2 CR3 CR1 CR2 CR3 CR1 CR2 CR3
CR1 - 0.50 0.50 - 0.50 0.88 - 0.32 0.12
CR2 0.50 - 0.50 0.50 - 0.88 0.68 - 0.30
CR3 0.50 0.50 - 0.12 0.12 - 0.88 0.70
-As an example, to estimate p23in the evaluation of DM1, the procedure is as follows:
1 23
H = {1} as cp1123=p21p130.5= unknown
2 23
H = Ø as cp1223=p13p120.5= 0.50
3 23
H = Ø as cp1323=p21p310.5= unknown thereby, cp 23 = 0.50.
[image:5.595.59.279.466.534.2]Step 2.3: After missing values are completed, finally consistency is checked. The corresponding consistency level matrix is shown in Table V.
Table V. Consistency levels of DMs’ evaluations
DM1 DM2 DM3
CR1 CR2 CR3 CR1 CR2 CR3 CR1 CR2 CR3
CR1 - 0.58 0.58 - 0.58 0.50 - 0.50 0.58
CR2 0.58 - 0.50 0.58 - 0.58 0.50 - 0.58
CR3 0.58 0.50 - 0.50 0.58 - 0.58 0.58
-Continuing on the same example, the consistency level is calculated using Eqs. (8-13) as follows:
EV1= {(1,2),(1,3)}; EV2= {(1,2)}; EV3= {(1,3)}.
CP1= 2/4, CP2= 1/4, CP3= 1/4.
2 1 1 /4 3 1 2
0.67 123
.
As there is no intermediate alternative to calculate an estimated value except a1, consequently p23 0 and,
0.502 4 / 1 4 / 1 67 , 0 0 1 67 , 0 1
23
CL .
[image:5.595.87.247.748.783.2]Step 2.4: Taking into account all matrices obtained from project managers group, using of Eqs. (14-15), the OWG operator with fuzzy linguistic quantifier ‘at least half’ is used to compute the group importance relation matrix as shown in Table VI with weighting vector (0.666, 0.334, 0.000).
Table VI. Importance relation matrix of DMs
CR1 CR2 CR3
CR1 0.50 0.50 0.73
CR2 0.61 0.50 0.61
CR3 0.60 0.56 0.50
Step 2.5: Eq. (16) is used to compute group aggregated importance values with weighting vector (0.066, 0.667, 0.267) corresponding to the fuzzy linguistic quantifier ‘most’. The collaborative importance values are calculated as (0.3994, 0.3766, 0.3621). Then by normalizing these values, priority of the primary level requirements is determined as (0.35, 0.33, 0.32). Same computational procedure is carried out for all secondary level comparisons to obtain the priorities. Finally, global importance values are calculated by multiplying primary level priorities with related secondary level priorities.
Step 3: “Hows”: The SSC model determined in Sec. II again comprises the hows-DRs.
Step 4: “Relation Matrix”:Relation degrees between CRs and DRs can be seen from the final HOQ matrix in Fig. 3. For instance, first economical factor “cost reduction” is in direct relationship with almost all the DRs because firms essentially aim to provide reduction in costs.
Relationship Strength: S: Strong M: Moderate
P: Possible D
R1
D
R2
D
R3
D
R4
D
R5
D
R6
D
R7
D
R8
D
R9
D
R10
D
R11
D
R12
Im
p
o
rt
an
ce
CR1
CR2
CR11 S M M M S M M S P P 0.098
CR12 S P M M M 0.084
CR13 S S M M M M M M M M P 0.088
CR21 S S M M S M M S M 0.081
CR3
CR22 P S S M S 0.026
CR23 S S S 0.086
CR24 S M M S M S 0.102
CR31 S M S M S M S S 0.116
CR1
CR32 P M M P M 0.054
CR33 P P S M P M S 0.096
CR34 M M P M P S S 0.109
CR11 M S S M S 0.061
Importance of DRs 0.9
0
7
5
.9
6
3
2
.6
2
0
3
.0
9
8
1
.4
6
6
6
.1
9
3
1
.6
8
9
1
.8
6
9
2
.9
0
6
1
.5
4
6
5
.0
7
1
1
.8
5
5
Importance % 0.0
2
6
0
.1
6
9
0
.0
7
4
0
.0
8
8
0
.0
4
2
0
.1
7
6
0
.0
4
8
0
.0
5
3
0
.0
8
3
0
.0
4
4
0
.1
4
4
0
.0
5
3
Ranking 12 2 6 4 11 1 9 7 5 10 3 8
Figure 3. The final HOQ
Step 5: “Prioritizing DRs”: Priorities of the DRs can be seen from the final HOQ matrix in Fig. 3. For example, importance weight of DR1 is calculated such that (9*<0.0805) + (3*0.0608) = 0.907. After it is normalized, its priority is equal to 0.0258 and its rank 12.
V. CONCLUSION
In this study, requirements of a SSCM structure are investigated by the aid of HOQ which underlies the QFD technique. The most important issue to be considered is that firms avoid of SSC activities due to the cost of investments. Firms should be aware of the great advantages of these investments in terms of sustainability.
REFERENCES
[1] L. Y. Y. Lu, C. H. Wu, and T.-C. Kuo. (2007). Environmental principles applicable to green supplier evaluation by using multiobjective decision analysis. International Journal of Production Research. 45. pp. 4317–4331.
[2] J. D. Linton, R. Klassen, and V. Jayaraman. (2007). Sustainable supply chains: An introduction. Journal of Operations Management.25. pp. 1075–1082.
[3] F. Chiclana, F. Herrera, and E. Herrera–Viedma. (1998). Integrating three representation models in fuzzy multipurpose decision making based on fuzzy preference relations.Fuzzy Sets and Systems.97. pp. 33–48. [4] F. Herrera, E. Herrera–Viedma, and F. Chiclana. (2001). Multiperson
decision-making based on multiplicative preference relations.European Journal of Operational Research.129. pp. 372–385.
[5] G. Büyüközkan, and O. Feyzioğlu, (2005). Group decision making to better respond custumer needs in software development,Computers & Industrial Engineering.48. pp. 427–441.
[6] Z. Zhang, and X. Chu. (2009). A new integrated decision-making approach for design alternative selection for supporting complex product development. International Journal of Computer Integrated Manufacturing.22. pp. 179–198.
[7] L. A. Zadeh. (1965). Fuzzy set.Information and Control.8. pp. 338–353. [8] S. Alonso, F. Chiclana, F. Herrera, E. Herrera–Viedma, J. Alcala, and C. Porcel. (2008). A consistency based procedure to estimate missing pairwise preference values.Int J Intell Syst.23. pp. 155–175.
[9] Z. Xu. (2006). A Practical Procedure for Group Decision Making under Incomplete Multiplicative Linguistic Preference Relations. Group Decision and Negotiation.15. pp. 581–591.
[10] E. Herrera-Viedma, F. Chiclana, F. Herrera, and S. Alonso. (2007). Group Decision-Making Model with Incomplete Fuzzy Preference Relations Based on Additive Consistency.IEEE Transactions on Systems, Man, and Cybernetics—Part B: Cybernetics.37(1). pp. 176–189.
[11] Z. Xu. (2006). Incomplete linguistic preference relations and their fusion. Information Fusion.7. pp. 331–337.
[12] Z. Xu. (2006). Integrating Multiple Types of Incomplete Linguistic Preference Relations in Multi-person Decision Making.Fuzzy Systems and Knowledge Discovery. pp. 300–309.
[13] E. Herrera-Viedma, S. Alonso, F. Chiclana, and F. Herrera. (2007). A Consensus Model for Group Decision Making With Incomplete Fuzzy Preference Relations.IEEE Transactions on Fuzzy Systems.15. [14] T.-C. Wang, and Y.-H. Chen. (2010). Incomplete fuzzy linguistic
preference relations under uncertain environments.Information Fusion. 11. pp. 201–207.
[15] C. J. Corbett, and P.R. Kleindorfer. (2003). Environmental management and operations management: introduction to the third special issue. Production and Operations Management.12(3). pp. 287–289.
[16] P. R. Kleindorfer, K. Singhal, and L. N. van Wassenhove. (2005). Sustainable operations management. Production and Operations Management.14(4). pp. 482–492.
[17] C. J. Corbett, and R. D. Klassen, (2006). Extending the Horizons: Environmental Excellence as Key to Improving Operations. Manufacturing and Service Operations Management.8. pp. 5–22. [18] M. Pagell, and Z. Wu. (2009). Building a more complete theory of
sustainable supply chain management using case studies of 10 exemplars. Journal of Supply Chain Management. 45. pp. 37–56.
[19] G. Büyüközkan, and E. Erkut, Kalite Fonksiyonu Göçerimi Temelli Sürdürülebilir Tedarik Zinciri Yönetimi Tasarımı (Quality Function Deployment Based Sustainable Supply Chain Management). [Proceedings of 28th Operation Research and Industrial Engineering National Congress-YA/EM, 2008, Galatasaray University, Istanbul].
[20] S. Seuring, and M. Müller. (2008). From a literature review to a conceptual framework for sustainable supply chain management.Journal of Cleaner Production.16. pp. 1699–1710.
[21] T. N. Gladwin, J. J. Kennelly, and T. Krause. (1995). Shifting paradigms for sustainable development: implications for management theory and research.Academy of Management Review.20. pp. 874–907.
[22] M. Starik, and G. P. Rands. (1995). Weaving an integrated web: multilevel and multisystem perspectives of ecologically sustainable organizations.
Academy of Management Review. 20. pp. 908–935.
[23] P. D. Jennings, and P. A. Zandbergen. (2005). Ecologically sustainable organizations: an institutional approach.Academy of Management Review. 20. pp. 1015–1052.
[24] R. Handfield, S. V. Walton, L. K. Seegers, and S. A. Melnyk. (1997). Green value chain practices in the furniture industry. Journal of Operations Management.15. pp. 293–315.
[25] C. R. Carter, and M. Dresner. (2001). Purchasing’s role in environmental management: cross-functional development of grounded theory.Supply Chain Management.37. pp. 12–26.
[26] H. Walker, L. D. Sisto, and D. McBain. (2008). Drivers and barriers to environmental supply chain management practices: Lessons from the public and private sectors.Journal of Purchasing & Supply Management. 14. pp. 69–85.
[27] G. Theyel. (2000). Management practices for environmental innovation and performance. International Journal of Operations & Production Management.20. pp. 249–266.
[28] D. E. Santos-Reyes, and T. Lawlor-Wright. (2001). A design for the environment methodology to support an environmental management system.Integrated Manufacturing Systems.12(5). pp. 323–332. [29] D. F. Simpson, and D. J. Power. (2005). Use the supply relationship to
develop lean and green suppliers. Supply Chain Management: An International Journal.10. pp. 60–68.
[30] Y. H. Lin, H.-P. Cheng, M.-L. Tseng, and J. C. C. Tsai. (2010). Using QFD and ANP to analyze the environmental production requirements in linguistic preferences. Expert Systems with Applications. 37. pp. 2186–2196.
[31] F. K. Pil, and S. Rothenberg. (2003). Environmental performance as a driver of superior quality. Production & Operations Management.12(3). pp. 404–415.
[32] P. Rao, and D. Holt. (2005). Do green supply chains lead to competitiveness and economic performance?. International Journal of Operations & Production Management.25. pp. 898–916.
[33] S. Rothenberg. (2003). Knowledge content and worker participation in environmental management at NUMMI.Journal of Management Studies. 40(7). pp. 1783-1802.
[34] D. Nawrocka, T. Brorson, and T. Lindhqvist. (2009). ISO 14001 in environmental supply chain practices.Journal of Cleaner Production.17. pp. 1435–1443.
[35] J. L. Bossert,Quality Function Deployment: A Practitioner’s Approach, Milwaukee, WI: ASQC Quality Press, 1991.
[36] Y. Akao, Development History of Quality Function Deployment, The Customer Driven Approach to Quality Planning and Deployment. Minato-ku, Tokyo 107 Japan: Asian Productivity Organization, 1994. [37] E. S. S. A. Ho, Y.-J. Lai, and S. I. Chang. (1999). An integrated group
decision-making approach to quality function deployment. IIE Transactions.31. pp. 553–567.
[38] F. Herrera, E. Herrera-Viedma, and J .L. Verdegay. (1996). A model of consensus in group decision making under linguistic assessments.Fuzzy Sets and Systems.78. pp. 73–87.
[39] F. Herrera, E. Herrera-Viedma and J. L. Verdegay. (1997). A rational consensus model in group decision making using linguistic assessments. Fuzzy Sets and Systems.88.pp. 31–49.
[40] F. Herrera, and E. Herrera-Viedma. (2000). Linguistic decision analysis: steps for solving decision problems under linguistic information.Fuzzy Sets and Systems.115. 67–82.
[41] Z. S. Xu. (2004). A method based on linguistic aggregation operators for group decision making with linguistic preference relations. Information Sciences.166. pp. 19–30.
[42] S. Alonso, E. Herrera-Viedma, F. Herrera F. J. Cabrerizo, and F. Chiclana. A Decision Aid System to Provide Consistent Linguistic Preference Relations. [Proceedings of the 6thInternational Conference on Recent Advances in Soft Computing, 2006, pp. 130–135].
[43] F. Chiclana, E. Herrera-Viedma, and S. Alonso. (2009). A Note on Two Methods for Estimating Missing Pairwise Preference Values. IEEE Transactions On Systems, Man, And Cybernetics—Part B: Cybernetics. 39(6).
[44] T. Tanino. (1984). Fuzzy preference orderings in group decision making. Fuzzy Sets Syst.12(12). pp. 117–131
[45] Q. Zhang, J. C. H. Chena, and P. P. Chong. (2004). Decision consolidation: Criteria weight determination using multiple preference formats. Decision Support Systems. 38. 247–258.