. . . .
. . . .
. . . .
Passive cooling technology for photovoltaic
panels for domestic houses
Shenyi Wu
*and Chenguang Xiong
Department of Architecture and Built Environment, University of Nottingham, University
Park, Nottingham NG7 2RD, UK
*Corresponding author. shenyi.wu@nottingham.ac. uk
Abstract
The efficiency of photovoltaic panels decreases as the panels’ temperature increases, which results in deduction of electricity generation. In order to reduce this effect, different cooling methods were proposed and investigated. This paper reviews the previous work on cooling PV cells and concludes that the cost-effectiveness, design feasibility and minimal energy consumption are the important design consideration for cooling systems. Based on these considerations, this paper reports a passive cooling method that utilizes rainwater as cooling media and a gas expansion device to distribute the rainwater. The gas is thermally expanded from receiving solar radiation as such the amount of water it pushes to flow over the PV cells is proportional with the solar radiation it received. The paper reports a design and simulation of such a system for a domestic house application. In the paper, a relationship of the gas chamber size, solar radiation and gas expansion volume was established for evaluation with respect to the variation of gas temperature and the amount of rainwater used for cooling. A heat transfer model was used to evaluate the performance of the cells by cooling with this passive device. The results show that on a design day, the passive cooling system reduces the temperature of the cells and increases electrical efficiency of the PV panel by 8.3%. The payback period of this system is,14 years.
Keywords:PV cooling; passive cooling; solar pump; rainwater harvesting; heat transfer Received 13 November 2013; revised 13 January 2014; accepted 10 February 2014
1
INTRODUCTION
The operating temperature is one of the important factors that can affect the efficiency of the PV panels. The effects of tempera-ture on photovoltaic efficiency can attribute to the influences on the current and voltage of the PV panels. This can be easily found on the I-V curve of the panels. It results in a linear reduc-tion in the efficiency of power generareduc-tion as temperature increases [1]. The efficiency of some types of PV cells is very much dependent on their operating temperature. For crystalline silicon solar cells, the reduction in conversion efficiency is
0.4 – 0.5% for every degree of temperature rise [2]. Therefore, reducing the operating temperature of photovoltaic cells is important for the PV panel to work efficiently and protect cells from irreversible damage.
A number of researchers have worked on cooling the PV panels with different approaches. Air circulation is probably the most simple and natural way for this purpose. In order to enhance convection heat transfer, fins were used to extend the heat transfer area. Edenburn [3] developed a device, made up of linear fins on all available heat sink surfaces, used for cooling
single cells passively. Araki et al. [4] did a further research on passive cooling technologies and found that good thermal con-duction between cells and heat spreading plate was important. Combining PV and solar thermal collectors (PV/T) is another way of cooling PV panels. Tonui and Tripanagnostopoulos [5] reported their experiment on modified PV/T collectors, and results showed the maximum temperature reduction achieves 108C by natural ventilation and 308C by forced ventilation.
As a good cooling media, water has been widely used for PV cooling in various forms. It is very suitable for PV/T systems. Kalogirou [6] studied a water-based PV/T system consisting of four monocrystalline PV panels in the Cyprus and achieved an increase of average annual electrical efficiency from 2.8 to 7.7% with the payback periods of 4.6 years. Tripanagnostopouloset al. [7] compared electrical efficiency of PV/WATER, PV/AIR and PV/FREE and PV/INSUL under ambient air temperature of 298C. They achieved the maximum increase by 3.2% with PV/ WATER.
Krauter [8] investigated the method of covering PV modules with a flowing water film above. With the additional evaporation heat transfer, it was claimed that they could decrease the cell
International Journal of Low-Carbon Technologies 2014, 9, 118– 126 #The Author 2014. Published by Oxford University Press.
temperature up to 228C and obtained a net increase from 8 to 9%. Abdolzadeh and Ameri [9] used water spray to cool the PV panels and achieved increasing the efficiency of cells by 3.26 to 12.5%. Kordzadeh [10] studied that a thin continuous film of water running on the front of the surface of modules obtained better electrical efficiency because of reducing reflection loss and surface temperature.
To avoid additional energy consumption incurred for cooling the PV panels, Furushima and Nawata [11] reported a model with cooling water being supplied from a city water supply system by Siphonage and the cooling system did not require any additional energy input on the site. Wilson [12] studied the gravity-fed technology where water was transported from up-stream sources like river to downup-stream sources by gravity. The results obtained from this work showed a 12.8% increase in elec-trical efficiency as a result of 328C temperature reduction.
Other technologies were also used to enhance the heat trans-fer for cooling the panels. Akbarzadeh and Wadowski [13] reported an innovative gravity-assisted heat pipe system to opti-mize the cooling of concentrated photovoltaics. It was found that the temperature at the surface of solar cells did not exceed 468C during a 4-h test, and the efficiency was increased by 50%. Huanget al. [14] initially integrated PCM into BIPV system and used fins for improvement. Biwoleet al. [15] established a nu-merical model and used CFD to simulate heat and mass transfer of PCM at the back of photovoltaic panels. Their results showed that adding PCM at the back of panels can maintain the operat-ing temperature below 408C.
Active cooling is effective to cool PV panels. However, with the additional power consumption involved, the active cooling purely used to lower the operating temperature does not have obvious benefit in the net gain of efficiency. The technologies such as PV/T ( photovoltaic thermal) system or the PV-SAHP ( photovoltaic solar heat pump) system [16,17] seem to address the issue stated earlier by combination of two systems. But the fact that PV/T has to at a higher operating temperature in order to supply useful heat means the gain by cooling is limited. What is more, the higher initial investment and the final benefit with PV/T technology is contributed to thermal energy rather than electricity [7]. This renders the PV/T being not an effective tech-nology for the original purpose. Therefore, finding a simple and feasible way to cool the PV panel without requiring further energy input is still much sought after.
2
DESCRIPTION OF THE SYSTEM
Figure1illustrates an example of the proposed solar-driven rain-water cooling system. The system consists of a PV module with an area of 1.46 m2, maximum efficiency of 15.4% and maximum power output of 250 W, a gas expansion chamber, a rainwater storage tank and a secondary water tank. A cylindrical gas ex-pansion chamber is installed at the eaves whereas the secondary water tank, which is connected to the gas expansion chamber, is hung at the side of the house. Gutters are installed on both
south- and north-facing roofs in order to maximize the rain-water harvesting. On receiving the solar radiation, the gas in the chamber expands with the temperature increase. The rainwater in the tank is pushed upwards by the expanding gas so that it flows over the PV panel through a distribution tube on the top as shown in Figure 2. The rainwater is not considered being reused to reduce the cost and simplify the system structure in this case.
3
ANALYSIS OF THE SYSTEM
The amount of the rainwater delivered to the PV panels is deter-mined by the gas expansion volume. The expansion volume is a function of temperature that varies with the solar energy the gas received. Therefore, there is a relationship between the amount of rainwater delivered and solar incidence. The relationship can be derived from the energy conservation law.
3.1
Energy balance equation in the gas expansion
chamber
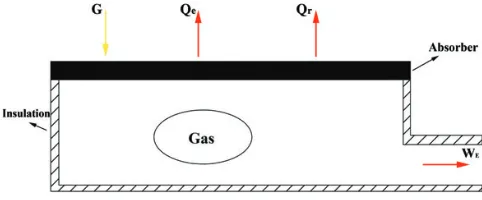
The gas expansion chamber is covered by an insulation layer used to reduce heat loss from the side surfaces and is covered with an absorption layer to enhance the capture of solar radiation. Taking the chamber as a control volume, the energy conversion and heat flows of the chamber are as shown in Figure 3. The energy balance can be expressed as Qnet¼GQcQrWE;
where WE is gas expansion work (J). The Qnet is the heat that causes the gas temperature rise.
[image:2.612.318.567.62.267.2]To simplify the simulation, some assumptions are made and stated as follows:
† No heat transfer across the side boundaries. The conduction heat transfer between the absorption layer and the surround-ing air is neglected.
† Thermal resistances in the absorption layer and gas are not considered so that the absorption layer and gas have the same temperature and the gas temperature in the chamber is uniform.
† The gas is treated as ideal gas.
† The atmospheric pressure is constant within duration of time.
† The gas properties are constant.
Under the assumptions, the energy balance of the gas expansion chamber can be expressed in the following equation:
Aaba
ð
IdtAabhc
ð
ðTgasTaÞdt
Aab1s
ð
ðTgas4 Ta4ÞdtPatmdV
¼mgasCgas DTgas ð1Þ
where I is solar radiation on horizontal surface (W/m2); Tgas represents gas temperature (8C);Aabrepresents area of absorber surface (m2);Cgasdenotes specific heat capacity of gas (J/kg K); hcdenotes convection heat transfer coefficient of wind (W/m2
K);ais absorption coefficient of PV panel (0.95);1is emissivity factor of absorber (0.04); s is Stefan – Boltzmann constant (W/m2K4);trepresents time (s).
This equation describes the accumulating effect of the solar radiation on the gas expansion chamber from a reference point and its derivative form:
AabaIAabhcðTgasTaÞ Aab1sðTgas4 Ta4Þ Patm
dV dt
mgasCgas
dT dt ¼0
ð2Þ
It describes the effect of the solar radiation on the gas chamber at any time point. Since the chamber’s temperature change is a slow process, we use the finite-difference equation to approxi-mate Equation (2) as follows:
AabaIAabhcðTgasTaÞ Aab1sðTgas4 T 4 aÞ
PatmðAwHðtÞAwHðt1ÞÞ
Dt
¼mgasCgasðTgas;ðtÞTgas;ðt1ÞÞ
Dt ð3Þ
where the subscribes (t) and (t 2 1) denote the time step in hour andAWis the base area of the secondary tank (m2) andH is the height of water pumped (Figure4).
For 1-h time interval, we have the following equation:
AabaIAabhcðTgasTaÞ Aab1sðTgas4 Ta4Þ
PatmðAwHðtÞAwHðt1ÞÞ 3600
¼mgasCgasðTgas;ðtÞTgas;ðt1ÞÞ
[image:3.612.96.517.59.236.2]3600 ð4Þ
[image:3.612.50.291.279.379.2]Figure 2. Schematic diagram of cross section of the solar-driven rainwater cooling system.
3.2
Hydraulic head of water in the secondary water
tank
With reference to Figure4, the expression of hydraulic head in the secondary water tank varying with the gas expansion can be derived as follows.
At initial state, the secondary water tank is filled with water and the gas in the chamber does not expand. The state of the gas can be expressed as follows:
PatmVgas¼mgasRT0 ð5Þ
whereT0denotes initial temperature of the chamber (8C);Patm indicates atmosphere pressure (Pa).
On receiving heat from the solar radiation, the gas in the chamber starts to expand. If the gas volume is expanded bydV (volume expansion) (m3), the same volume of water will be pushed out of the tank. The change of the state follows the fol-lowing equation:
½Patmþrgð0:9þHÞðVgasþdVÞ ¼mgasRTgas ð6Þ
wheremgasrepresents mass of gas (kg);Vgasdenotes volume of gas (m3) anddV¼HAW;whereAW¼0:25:From Equations
(5) and (6), a relationship between the volume of the water pushed and gas temperature can be obtained:
rgAwH2þ ðPatmAwþrgVgasþ0:9rgAwÞHþPatmVgas
þ0:9rgVgas
PatmVgasTgas
T0
¼0 ð
7Þ
3.3
Heat transfer on the PV panel
When the water flows over a tilted PV panel, the heat transfer between the water and panels can be complicated by involving water evaporation in addition to the normal radiation and con-vection heat transfer. With reference to Figure 5, the energy balance leads to:
G¼QeþQcþQrþDU
where G denotes energy generated from solar radiation (J), Uindicates internal energy (J), andQe,Qc, andQrdenote heat loss by evaporation (J), heat loss by convection (J) and heat loss by radiation (J), respectively.
The heat transfer mechanism is quite complex due to temperature variation along the water– solid interface. A two-dimensional steady-state model is used, and some assumptions should be made to simplify the calculation.
† Solar radiation irradiates on the PV panel, 15.4% is converted to electricity energy, 5% is reflected and the rest part is con-verted to heat energy.
† Assume the water mass is uniformly distributed over the PV panel and water is ultimately heated to a temperature that is same as the cell temperatureTc.
† Water temperature increase caused by solar radiation is neglected. [18]
† Convective heat loss at the back of PV panel and radiation heat transfer is not considered.
Air flowing at the air– water interface essentially accelerates water evaporation rate. Thus, the air convection could be mea-sured accompanying with water evaporation. Smith et al. [19] predicted evaporation heat transfer flux by the following equa-tion, which approximately estimates how much latent heat is removed from the PV panel by water evaporation (w/m2).
qe¼ ð0:0638þ0:0669VÞðPwPaÞ ð8Þ
where saturation pressure of water is as follows:
logðPs/1000Þ ¼30:590518:2 logðTaþ273:16Þ þ0:00248ðTa
[image:4.612.48.300.59.209.2]þ273Þ 3142:31 ðTaþ273Þ Figure 4. Schematic diagram of cross section of the gas chamber and secondary
[image:4.612.316.565.59.258.2]water tank.
partial pressure of water vapour at surrounding air is as follows:
Pa¼wPs
partial pressure of water vapour at water is as follows:
Pw¼exp 20:386
5132 0:5ðTw;inþTcÞ
133
whereTw,indenotes water inlet temperature (8C).
Therefore, total heat transfer via water evaporation can be expressed as follows:
Qe¼Acellqe ð9Þ
whereAcelldenotes area of cells (m2).
The internal energy change of water can be expressed as follows:
DU¼mwaterCpðTw;outTw;inÞ
3600 ¼
mwaterCpðTcTw;inÞ
3600 ð10Þ
whereTw,outdenotes water outlet temperature (8C).
Thus, after a water film flowing down to a PV panel, the cell temperature can be approximately calculated as follows:
aIAcellð1hÞ ¼Acellð0:0638þ0:0669UwÞðPwPaÞ
þmwaterCaðTcTw;inÞ
3600 ð11Þ
whereUwdenotes wind speed (m/s).
4
SIMULATION RESULTS
This system was analysed with the climate data on a clear day of 29th July in Nottingham [20]. The day was chosen for its low wind speed and high air temperature. The study was focused on the thermal performance of the gas chamber and the cooling effect to the PV panels. The analysis was on one PV module system.
4.1
Influence of design parameters on the system
performance
The size of the gas chamber is a predominant parameter that influences how much water can be pushed out of a tank. To evaluate the influences of chamber surface area and chamber volume on performance, two groups of the gas chambers were analysed. In the first group, the chambers have the same surface area of 2.5 m2 but with different volumes of 1.5, 1.25, 1 and 0.75 m3, respectively. The second group has a fixed volume of 1.25 m3 but with the different surface areas of 3, 2.5, 2 and 1.5 m2, respectively. In this system, water is pushed up through a 0.9-m-high vertical pipe (Figure4).
The results show that, for the same chamber volume, the gas temperature in the chamber slightly increases with the surface
area. But the increase is within 18C. This could be a result of the heat gain from the larger surface area being offset by the heat losses from the same larger surface area. Figure6presents accu-mulated water volume pushed due to gas expansion. It can be seen that the amount of water pumped increases with the gas chamber volume. It increases from 123 l/day with a 0.75-m3 chamber to 200 l/day with a 1.5-m3 gas chamber. The amount pumped increasing with the chamber volume is due to the as-sumption of uniform air temperature in the chamber. The volume expands more with the air mass increases in the chamber. However, this phenomenon should become less sig-nificant when the air temperature profile in the chamber is treated as non-uniform. Without any control, the gas chamber can pump the maximum amount of water to the PV panel at 7 am, and the amount gradually decreases to zero around 1 pm. It was estimated approximately that 165 l/day of rainwater is avail-able for the climate under the consideration. To pump this amount of water, a 1-m3gas chamber is needed.
4.2
Performance of the PV module cooled by the
system
The performance is evaluated from the rainwater pumped by the device with a 0.16-m3secondary water tank connecting to the a 1-m3 gas chamber. The secondary water tank is designed to protect gas infiltration and increase air tightness so that the whole system can work with the higher efficiency. The variation of the gas temperature in the chamber during a day was illustrated in Figure 7. The initial gas temperature is 293 K, which is quickly heated to 342 K at 7 am, because low heat capacity of gas, small mass of gas in the chamber and intensive solar radi-ation on the design day cause that gas can be heated to a high temperature. With the increase of solar radiation, the gas tem-perature gradually increases to a maximum value 387 K at 1 pm. After that, gas temperature reduces due to the reduction of solar radiation and the rise of heat loss from a gas chamber to the outside environment.
[image:5.612.311.562.61.157.2]Under this condition, the device is able to push 152 l of water to the PV panel (Figure8). As discussed earlier, without control, the majority amount of the water is pumped at the early time of the day when the demanding for cooling is low. A control to the flow may be needed, for example, by a temperature sensitive valve to delay the water pumping to address this issue. The
operating temperature of PV is primarily determined by the solar radiation. On the day of 29th July, between 10 am and 14 pm, solar radiation was .850 W/m2 and its temperature reached 508C. The detail of the climate data for the day is shown in Table1. In order to maximize the cooling benefit to the PV panel, a temperature sensitive valve can be used to adjust the flow rate of water according to the roof temperature. Table 2
shows that a total of 152 l of water can be pushed at different hourly rates with respect to the roof temperature from 10 am to 2 pm on the day. It can be seen that with the temperature sensi-tive valve, more water is pumped when the roof temperature is higher at late hours, which allows more cooling to the PV penal when it receives high solar radiation.
During the working time, the cooling to the PV panel is very effective when the PV panel temperature is high as shown in Figure9. It can be seen that at 1 pm, a maximum temperature re-duction of 198C is achieved and at other time temperature reduction ranges from 12.5 to 18.58C. Figures10and11present the efficiency and the power output of the PV panel with and
without cooling, respectively. The cooling maintains the efficiency of the cells above 14.5% each hour in a design day, particularly, between 12 pm and 2 pm during which the PV panel has very low efficiency without cooling. The cooling also increases the power output by 16 W on average. In summary, solar-driven cooling system is able to reduce the operating temperature of the cells by 16.58C on average, and it has a better cooling effect when the tem-perature of the cells becomes higher. In addition, daily electrical yields of the PV module will grow 80 Wh, achieving an increment of 8.3%. However, variable environmental conditioning has
[image:6.612.44.297.60.257.2]Figure 8. Accumulated rainwater volume in each hour.
[image:6.612.313.570.75.241.2]Figure 7. Gas temperature variation in a design day.
Table 1.Climate data of the day of calculation.
Time Temperature (8C)
Wind speed (km/h)
Humidity (%)
Beam solar radiation (w/m2)
Diffuse solar radiation (w/m2)
7 16.3 6 80 517 122
8 18.2 4.6 72 528 207
9 20.3 4.3 67 634 193
10 22.3 4.3 62 744 166
11 24 4.3 59 712 232
12 25.2 6.5 56 682 249
13 26.2 6.5 54 798 149
14 27 5.4 52 768 153
15 27 4.3 51 558 216
16 26.7 7 53 646 128
17 25.6 10.3 57 381 134
18 24.2 6.5 61 463 59
[image:6.612.313.566.295.560.2]Weather data on 29th July.
Table 2.Hourly rainwater supply with temperature sensitive control for cooling.
Time Water volume (l)
10 28.37
11 30.13
12 30.62
13 31.57
14 31.31
[image:6.612.42.296.300.450.2]impacts on gas chamber expansion, so does on water pumping and the cooling effect. Therefore, it is meaningful to evaluate annual performance of the solar-driven water cooling system under a stable environmental condition.
4.3
Monthly water consumption by the system
The supply of the rainwater depends on the gas expansion in a chamber, which varies with solar radiation and ambient air tem-perature. As shown in Figure12, in January and December, little water can be pumped by this device; however, in June, intensive solar radiations and high air temperatures make the device to pump 110.8 l of water to PV panel for cooling in each day. According to solar radiation and rainwater supply, the system was designed to work between April and September.
For a well-constructed roof, the runoff coefficient is usually assumed as 0.8 [21]. Therefore, monthly rainwater collection can be estimated from the following equation:
Rainwater volume¼monthly rainfallcatchment area
runoff coefficient
It is not efficient and cost-effective to design this solar-driven rainwater cooling device to work every day, especially for the rainy and cloudy days. Thus, equivalent sunny days in each month can be predicted based on an assumption of 10 – 12 sun hours in a sunny day in different months. In an ideal scenario, sunny days and rainy days occur intermittently and an operating day ratio (number of sunny days/number of rainy days) is calcu-lated to evaluate the relationship between collected rainwater and required rainwater. Table 3 shows that, except in May, the amount of collected rainwater can meet the requirement of the cooling system in each month. A 1000-l water tank allows it to meet the water consumption up to 10 days under the worst-case scenario like continuous sunny days.
4.4
Annual energy saving and payback period
[image:7.612.70.269.59.215.2]The certain amount of rain water can cool more PV modules if heat is removed by evaporation, under the premise that rain-water uniformly covers the PV modules. Based on available rainwater in each month, it is estimated that this solar-driven rainwater cooling system can increase 33.4 kWh of electrical yields for a domestic house when six PV modules are applied. To comprehensively analyse the benefits of a new system, the economic analysis of the solar-driven water cooling system is conducted by the extra cost of equipment required to con-struct this cooling system, against additional energy benefits obtained from the modified PV panels. The total cost of this passive cooling system is estimated as £197., i.e. £80 to the cost of the rainwater harvest system and £117 to the cost of the gas expansion chamber, a secondary water tank, pipes and valves.
[image:7.612.339.539.61.167.2]Figure 11. Comparison of the power outputs between with cooling and without cooling to PV panel.
[image:7.612.311.570.236.340.2]Figure 10. Comparison of the efficiencies between with cooling and without cooling to the PV panel.
Figure 12. Volume of daily pushed rainwater by a gas chamber in different months.
Table 3.Comparison between collected rainwater and required rainwater.
Month Daylight hours
Equivalent sunny day
Operating day ratio
Rainwater collected (l/day)
Required rainwater (l/day)
April 146.32 14.60 0.95 123 89
May 200.9 18.26 1.56 110 104
[image:7.612.69.269.262.417.2]The saving in electrical yields per year equals to £20 when feed-in tariff equals 0.45£/kWh and electricity rate equals 0.145£/kWh [22].
A simple payback formula was used to calculate the payback period as follows with an inflation rate of 2.8% being taken into account:
Payback period¼ initial cost annual operating saving
The annual saving in the equation is calculated from:
Annual operating} saving = kWh(electricity rateþfeed in tariff ). Assume all the costs of this solar-driven rainwater system are paid up front; the power output of PV discount rate at 1% a year; the electricity inflation rate at 2.8%; the feed-in-tariff infla-tion rate at 2.5% and annual saving rate at 3%. Based on the assumptions mentioned earlier, the calculation results are shown in Table4. It can be seen from Table4that under this conserva-tive assumption, the payback period is 14 years. Considering that the cost (including water tanks, gas chambers and other equipment) could be reduced with mass production and the additional rainwater collection can be recycled for domestic use in non-operating period, the economic analysis results make this cooling approach quite attractive.
5
CONCLUSION
This paper reports a passive cooling system, which can be used for cooling the PV modules on the roof of a domestic house in order to increase electrical efficiency. The simulation results for this cooling system show:
† The influences of the absorbing surface area on the water supply volume are not obvious, whereas a gas chamber with larger volume significantly increases the water supply. However, the actual chamber size should be comprehensively considered with roof area and available rainwater capacity.
† On the design day, the solar-driven rainwater cooling system is able to pump 152 l of water to PV modules. The maximum reduction in the temperature of the cells reaches 198C and average electrical yield is increased by 8.3%.
† For the solar-driven rainwater cooling system operating between April and September, this cooling system can in-crease the electricity generation by 33.4 kWh annually.
† The simple payback period of the solar-driven rainwater cooling system was found to be equal to 14 years under a con-servative assumption. It still has potential and the initial cost will be reduced if it incorporates with the guttering system.
The most significant point of this approach is that it utilizes rainwater and solar energy to cool the PV panels—improving PV system efficiency with no requirement for additional energy input. The authors believe that it has the potential for further exploration.
REFERENCES
[1] Skoplaki E, Palyvos JA. On the temperature dependent of photovoltaic module electrical performance: a review of effective/power correlations.Sol Energy2009;83:614 –24.
[2] Notton G, Cristofari C, Mattei M,et al. Modeling of a double-glass photo-voltaic module using finite differences.Appl Thermal Eng2005;25:2854 – 77. [3] Edenburn MW. Active and passive cooling for concentrating photovoltaic arrays. Conference record, 14th IEEE PVSC, 1980, Washington State Convention Center, USA, pp. 776– 776.
[4] Araki K, Uozumi H, Yamaguchi M. A simple passive cooling structure and its heat analysis for 500* concentrator PV module.Conference record, 29th IEEE PVSC, 2002, Washington State Convention Center, USA, pp. 1568 – 71. [5] Tonui JK, Tripanagnostopoulos Y. Improved PV/T solar collectors with heat extraction by forced or natural air circulation. Renew Energy 2007;32: 623 – 37.
[6] Kalogirou AS. Use of TRNSYS for modelling and simulation of a hybrid pv – thermal solar system for Cyprus.Renew Energy2001;23:247 –60. [7] Tripanagnostopoulos Y, Nousia T, Souliotis M,et al. Hybrid photocoltaic/
thermal solar systems.Sol Energy2002;72:217 – 34.
[8] Krauter S. Increased electrical yield via water flow over the front of photo-voltaic panels.Sol Energy Mat Sol Cells2004;82:131 – 7.
[9] Abdolzadeh M, Ameri M. Improving the effectiveness of a photocoltaic water pumping system by spraying water over the front of photovoltaic cells.
[image:8.612.44.298.76.420.2]Renew Energy2009;34:91 – 6. Table 4.Payback period analysis.
Year Power generated at 1% discount rate (kWh) Electricity supply rate (£) at 2.8% inflation rate
Feed-in-tariff (£) at 2.5% inflation rate Annual operating saving (£) Total saving (£) Initial capital growth (£) at 3% annual interest rate
1 33.40 0.15 0.45 19.87 197.00
2 32.73 0.15 0.46 19.98 202.91
3 32.40 0.15 0.47 20.28 209.00
4 32.06 0.16 0.48 20.59 215.27
5 31.73 0.16 0.50 20.90 221.73
6 31.40 0.17 0.51 21.21 228.38
7 31.06 0.17 0.52 21.53 235.23
8 30.73 0.18 0.53 21.84 242.29
9 30.39 0.18 0.55 22.16 249.55
10 30.06 0.19 0.56 22.48 257.04
11 29.73 0.19 0.58 22.80 264.75
12 29.39 0.20 0.59 23.13 272.69
13 29.06 0.20 0.61 23.45 280.23 280.87 14 28.72 0.21 0.62 23.78 304.01 289.30
15 28.39 0.21 0.64 24.11 297.98
16 28.06 0.22 0.65 24.44 306.92
17 27.72 0.23 0.67 24.77 316.13
18 27.39 0.23 0.68 25.10 325.61
19 27.05 0.24 0.70 25.44 335.38
20 26.72 0.25 0.72 25.77 345.44
21 26.39 0.25 0.74 26.10 355.80
22 26.05 0.26 0.76 26.44 366.48
23 25.72 0.27 0.77 26.77 377.47
24 25.38 0.27 0.79 27.10 388.80
[10] Kordzadeh A. The effects of nominal power of array and system head on the operation of photovoltaic water pimping set with array surface covered by a film of water.Renew Energy2010;35:1098 – 102.
[11] Furushima K, Nawata Y. Performance evaluation of photovoltaic power gen-eration system equipped with a cooling device utilizing siphonage. Sol Energy Eng2006;128:146 –51.
[12] Wilson E. Theoretical and operational thermal performance of a ‘wet’ crys-talline silicon PV module under Jamaican condition. Renew Energy
2009;34:1655 –60.
[13] Akbarzadeh A, Wadowski T. Heat pipe-based cooling systems for photo-voltaic cells under concentrated solar radiation.Appl Therm Eng1996;16: 81 – 7.
[14] Huang MJ, Eames PC, Norton B. Thermal regulation of building-integrated photovoltaic using phase change materials. Int J Heat Mass Transf
2004;47:2715 –33.
[15] Biwole P, Eclache P, Kuznik D. Improving the performance of solar panels by the use of phase change materials, World Renewable Energy Congress 2011-Sweden.Photovoltaic Technol2011;11:2953 – 60.
[16] Gang P, Jie J, Wei H,et al. Performance of photovoltaic solar assisted heat pump system in typical climate zone.J Energy Environ2007;6:1 – 9. [17] Xu GY, Deng SM, Zhang XS,et al. Simulation of a photovoltaic/thermal
heat pump system having a modified collector/evaporator. Sol Energy
2009;83:1967 – 76.
[18] Song B, Inaba H, Horibe A,et al. Heat, mass and momentum transfer of a water film flowing down a tilted plate exposed to solar irradiation.Int J Therm Sci1998;38:384 – 97.
[19] Smith CC, Lof G, Jones R. Measurement and analysis of evaporation from an inactive outdoor swimming pool.Sol Energy1994;53 – 1:3 – 7.
[20] Sutton Bonington. (2013) Weather data. http://www.metoffice.gov.uk/pub/ data/weather/uk/climate/stationdata/suttonboningtondata.txt. (Retrieved on 3 April 2013).
[21] Gould J.Rainwater catchment systems for domestic supply: design, construc-tion and implementaconstruc-tion. Guildford: Biddles LtdGuildford, 1999, 45 – 68. [22] FITs. Feed-in tariff scheme. http://www.energysavingtrust.org.uk/