STUDIES OF ALTERNATIVE ANODES AND ETHANOL FUEL FOR SOFCS
Gaël Pierre Germain Corre
A Thesis Submitted for the Degree of PhD at the
University of St. Andrews
2009
Full metadata for this item is available in the St Andrews Digital Research Repository
at:
https://research-repository.st-andrews.ac.uk/
Please use this identifier to cite or link to this item:
http://hdl.handle.net/10023/841
STUDIES OF ALTERNATIVE ANODES
AND
ETHANOL FUEL
FOR SOFCS
A thesis presented for the degree of Doctor of Philosophy
by
Gaël Pierre Germain Corre
University
of
St Andrews
I, Gael Pierre Germain Corre, hereby certify that this thesis, which is approximately 44000 words in length, has been written by me, that it is the record of work carried out by me and that it has not been submitted in any previous application for a higher degree.
I was admitted as a research student in October 2005 and as a candidate for the degree of Doctor of Philosophy in September 2006; the higher study for which this is a record was carried out in the University of St Andrews between 2005 and 2009.
date …… signature of candidate ………
I hereby certify that the candidate has fulfilled the conditions of the Resolution and Regulations appropriate for the degree of Doctor of Philosophy in the University of St
Andrews and that the candidate is qualified to submit this thesis in application for that degree.
date …… signature of supervisor ………
In submitting this thesis to the University of St Andrews we understand that we are giving permission for it to be made available for use in accordance with the regulations of the University Library for the time being in force, subject to any copyright vested in the work not being affected thereby. We also understand that the title and the abstract will be published, and that a copy of the work may be made and supplied to any bona fide library or research worker, that my thesis will be electronically accessible for personal or research use unless exempt by award of an embargo as requested below, and that the library has the right to migrate my thesis into new electronic forms as required to ensure continued access to the thesis. We have obtained any third-party copyright permissions that may be required in order to allow such access and migration, or have requested the appropriate embargo below.
The following is an agreed request by candidate and supervisor regarding the electronic publication of this thesis:
Access to Printed copy and electronic publication of thesis through the University of St Andrews.
PREFACE
ACKNOWLEDGEMENTS
First I would like to deeply thank Professor John Irvine for giving me the opportunity to work on this project. Prof. John Irvine gave me the chance to take a new start in my scientific career and to work on renewable energies, which I have always wanted to. I was coming from a different field when I first started on this project and I had to learn a lot, but Prof. John Irvine has always been patient with me and has always given me the time I required to adjust my knowledge. I enjoyed a great support, the opportunity to travel and collaborate with another research team, and a great flexibility.
I am really grateful to both Professor Raymond Gorte and Professor John Vohs for warmly welcoming me in their laboratory at the University of Pennsylvania in Philadelphia. The research work we have carried out during my two stays in Philadelphia has been really productive and enjoyable. I have always enjoyed the interesting scientific discussions we had about the research.
This collaboration would not have been so productive without the help and dedication of Dr. Gun Tae Kim. We had a great time working together, and I really do hope we can collaborate again in the future.
Summary
This thesis explores the development of efficient engineered composite alternative anodes and the use of ethanol as a fuel for Solid Oxide Fuel Cells. SOFCs can in theory operate with fuels other than hydrogen. However, this requires the design of efficient alternative anode material that do not catalyze carbon formation and that are tolerant to redox cycles. An innovative concept has been developed that relies on the impregnation of perovskites into porous YSZ structures to form the anode functional layer. Catalysts are added to provide sufficient catalytic activity. Cells with anodes containing LSCM and Ce/Pd have displayed excellent performance. At 800°C, and with a 65 µm thick electrolyte, the power outputs were above 1W/cm2in humidified hydrogen and 0.7 W/cm2 in humidified methane. These electrodes have shown the ability to reduce CO2 electrochemically with an efficiency that is similar to that which can be achieved for H2O electrolysis and the anodes could operate on pure
CO2. The importance of incorporating an efficient catalyst was demonstrated. The use
of 0.5 wt% of Pd is sufficient to dramatically improve the performance in such electrodes. The microstructure of impregnated LSCM-YSZ composites plays an important role in the high performance obtained. A layer of LSCM nanoparticles covering the YSZ is formed upon reduction, offering a great surface area for electrochemical reactions. The fabrication method presented in this thesis is a powerful tool for designing microstructures in situ.
Among the various fuels under consideration for SOFCs, ethanol offers outstanding advantages. Half cell measurements have been performed to characterize the performance of different types of anodes when operated on ethanol/steam mixtures. Steady performance was achieved on LSCM-CGO anodes. Carbon deposits from gas phase reactions have been evidenced and were found to be responsible for the performance enhancement when the cell is operated in diluted ethanol as compared to hydrogen. At high steam content, polarization resistances of LSCM-CGO-YSZ
anodes in ethanol/ steam mixtures were shown to be below 0.3 Ω.cm2
Contents
Summary ...5
INTRODUCTION...8
PART I - FUEL CELLS AND GENERAL EXPERIMENTAL TECHNIQUES...11
1.FUEL CELL TECHNOLOGY ...12
1.1. Principle...12
1.1.1. Features...12
1.1.2. History ...13
1.1.3. Different types of fuel cells ...13
1.1.4. Applications...115
1.2. SOFC ...15
1.2.1. General considerations...15
1.2.2. Materials for SOFC ...19
1.3. Thermodynamics of fuel cells ...224
1.4. Fuel cell efficiency ...26
1.4.1. Heating efficiency...26
1.4.2. Thermodynamic efficiency ...26
1.4.3. Current efficiency ...27
1.4.4. Voltage efficiency...28
2.GENERAL EXPERIMENTAL TECHNIQUES ...32
PART II - SOFC ANODE DEVELOPEMENT ...36
3.REVIEW OF ANODE MATERIALS FOR SOLID OXIDE FUEL CELLS ...37
3.1. Ni-YSZ cermets...37
3.1.1. Fabrication...39
3.1.2. Starting powder ...40
3.1.3. Sintering temperature ...41
3.1.4. Electrical conductivity ...44
3.1.5. Degradation ...47
3.1.6. Porosity...47
3.1.7. Relation between microstructure and overpotential ...48
3.1.8. Multilayer cermet anodes ...50
3.1.9. Limitations of Ni/YSZ cermets ...51
3.2. Alternative anode materials ...52
3.2.1. Modified Ni/YSZ anodes...53
3.2.2. Cermet anodes ...53
3.2.3. MIEC anodes ...56
3.3. Conclusions ...63
3.4. Proposed Work ...63
5.Initial performances...72
5.1. Introduction ...72
5.2. Results ...72
5.3. Conclusion ...76
6.CO2Electrolysis ...78
6.1. CO2Electrolysis ...78
6.2. Results ...80
6.3. Conclusion ...84
7.Effect of the Catalyst on the performance ...86
7.1. Introduction ...86
7.2. Results ...86
7.3. Conclusion ...90
8.Study of the Microstructure...91
8.1. Introduction ...91
8.2. Results ...91
8.2.1. LSCM-YSZ composites...91
8.2.2. La0.33Sr0.67TixMn1-xO3+/-(LSTM)...97
8.2.3. Conclusions ...101
9.Discussion ...102
PART III - DIRECT ETHANOL SOFCS ...105
10.Ethanol for SOFCs ...106
10.1. Introduction ...106
10.2. Fuels for SOFCs ...106
10.2.1. The hydrogen economy ...106
10.2.2. Ethanol...108
10.2.3. Fuel processing for SOFC ...113
10.3. High temperature chemistry of ethanol ...115
10.3.1. Pyrolysis ...116
10.3.2. Carbon deposition...118
10.3.3. Steam reforming ...128
10.3.4. Experimental studies...134
10.3.5. Internal steam reforming...136
10.4. Conclusions ...140
11.Experimental methods ...143
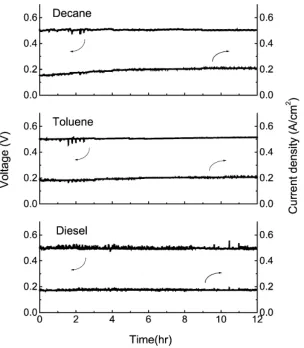
12.Fuel cell studies ...147
INTRODUCTION
Modern life is mainly based on the supply of electricity and transport of goods and people, two sectors that are deeply related to mass consumption of energy. Our important energy demand is mainly fulfilled by the combustion of fossil fuels as can be seen on Figure 1. Oil, coal and natural gas accounted for 85% of the world energy usage in 2006.
Figure 1: Current global world energy usage1
The world energy demand is constantly increasing. An important contribution to those ever growing energy needs is the rapid development of third world economies such as China and India. The best example is certainly China, whose energy consumption is displayed on Figure 2, along with projected data. The impressive growth in the energy needs of those countries will very likely be mainly matched by the use of fossil fuels.
Figure 2: China’s projected energy consumption2
increasingly apparent and problematic. A global fossil fuel based economy is indeed unsustainable in many aspects.
Fossil fuel reserves are limited and therefore are bound to become increasingly scarce with the rise of the global energy demand. Reserves cannot last forever meaning that energy sources will have to be diversified. Expected consequences of an increased demand facing a limited availability have already been spectacular on the price of oil. The barrel of oil reached the worrying threshold of 150$ in 2008. Although the oil price has dropped during the 2008/2009 credit crunch, a serious warning has been given to governments.
An important characteristic of the fossil based economy is that many countries need to import most of the fuel required for their energy needs and hence must rely on other countries. As an example, most of the natural gas consumed in Europe is provided by Russia. Energy independence can be an economic advantage and is a form of freedom sought by many governments. It was a major factor in the USA’s recent decision to invest massively on locally produced biofuels to replace oil importations.
In terms of pollution, the combustion of fossil fuels induces substantial emissions of greenhouse gases such as CO2, and pollutants such as SOx and NOx. Atmospheric
pollution and global warming are becoming major concerns that need to be addressed. Finally, most of processes used in converting fossil fuels to energy suffer from low energy efficiency. Those processes require the intermediate use of heat energy and are therefore limited by the Carnot efficiency.
The energy challenges that our world is facing are therefore multiple. A transition to a sustainable economy will be required. In a sustainable economy, energy sources should be renewable and their conversion to energy should be as pollution free as achievable. Greenhouse gases emissions should be reduced to acceptable levels. Energy sources have to be better used, meaning that energy conversion processes featuring high efficiencies need to be developed and widely used. The transition to a sustainable economy requires to considerably modifying the energy consumption habits in the developed countries, while ensuring that the development of emerging economies is performed in a sustainable way.
while ensuring their long-term stability. In the long term, fuel cells will be an essential component of any hydrogen or similar clean-energy economy not only because they can very efficiently convert fuels to electricity but because they may also work well as electrolysers for storing excess energy as hydrogen or convert CO2(chapter 6). In the
short-term, they promise greatly enhanced conversion efficiencies of more conventional fuels, and so will deliver large reductions in carbon dioxide emissions3.
The hydrogen economy might become a reality in the future but many technological hurdles related to its storage, production and transport need to be lifted before the widespread use of hydrogen as en energy carrier could be considered (chapter 10). Among the potential fuels that could play a role in the future economy, second generation cellulosic bioethanol is of particular interest. Sources that can be used in the production process are multiple and renewable. Cellulosic ethanol can be produced from feedstocks that are today considered as waste, which is still a largely untapped source of energy in the present economy (chapter 10).
The focus of this thesis is to investigate the use of bioethanol as a fuel for SOFCs. As outlined above, fuel cells will surely play a major role in the development of a sustainable economy due to their high efficiency, while second generation cellulosic ethanol is a very attractive energy source. Therefore, combining those two promising elements of the future economy can provide a suitable answer to the problems we need to address today.
In a SOFC, the fuel is oxidized on the anode. Standard anodes materials used in SOFC are Ni-YSZ cermets (chapter 3). Those anodes work well with hydrogen but suffer from severe limitations when hydrocarbon fuels are used. An intensive research topic within the SOFC community is hence to develop efficient alternative anodes that can operate on hydrocarbons (chapter 3). Part of this thesis has been dedicated to the development of such anodes by using an innovative concept that combines the materials expertise developed at The University of St Andrews with the anode fabrication method developed at The Universitry of Pennsylavannia (Part II, chapters 2 to 8).
Using ethanol at the high temperatures at which a SOFC operates involves multiple and complex processes. Before the electrochemical oxidation occurs, both homogeneous and heterogeneous chemistry play an important role in converting the ethanol and forming carbon deposits (Chapter 10). The other part of this thesis has been dedicated to the study of the operation of anodes, involving different type of materials, on ethanol/steam mixtures (PART III, chapter 9 to 12).
1BP statistical review of world energy June 2006, British petroleum, 2006 2
World energy outlook 2007, International Energy agency
3A. Atkinson, S. Barnett, R.J. Gorte, J.T.S. Irvine, A.J. McEvoy, M. Mogensen, S.C. Singhal and
PART I
FUEL CELL TECHNOLOGY
1.1. Principle
A fuel cell is an energy conversion device that produces electricity, and heat, by electrochemical combination of a fuel with an oxidant, which can be viewed as a battery with external fuel supply. A fuel cell consists of four components: two electrodes, the anode and thecathode, separated by an electrolyte, and connected by an external circuit or interconnect, as shown on Figure 3. Fuel is fed to the anode where it is oxidized, releasing electrons to the external circuit. Oxidant is fed to the cathode where it is reduced using the electrons delivered by the external circuit. The electrons flow through the interconnect, from the anode to the cathode, produces direct-current electricity.
Figure 3: Principle scheme of an individual fuel cell1.
In theory, any gases capable of electrochemical oxidation and reduction can be used as fuel and oxidant in a fuel cell. Oxygen is the most common oxidant for fuel cells since it is readily and economically available from air. Hydrogen, which offers high electrochemical reactivity, is the most common fuel. However, fuel cells can be developed to work with alternative fuels to hydrogen.
1.1.1.
Featuresintermediate of thermal energy (unlike indirect conversion in conventional systems), their conversion efficiency is not subject to the Carnot limitation. Further energy gains can be achieved when the produced heat is used in combined heat and power, or gas turbine applications. The improved efficiency as compared to conventional energy conversion devices is the main reason fuel cells are receiving considerable attention. Besides their high energy conversion efficiency, fuel cells offer several additional advantages over conventional methods of power generation. They offer a much lower production of pollutants. A fuel cell fuelled with H2 and air only produces water.
Other significant advantages offered are modular construction and size flexibility, which makes them well suited for decentralized applications, high efficiency at part load, fuel flexibility and remote/unattended operation. Moreover, their vibration free operation eliminates noise usually associated with conventional power generation systems. More details concerning general features of fuel cells can be found in the literature1,2.
1.1.2.
HistoryThe fuel cell concept, ascribed to Sir Humprey Davy, dates from the beginning of the 19thcentury. The first hydrogen-oxygen cell was successfully operated by Sir William Grove in 18393, generally referred to as the start of fuel cell history. While investigating the electrolysis of water, Grove observed that when the current was switched off, a small current flowed through the circuit in the opposite direction, as a result of a reaction between the electrolysis products, hydrogen and oxygen, catalysed by the platinum electrodes. Grove recognized the possibility of combining several of these in series to form a gaseous voltaic battery4, and also made the crucially important observation that there must be a ‘notable surface of action’ between the gas, the electrolyte and the electrode phases in a cell. Maximizing the area of contact between those three phases remains at the forefront of fuel cell research and development. Some 50 years after Grove’s ‘gas battery’, Mond and Langer introduced the term fuel cell5 to describe their device which had a porous platinum black electrode structure, and used a diaphragm made of a porous non-conducting substance to hold the electrolyte.
Despite the fact that the fuel cell was discovered over 160 years ago, and the high efficiencies and environmental advantages offered, only now are fuel cells approaching commercial reality.
1.1.3.
Different types of fuel cellslower operating temperature for Alkaline (AFC), Polymer electrolyte Membrane (PEMFC) and Phosphoric Acid (PAFC) fuel cells. The operating temperature dictates in turn the physicochemical and thermo mechanical properties of materials to be used as cell component as well as the type of fuel the cell can be operated on. Moreover, this difference in operating temperatures has a number of implications for the applications for which particular fuel cell types are most suited.
Type Temp.
(C) Fuel Electrolyte Chargecarrier
Polymer Electrolyte
Membrane(PEM) 70-110
H2,
methanol
Suffocated polymers
(H2O)nH +
Alkali Fuel Cell
(AFC) 100-250 H2
Aqueous
KOH OH
-Phosphoric Acid
Fuel Cell (PAFC) 150-250 H2 H3PO4 H+
Molten Carbonate
Fuel Cell (MCFC) 500-700
H2,
hydrocarbo ns, CO
(Na,K)2CO3 CO
32-Solid Oxide Fuel
Cell (SOFC) 600-1000
H2, CO,
hydrocarbo ns, alcohols
(Zr,Y)O2- O
2-Table 1: Different types of fuel cells and characteristics1
Large differences exist in application, design, size, cost and operating range for the different type of fuel cells. Of the available fuel-cell technologies, PEFC and SOFC are thought to have the most potential to achieve cost and efficiency targets for widespread use in power generation, and have been the most investigated types.
In general, high temperature fuel cells exhibit higher efficiency and are less sensible to fuel composition. PEMFC systems require a pure H2 fuel stream because the
1.1.4.
ApplicationsThe potential applications of fuel cells in society are ever increasing, driven by the various benefits that the implementation of fuel cells would bring over current technologies, such as environmental and efficiency considerations. Application range all the way from very small scale ones requiring only a few watts to larger-scale distributed power generation of hundreds of MW.
The small scale power supply is a well suited market for fuel cells. Indeed, fuel cells offer significantly higher power densities than batteries, as well as being smaller and lighter and having much longer lifetimes. Hence, an increasing number of applications are emerging where only a few watts are required, such as palm-top and lap-top computers, mobile phones and other portable electronic devices.
Their potentially high reliability and low maintenance coupled to their quiet operation and modular nature makes fuel cells particularly suited to localised ‘off grid’ power generation, either for high quality uninterrupted power supplies, or remote applications. High temperature fuel cells (MCFC and SOFC) are suitable for continuous power production, where the cell temperature can be maintained. If the released heat is used to drive a gas turbine to produce extra energy, the system efficiency can be increased to levels as high as 80%, significantly higher than any conventional electricity generation process. Moreover, the produced heat makes SOFC particularly suitable to combined heat and power (CHP) applications ranging from less than 1 kW to several MW, which covers individual households, larger residential units and business and industrial premises, providing all the power and hot water from a single system.
The combination of their high efficiency and significantly reduced emissions of pollutants mean that fuel cell powered vehicles are a very attractive proposition, especially in heavily populated urban areas. The efficiency is to be compared with about 20% for a combustion engine. Low temperature fuel cells, in particular PEMFC, are the most suited to transport applications, because of the need for short warm-up and cool down time and because there are no problem with temperature cycling. The concept of a fuel cell powered vehicle running on hydrogen, the so-called ‘zero emission vehicle’, is a very attractive one and is currently an area of intense activity for almost all the major motor manufacturers. As an example, fuel cell powered buses running on compressed hydrogen are successfully operated in several cities around the world.
operating temperature to display suitable conductivities, typically in the range 700-1000C, which has a number of consequences on SOFCs operation6.
SOFC involve multiple complex physico-chemical processes. The principle of an SOFC, involving hydrogen as a fuel is illustrated in Figure 4.
Figure 4: Principle of a Solid Oxide Fuel Cell involving H2as a fuel7.
Oxygen is electrochemically reduced at the cathode-electrolyte-gas interface. Electrons are delivered to the cathode through the interconnect where they react with oxygen molecules in the gas phase to deliver oxygen ions to the electrolyte via a charge transfer reaction:
) ( )
( 2 ) ( 2
1 2
2 g e c O e
O (Equation 1)
In this equation, the three phases are denoted as (g) for the gas, (c) for the cathode and (e) for the electrolyte. Oxygen ions migrate through the electrolyte via a vacancy hoping mechanism towards the anode-electrolyte-fuel interface where they participate in the fuel oxidation, written as follows for hydrogen:
) ( 2 ) ( )
( )
( 2 2
2 g O e H O g e a
H (Equation 2)
where (a) denotes the anode. The hydrogen in the gas phase reacts with the oxygen ions provided by the electrolyte to deliver electrons to the anode.As long as a load is connected between the anode and the cathode, the electrons from the anode will flow through the load back to the cathode, and electrical current will flow through the circuit.
O H H
O2 2 2 (Equation 3)
Another accurate way to represent the overall reaction occurring in the cell, regardless of the fuel involved, is to describe the oxygen transfer:
) ( )
( 2
2 c O a
O (Equation 4)
An SOFC can therefore be considered as an oxygen pump. The amount of oxygen transported to the anode will depend on the type of fuel used and the reactions occurring at the anode.
1.2.1.1.History
The solid oxide fuel cell was first conceived following the discovery of solid oxide electrolytes in 1899 by Nernst8. Nernst discovered that the very high electrical resistance of pure solid oxides could be greatly reduced by addition of certain other oxides. The most promising of these mixtures consisted mainly of zirconia (ZrO2)
with small amounts of added yttria (Y2O3). This is still the most widely used
electrolyte material in the SOFC.
The first working SOFC was demonstrated by Baur and Preis in 1937, using stabilized zirconia as electrolyte and coke and magnetite respectively as a fuel and oxidant9. The current produced by their cell was too low for any practical purposes, but the possibility of operated SOFCs had been demonstrated. Unfortunately the high operating temperature and the reducing nature of the fuel gas led to serious materials problems and despite very significant efforts by Baur and other researchers the search for suitable materials was unsuccessful.
This effectively hindered the development of the solid oxide fuel cells until the 1960s, when a first period of intensive activity in SOFC development began. Intensive research programs that were driven by new energy needs mainly for military, space and transport applications, addressed mainly the electrolyte conductivity improvement and the first steps in SOFC technology. A second period of intense activity began in the mid 80’s and is still goes on today, where research focused on electrodes and technology.
the anode and act as a fuel. When practical fuel are used, the environmental impact is better than for combustion technologies, in the sense than less CO2 and NOx are
produced per unit of power generated. Looking at the overall system efficiency, the high quality exhaust heat released during operation can be used as a valuable energy source, either to drive a gas turbine when pressurized or for CHP applications.
Originally, SOFCs have been developed for operation primarily in the temperature range of 900-1000C, which is beneficial for the fuel reforming, electrochemistry kinetics and the added value of the exhaust heat. However, some important drawbacks stem from such elevated temperatures. The materials that can be used are limited with respect to their chemical stability in oxidizing and/or reducing environment and their chemical and thermo mechanical compatibility with adjacent components. Hence there are considerable investigations in lowering the operating temperature by 200ºC or more which allows the use of a broader set of materials, is less demanding on the seals and the balance-of-plant components, simplifies thermal management, aids in faster start-up and cool down, and results in less degradation of cell and stack component2. Because of these advantages, activity in the development of SOFCs capable of operating in the temperature range of 600-800C has increased dramatically in the last few years. However, at lower temperatures, electrolyte conductivity and electrode kinetics decrease significantly.
In terms of applications, the length of time that is generally required to heat up and cool down the system restricts the use of SOFCs in applications that require rapid temperature fluctuations. This is a consequence of the need to use a relatively weak, brittle component as the substrate material and because of problems associated with thermal expansion mismatches. This restriction applies particularly for transport applications, where a rapid transport start-up is essential.
Reducing the cost of SOFCs is a crucial issue for their commercialization. Currently, the high cost-to-performance ratio limits SOFC introduction on the energy market. In this respect, lower operation temperature also makes possible the use of inexpensive metallic interconnections in place of lanthanum chromite-based ceramic interconnections.
1.2.1.3.Design
The solid state character of all SOFC components means that, in principle, there is no restriction on the cell configuration. Instead, it is possible to shape the cell according to criteria such as overcoming design or applications issues. As with other cell types, it is necessary to stack SOFCs to increase the voltage and the power produced. A stack can in principle comprise any number of cells depending on the desired power, and a fuel cell plant can be designed in modules of stacks in series- and parallel connections. To construct an electric generator, individual cells are connected in both electrical parallel and series to form a semi-rigid bundle that becomes the basic building block of a generator.
channels and serves as a current conductor.
Figure 5: The two most common SOFC designs: tubular (left) and planar (right)1.
Alternative designs have been proposed, such as the planar segmented design developed at Rolls Royce, or the SOFC roll developed at the University of St Andrews. The later is an innovative design that takes advantage of both planar and tubular designs.
1.2.2.
Materials for SOFC1.2.2.1.Electrolytes
The SOFC electrolyte materials were recently reviewed by Goodenough10 and Skinner and Kilner11, and are detailed in reviews addressing SOFCs12,13. Much of the research carried out on SOFCs in the 1960s focused on optimising the ionic conductivity of the solid electrolyte. Research on electrolyte materials is still active today, in an effort to lower operating temperatures.
conductivity is too low. The addition of certain aliovalent oxides stabilizes the cubic fluorite structure of ZrO2from room temperature to its melting point and, at the same
time, creates a large concentration of oxygen vacancies by charge compensation according to the following equation (written for Y2O3stabilization using Kroger-Vink
notation):
x O O
Zr V O
Y O
Y2 3 2 ' .. 3 (Equation 5)
The high oxygen vacancy concentration gives rise to high oxygen ion mobility and leads to an extended oxygen partial pressure range of ionic conduction, making stabilized zirconia suitable for use as an electrolyte in SOFCs (the oxygen partial pressure range covers the conditions, 1 to 10-18 atm) to which a SOFC electrolyte is exposed in the fuel cell during operation. Oxygen-ion conduction takes place in stabilized ZrO2 by movement of oxygen ions via vacancy. It is generally found that
that the ionic conductivity is a maximum near the minimum level of dopant oxide required to fully stabilise the cubic phase. At higher dopant levels the ionic conductivity decreases. Typically, the level of Y2O3 present in YSZ is around 8
mol%.
The operating temperature is principally governed by the nature of the electrolyte, i.e. its ionic conductivity, and the thickness of the electrolyte layer. Indeed, the oxygen ionic conductivity for electrolyte materialsis usually expressed as:
) / exp( 1
0T Eel RT
(Equation 6)
For YSZ,03.6 x 105S K/cm and Eel8 x 104J/mol17.
Therefore, increasing the operating temperature or making thinner electrolyte layers can reduce the resistivity to oxygen ions transfer. Conventional zirconia based SOFCs generally require an operating temperature above 850 C. This high operating temperature places severe demands on the material used as interconnects and for manfolding and sealing, and necessitate the use of expensive ceramic materials and specialist metal alloys. There is therefore considerable interest in lowering the operating temperature of SOFCs to below 700C to enable the use of cheaper materials, such as stainless steel, and reduce fabrication costs, whilst maintaining high power outputs. Reducing the electrolyte thickness will obviously allow a reduction of the operating temperature but this approach is of course limited. The alternative route consists in developing new electrolyte materials showing higher conductivity than doped zirconia.
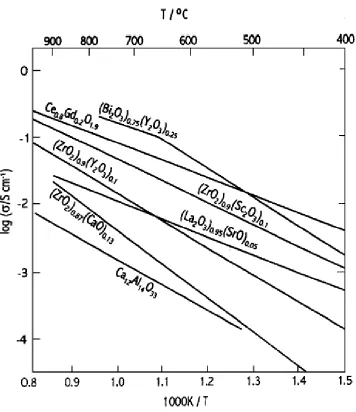
Figure 6: Specific conductivities of selected solid oxide electrolytes13.
Gadolinia-doped ceria (CGO) offers an ionic conductivity substantially higher than YSZ. However, at elevated temperatures in a reducing atmosphere, such as that present at the anode, ceria undergoes partial reduction to Ce3+, which introduces electronic conductivity that significantly lowers the efficiency of the SOFC, and also an undesirable structural change. Considerable effort has been devoted to minimizing the electronic conductivity of doped ceria under reducing conditions. One solution is to use an additional ultra-thin interfacial electrolyte layer which prevents electronic transport, and can suppress the reduction of ceria under reducing conditions.
Increased conductivity can be obtained from Lanthanum gallate, LaGaO3 by
temperatures around 600-700 C, which are currently too low to obtain adequate power densities with zirconia based SOFCs. However, there are problems associated with the stability of certain compositions of LSGM. It has also proved difficult to prepare pure single phase electrolytes of LSGM, additional phases raising doubts over the long term durability of SOFCs with LSGM electrolytes, and much further research into this material is still required.
1.2.2.2.Electrodes
1.2.2.2.1 Requirements
Electrodes for SOFC must fulfil some important requirements to ensure high and durable power output. Electrodes serve to provide sites for electrochemical oxidation of the fuel (anode) and reduction of the oxidant (cathode). Since electrochemical reactions in a SOFC involve gaseous reactants, electrons and oxygen ions (Equations 1 and 2), reactions will occur only on sites possessing conductivities for those three phases. Those active sites, located at electrode-electrolyte-gas three-phase interface as depicted on Figure 7, are commonly referred to as the Triple Phase Boundary (TPB). Practical systems must be designed with an extended active surface area. To extend the TPB area, electrodes are fabricated as mixed ionic and electronic conductors (MIEC) porous ceramics or ceramic-metallic composites. The electrode microstructure provides interpenetrating, continuous three-dimensional electron, ion, and gas transport networks. The pore, metal, and ceramic phase typically occupy one third of the volume. An ideal microstructure would offer the highest triple phase boundary (TPB) length for electrochemical reactions, an optimized contact between the electrolyte and the anode, and be dimensionally stable during operation.
Chemical and thermal compatibility between electrode materials and the adjacent components is essential. No solid state reaction should occur between electrode materials and the interconnect or electrolyte, while thermal expansion coefficient of those materials should be close enough to allow stable long term operation. Electrodes must show high electrocatalytic activity toward oxidation/reduction of fuel/oxidant gases. High wettability with respect to the electrolyte surface is highly advantageous for competitive electrodes. Besides, ease of fabrication and low cost are of tremendous importance for a wide range of commercial applications. The ability to maintain the microstructure dimensionally stable over time is equally important. The high operating temperature can cause the microstructure to evolve with time with potential loss of connectivity in the conductive phases.
Figure 7: Illustration of fuel-cell chemical and transport processes in the three-phase regions7.
1.2.2.2.2 Cathode Materials
Due to the high temperature of YSZ based SOFC, materials that can be used as cathode are limited to noble metals and electronic conducting oxides. Nobel metals such as platinum or palladium are unsuitable for practical applications due to prohibitive costs12. Several doped oxides and mixed oxides have been investigated21,22. The disadvantages of most of these materials are thermal expansion mismatch, incompatibility with the electrolyte, and lack of conductivity.
Doping LaMnO3 with various lower-valence cations such as strontium, calcium,
barium, nickel, or magnesium has been studied. Strontium-doped LaMnO3 is
currently the preferred cathode material in SOFC because of its high electronic conductivity in oxidizing atmospheres.
1.2.2.3.Interconnects
The vast majority of zirconia-based SOFCs use lanthanum chromite, LaCrO3, as the
interconnect. LaCrO3 has a perovskite structure and is a p-type conductor, and
satisfies all the above mentioned criteria. The electrical conductivity of LaCrO3 can be enhanced by substituting the La3+ with a divalent cation, such as strontium, calcium or magnesium. The main drawback associated with lanthanum chromite interconnect is their manufacturing costs.
For SOFC operating in the intermediate temperature range, 500-750 C, it becomes feasible to use certain ferritic stainless-steel composites which fulfil the necessary criteria for the SOFC interconnect. The use of a metallic interconnect offers very substantial costs benefits compared to LaCrO3but their use is presently precluded in
SOFCs operating at higher temperatures.
1.3. Thermodynamics of fuel cells
A comprehensive study of the fuel cell thermodynamics has been performed by Kee et al.7. The thermodynamic limit on fuel cell performance can be understood by considering the energy and entr
opy accounting associated with a generic steady flow process.
The rate at which work is done by a system,
W, can be obtained by combining the first and second law of thermodynamics, and equals:
s P T s T h m W
( 0 ) 0 (Equation 7)
where h = hout- hin and S= Sout- Sin are respectively the net enthalpy and entropy
differences associated with the flow streams entering and leaving the system. Entropy
is produce within the system due to internal irreversible processes at a ratePs
. Since
s
P
is required to be positive by the second law of thermodynamics, the greatest power is produced by a reversible process and equals:
) ( h T0 s m
Wrev
(Equation 8)
While this general expression applies to any steady-flow process, a relevant case for fuel cells is one in which the temperature remains fixed at T0 and the pressure is
k k k rev NW (Equation 9)
wherekand Nkare respectively the species chemical potentials and molar flow rate,
and the sum runs over all species. If depletion effects are small enough, so that
out k in k, ,
and if
N
Nk k where μkis the stoichiometric coefficient of species k
and N is a rate of progress variable for a global oxidation reaction, equation 3 reduces to:
k k k rev NW (Equation 10)
If the fluid stream is an ideal gas mixture, the reversible work production rate can be written as:
vk
k k
rev N G RT P
W
ln 0
(Equation 11)
where G0 represents the free-energy change between reactants and products in the global reaction, and pk is the partial pressure. This expression also holds in the case
where one or more reactants are supplied in separate streams. All that is required is to evaluate the partial pressures of each species in the stream in which it is present.
Since the cell potential can be expressed as Ecell W/I
, equation 4 can be used to determine the reversible cell potential. The electric current generated in a fuel cell as a direct consequence of the reactions that result in oxidation of the fuel, is given by:
nF N
I (Equation 12)
where F is the faraday’s constant and n the number of exchanged electrons. Hence, the potential developed by a reversible cell is:
k k rev k P nF RT nF GE ln
0
(Equation 13)
When using equation 4 accounting for the oxygen transfer, the reversible potential simplifies to:
equilibrium potential (E) at other temperatures and partial pressures of reactants and products.
1.4. Fuel cell efficiency
Different efficiencies must be combined to produce the overall efficiency of a fuel cell. The overall efficiency is defined by the product of the electrochemical efficiency E, and the heating efficiencyH. The electrochemical efficiency is in turn, the product
of the thermodynamic efficiency T, the voltage efficiency V and the current or
Faradic efficiencyJ1,7 ,23:
H J V T H E
FC
(Equation 15)
1.4.1.
Heating efficiencyThe heating efficiency applies to cases where the fuel contains more species than the electrochemically active ones, such as gases, impurities and other combustibles. The heating value efficiency,H, is defined as:
com H H H
(Equation 16)
where Hrepresents the amount of enthalpy in the electrochemically active species and Hcom represents the amount of enthalpy included in all combustible species in the fuel gases fed to the fuel cell. A pure fuel will obviously give a heating efficiency of 100%.
1.4.2.
Thermodynamic efficiencyThe thermodynamic efficiency of a process measures how efficiently chemical energy extracted from the fuel stream is converted to useful power, rather than heat:
Q W W t or, h m W t
(Equation 17)
h S T h t 0 (Equation 18)
The thermodynamic efficiency is an extremely important feature when analyzing a fuel cell. This efficiency justifies the need for fuel cell development. Indeed, since the chemical energy is transferred directly to electricity, the free enthalpy change of the cell reaction may be totally converted to electrical energy. In a conventional heat engine, where only the temperature is changes, rev is limited to the familiar Carnot
efficiency: T T carnot t 0 , 1
(Equation 19)
For a constant-temperature fuel cell, the intrinsic maximum thermodynamic efficiency is given by:
k k rev k p H RT H G H S T H G 1 0 0 ln
0
(Equation 20)
1.4.3.
Current efficiencyThe current efficiency can be commonly expressed as the fuel utilization efficiency. The efficiency of a SOFC drops if all the reactants are not converted to reaction products. For a 100% conversion of a fuel, the amount of current density, iF, produced
is given by the Faraday’s law:
dt df zF
iF (Eq. 1)
where (df/dt) is the molar flow rate of the fuel. For the amount of fuel actually consumed, the current density produced is given by:
consumed dt df zF i
This efficiency can be expressed as well in terms of fuel consumption: ox in out in J h h h h
(Equation 23)
where hoxcorresponds to the enthalpy change when all the useful fuel has been
consumed.
1.4.4.
Voltage efficiencyWhen an electrical current is drawn from a fuel cell, part of the chemical potential available must be used to overcome the irreversible internal losses. Hence, the actual cell potential is decreased from its equilibrium potential meaning that in an operating SOFC, the cell voltage is always less than the reversible voltage. The voltage efficiency,V, is defined as the ratio of the operating cell voltage under load, E, to the
reversible cell voltage,R, and is given as:
r V
E E
(Equation 24)
A voltmeter connecting the anode and cathode can measure the cell electrical potential E, which depends on the current flow. Indeed, many irreversibilities in a fuel cell scale with current density. If no current flows, the cell voltage is the open circuit potential or open circuit voltage (OCV). In most cases, the OCV will equal the potential developed by a reversible cell. The difference between the operating cell voltage and the expected reversible voltage is termed polarization or overpotential and is represented as . This cell overpotential comprises the total ohmic losses for the cell, and the polarization losses associated with the electrodes. The useful voltage under load conditions can therefore be expressed as:
cath an
IR E
V (Equation 25)
In this equation, I is the current passing through the cell. The electrical resistance R
encompasses the ohmic resistance of all components. The polarization resistances, ŋan
and ŋcath respectively for the anode and the cathode account for non ohmic losses in
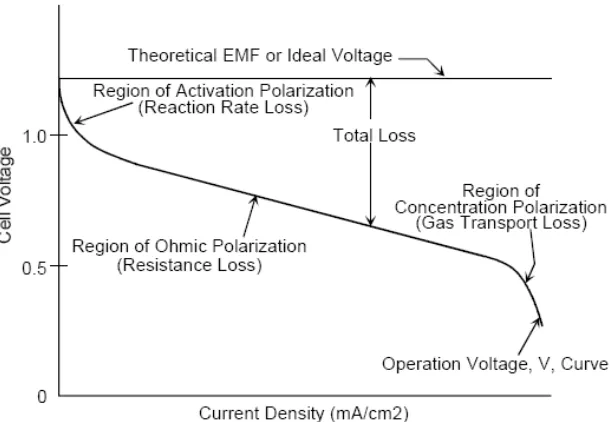
Figure 8: Ideal and actual fuel cell voltage/current characteristics1.
The concave portion at low current density is corresponds to activation-related losses. When the current density increases, the losses are dominated by the ohmic polarization. When the current density approaches its highest values, losses are dominated by concentration polarizations that cause the concave drop in the cell voltage. Each one of those different types of losses is described hereafter.
1.4.4.1.Internal resistance
The size of the voltage drop due to ohmic losses is simply proportional to the current:
V=IR
The internal resistance R encompasses the contribution from the electrodes, electrolyte, interconnect and bipolar plates:
R=RElectronic+ Rionic+ Rcontact
1.4.4.2.Charge transfer or activation polarization
The activation polarisation is related to the charge transfer processes occurring during the electrochemical reactions on electrode surfaces. The losses are caused by the slowness of the reactions taking place on the surface of the electrodes. Electrochemical reactions involve an energy barrier that must be overcome by the reacting species. A proportion of the voltage generated is hence lost in driving the electron transfer. This energy barrier, called the activation energy, results in activation or charge transfer polarization, A. Activation polarization is related to current
density,i, by the Butler-Volmer equation:
RT F i RT F i
i 0exp aA 0exp CA (Equation 26)
where is the symmetry coefficient and i0 the exchange current density. The
symmetry coefficient is considered as a fraction of the change in polarization which leads to a change in the reaction rate constant. The exchange current density is related to the balanced forward and reverse electrode reaction rates at equilibrium. A high exchange current density means a high electrochemical reaction rate and, in that case, a good fuel cell performance is expected.
The exchange current density can be determined experimentally by extrapolating plots of log i versus to=0. For large values of(either negative or positive) one of the bracketed terms in equation x becomes negligible. After rearranging one obtains,
i b a
A log
(Equation 27)
which is usually referred to as the Tafel equation. Parameters a and b are constants which are related to the applied electrochemical material, type of electrode reaction and temperature.
The constant a (in the form v=a ln(i/io) is higher for an electrochemical reaction which is slow. The constant iois higher if the reaction is faster. The current density io
can be considered as the current density at which the overvoltage begins to move from zero. The smaller is io, the greater is the voltage drop.
The exchange current density is a crucial factor in reducing the activation overvoltage. The cell performance can be improved through an increase of the exchange current density. This can be done in the following ways1:
- raising cell temperature - using more effective catalysts
- increasing the roughness of the electrodes
- increasing reactant concentration, e.g. pure O2instead of air
In low and medium temperature fuel cells activation overvoltage is the most important irreversibility and cause of voltage drop, and occurs mainly at the cathode. Activation overvoltage can be important at the anode when other fuels than hydrogen are involved.
1.4.4.3.Diffusion or concentration polarization
Concentration polarisation, D, is related to the transport of gaseous species through
the porous electrodes and, thus, its magnitude is dictated by the microstructure of the electrode, specifically, the volume percent porosity, the pore size, and the tortuosity factor. It becomes imminent when the electrode reaction is hindered by mass transport effects, i.e., when the supply of reactant and/or the removal of reaction products by diffusion to or from the electrode is slower than that corresponding to the charging/ discharging current i. When the electrode process is governed completely by diffusion, the limiting current, iL, is reached. In such a case, the demand for reactants
exceeds the capacity of the porous anode to supply them by gas diffusion mechanisms. High tortuosity (bulk diffusion resistance) is often assumed to explain this behavior.
The voltage drop due to the mass transport limitations can be expressed as:
l i i F RT V ln 1
2 (Equation 28)
where iLis postulated to be the limiting current density at which the fuel is used up at
a rate equal to its maximum supply speed. The current density cannot rise above this value because the fuel gas cannot be supplied at a greater rate.
1Fuel Cell Handbook, 7thedition, US Department of Energy (2004) 2S.C. Singhal,Solid State Ionics, 152-153 (2002) 405-410
3
W.R. Grove,Philos. Mag., 14, (1839) 127-30
4W.R. Grove,phi. Mag., ser3., 21 (1843) 417
5L. Mond, C. Langer,Proc. R. Soc. London.,46 (1889) 296 6N.Q. Minh,J. Am. Ceram. Soc., 76 (1993) 563-588 7
R.J. Kee, H. Zhu, D.G. Goodwin,Proceeding of the combustion institute, 30 (2005) 2379-2404
8W. Nernst,Z.Electrochem., 6, (1899), 41
9E. Baur and H.Z. Preis, Über Brennstoff-ketten mit FestLeitern,Z. Electrochem., 43, (1937)727-32 10J.B. Goodenough,Annual review of materials research, 33 (2003) 91-128
11
S.J. Skinner, J.A. Kilner,mater. Today, 6 (2003) 30-37
12N.Q. Minh,J. Am. Ceram. Soc., 76 (1993) 563-588 13M. Ormerod,Chem. Soc. Rev., 32 (2003) 17-28 14R.Stevens,Magnesium Elektron, London, U.K., (1986) 15
.H. Etsell, S.N. Flengas,Chem. Rev., 70 (1970)
GENERAL EXPERIMENTAL TECHNIQUES
This thesis is focused on the electrochemical performance of anodes for SOFCs. The research work carried out was divided into two distinctive parts: (i) a study of impregnated functional layers using thin electrolytes and (ii) a study of ethanol/steam mixtures performance on various types of anodes using thick electrolytes. The two sets of work used different types of sample, involving different preparation methods and testing systems. Experiments have been carried out both at The University of St-Andrews and The University of Pennsylvania. However, the focus being similar for the two sets of work, the same general experimental techniques were employed.
In this chapter, the main techniques employed throughout this work are presented. Two subsequent chapters are dedicated to the description of samples preparation and testing techniques relevant to each part of the work.
Electrochemical measurements
Two types of electrochemical measurements are commonly used to characterize the performance of fuel cell samples: polarization measurements, using a DC current, and impedance measurements, using an AC current.
Polarization measurements
Figure 9: Typical IV curve for a fuel cell1.
Impedance measurements
Impedance spectroscopy is a powerful tool in the analysis of solid-state systems. Like resistance, impedance is a measure of the ability of a circuit to resist to the flow of electrical current. Electrochemical impedance is usually measured by using an AC excitation voltage at different frequencies. The perturbation signal is applied to the electrochemical cell under consideration and the current response is measured.
The perturbation signal, expressed as a function of time (t) has the general form:
t Et
E( ) 0 cos
The excitation signal used is small in amplitude, which allows the cell’s response to be pseudo-linear. In linear or pseudo-linear systems, the current response to a sinusoidal perturbation will be a sinusoid featuring the same frequency but a different amplitude and a phase shift. The impedance is therefore expressed in terms of a magnitude, Z0, and a phase shift, φ and is given by:
cos sin
0 0 0
0
I V e I e V I V
Z j t
t j
The information on the impedance is obtained by reading the amplitude and the phase shift of the response current at a given frequency. A large frequency range is swept during a measurement, starting at high frequencies. Indeed, the different processes occurring in the system and contributing to the cell impedance feature different relaxation times. Hence, each of them will respond to the perturbation at a certain frequency.
Figure 10: example of a Nyquist plot.
Such a measurement provides valuable information on the cell performance. The intercept of the impedance curve with the real axis at low frequencies provides the total cell resistance. Additionally, impedance measurements provide information on the ohmic and non ohmic contributions to the total cell resistance. The total ohmic resistance, which encompasses all conduction resistances, is given by the intercept of the curve with the real axis at high frequency. The balance to the total resistance corresponds to the total of the non ohmic losses in the cell. An impedance curve will typically show more than one arc, typically between 2 and 4.
Another common representation method is the “Bode plot”. The impedance is plotted with log frequency on the x-axis and both the absolute value of the impedance and phase shift on the y-axis, as shown on Figure 11.
Figure 11: Bode representation of an impedance measurement.
secondary electron detector, was used to perform SEM studies of the fabricated SOFC anodes. An EDX system attached to the SEM was used to perform elemental analysis of electrodes.
1
PART II
REVIEW OF ANODE MATERIALS FOR
SOLID OXIDE FUEL CELLS
This chapter reviews the different materials that have been investigated and used as SOFC anodes. The development and optimization of anode materials has been for many years, and remains today, an active and highly important concern within the SOFC research and development community. Those efforts have been reviewed in many articles published over the past few years12345, showing the intensity of the research dedicated to anodes since Minh’s review of the SOFC technology in the mid 90’s6.
The standard anode material used in SOFC is the Ni/YSZ cermet. Those cermets have been extensively studied and their performance optimized. Despite being used in most SOFC applications, they suffer from a few significant limitations. A severe limitation is their inability to operate on hydrocarbons, with the possible exception of methane diluted in large amount of steam. The ability to utilize directly practical fuels would greatly accelerate SOFCs commercialization. Hence, alternative anode materials are being developed to overcome Ni/YSZ cermets limitations and enable the direct use of hydrocarbons.
Anode materials are required to fulfill a number of requirements that have been specified in the introduction. As the main one, any anode has to be electronically conductive, and therefore contain a significant amount of an electronic conductive phase. This requirement precludes the use of precious metals for obvious economic reasons. Moreover, the high temperatures needed in an SOFC preclude the use of low-melting metals2.
In the earliest SOFC developments, investigations have focused on single phase materials such as graphite, iron oxide, platinum group and transition metals7,8. Unfortunately, all-metal anodes have not found acceptance due to specific problems encountered for each of metal, which have been summarized in a recent review 2. Graphite is corroded electrochemically and platinum spalls off in service, presumably due to water-vapour evolution at the metal oxide interface. As for the transition metals, iron is no longer protected by the reducing activity of the fuel gas once the partial pressures of oxidation products in the anode compartment of an operating cell exceed a critical value, and it then corrodes with formation of a red iron oxide. Cobalt is somewhat more stable, but also more costly. Nickel has a significant thermal expansion mismatch to stabilized zirconia, and at high temperatures the metal aggregates by grain growth, finally obstructing the porosity of the anode and eliminating the three-phase boundaries required for cell operation.
3.1. Ni-YSZ cermets
all-metal anodes9. Ni constitutes the best transition metal option but all-nickel anodes suffer from two major drawbacks. First, Ni has a significant thermal expansion mismatch to stabilized zirconia, which can result in large stresses at the anode-electrolyte bound, causing cracking or delaminating during fabrication and operation10. Second, at high temperatures, the metal aggregates by grain growth finally obstructing the porosity of the anode and eliminating the three-phase boundaries required for cell operation. To address those two problems, Spacil associated, in the anode, nickel with the stabilised zirconia ceramic material of the electrolyte. YSZ acts as an inhibitor for the coarsening of Ni powders during both consolidation and operation, and therefore retains the dispersion of metal particles and the porosity of anode during long-term operation. Furthermore, the introduction of YSZ in the anode provides an anode thermal expansion coefficient acceptably close to those of other cell components. Indeed, the thermal expansion coefficient of nickel/YSZ cermet increases linearly with the nickel content3.
Besides its structural functionality, YSZ offers a significant part of ionic contribution to the overall conductivity, thus effectively broadening the TPB length. Nickel serves as an excellent reforming catalyst and electrocatalyst for electrochemical oxidation of hydrogen. It also provides predominant electronic conductivity for the anode. Those cermets are chemically stable in reducing atmospheres at high temperatures. Ni and YSZ are essentially immiscible in each other and non-reactive over a wide range of temperature. More importantly, the intrinsic charge transfer resistance that is associated with the electrocatalytic activity at Ni/YSZ boundary is low3.
Ni-YSZ cermets are currently the most common anode material for SOFC applications. A considerable amount of work has been dedicated to Ni-YSZ cermets optimization since the patent of Spacil, as detailed in many reviews addressing anode materials1,2,3,4,5. The optimization of Ni/YSZ cermets is achieved through the
Figure 12: Image of a Ni/YSZ cermet by optical and scanning electron microscopy with elemental mapping. (A) Reverse-contrast optical micrograph, nickel distribution (dark); (b) Scanning electron microscope (SEM) of overall cermet morphology; (c) SEM after etching showing zirconia structural skeleton11.
3.1.1.
FabricationThe non-reactivity and immiscibility of Ni and YSZ enable the preparation of cermets via conventional sintering. Nickel Oxide (NiO) and YSZ powders are homogenized by mechanical milling and mixing. The NiO/YSZ ink is then applied onto the electrolyte and sintered to form a porous cermet electrode. A general route for the preparation of Ni/YSZ cermets is shown on Figure 13.
Figure 13: A general route for the preparation of Ni/YSZ cermet anodes based on conventional ceramics methods4.
Limitations of the fabrication processes based on the conventional ceramic powder mixing process comes from the difficulties in achieving optimum phase distribution between Ni and YSZ particles. Several techniques have been developed to achieve better distribution between Ni and YSZ for the preparation of cermet anodes. The most notable one was based on electrochemical vapor deposition (EVD) developed by Westinghouse13. The anode is fabricated by slurry coating of nickel and YSZ incorporated into the Ni skeleton structure by EVD method. The morphology of YSZ intergrowth restricts grain growth and sintering of Ni particles and provides an effective pathway for oxygen ions from YSZ electrolyte to Ni phase. Other deposition techniques reported include sputtering14, chemical vapor deposition (CVD)15, a combined EVD/CVD process15, polarized electrochemical vapor deposition (PEVD)
1617
.
3.1.2.
Starting powderFigure 14: Particle size distribution of as-received commercial NiO powders. The particle size distribution was measured by laser scattering method18.
Difference in the powder characteristics has a significant effect on the sintering behavior. Tietz et al. 19 evaluated eight different commercial NiO powders. The average grain size varied greatly from 0.5 to 14.7m with BET surface area from 0.2 to 47 m2/g. Consequently, the sintering behavior differed significantly. The shrinkage of NiO powder ranged from 12 to 27 %. In general, high surface area corresponds to a high shrinkage and low starting sintering temperature. Similarly, the characteristics of the powder also vary considerably for commercial YSZ powders.
In the conventional powder mixing process, electrode performance is found to be affected by the initial particle size of YSZ and NiO powders. Hitika20showed that the electrochemical performance of Ni/8YSZ cermet anodes is related to the particle size ratio of the starting oxide powders. The minimum anode overpotential losses were obtained at initial 8YSZ/NiO particle size ratio of ~0.01. Murakami et al. 21 showed that YSZ particle size not only affects the electrode performance but also the stability and the volume concentration for the cermet. The larger the YSZ size is, the higher the YSZ content in the cermet will be required to achieve the best performance. The best performance was observed on the Ni/YSZ cermet anodes prepared from starting YSZ and NiO powders with particle size of 0.5 and 2.5 m respectively, which corresponds to a particle size ratio of ~0.2. The results of those two studies are quite different but indicate that small YSZ/NiO ratios are preferred.
This impact of the starting powders characteristics on performance also means that comparison of results from different studies has to be proceeded carefully.
3.1.3.
Sintering temperatureto the sintering temperatures of the anode. Jiang22 has studied the effect of the sintering temperature. It appears that the lowest electrode ohmic and polarization resistance were observed for cermet anodes sintered at the highest temperatures, as seen from Figure 15. However, it was concluded from this study that 1400C was the optimum sintering temperatures for those conditions. This corresponds to the formation of good YSZ-to-YSZ network for the anodes sintered at high temperature. Figure 16 shows the SEM pictures of Ni/YSZ cermet electrodes sintered at different temperatures after fuel cell testing23.
Figure 16: SEM pictures of Ni (50vol. %)/8YSZ(50 vol. %) cermet anodes sintered at (a) 1300 ºC, (b) 1350 ºC, (c) 1400ºC, (d) 1500ºC, after fuel cell testing23.
These SEM pictures clearly show that applying higher sintering temperatures will generate bigger grains.
Another point worth noting is that high sintering temperature is essential to create a good bonding between the YSZ phase in the cermet and the YSZ electrolyte
.
Fuiki et al 24, studying anodes prepared by spray pyrolysis, noticed the same type of behavior, i.e. a decrease of electrode ohmic resistance and anode overpotential with increasing sintering temperature. The best performance was observed for anodes sintered at 1350C. A similar effect has been observed by Primdahl et al.25. Kawada et al.26have noted 1800 K as the optimum sintering temperature, with a precalcination step at 1700K.
The sintering process will affect the porosity of the cermet. Studying the sintering conditions that give the desired porosity for the cermet, Lee et al.27 obtained the best porosities with two different sintering conditions: (1400 degrees, 3 hours and 1500 degrees, 30 mins). However, it was stated in this work that 1400 C was the best option due to concerns over the compositional variation due to evaporation of NiO at 1500C.
with the sintering temperature, the sintering time appears to be an important parameter.
3.1.4.
Electrical conductivityThe electrical conductivity of nickel/YSZ cermet is strongly dependent on its nickel content and a minimum metal proportion in the cermet is required for continuity of electronic conduction, whereas zirconia particles may be non continuous. Dees et al.
28
studied the relationship between the electrical conductivity and the volume fraction of Ni in the Ni/YSZ cermet measured at 1000C. The conductivity of the cermet as a function of nickel content shows the S-shaped curved dictated by percolation theory, as depicted in Figure 17. The percolation threshold for the conductivity, which corresponds to the rapid rise in the electrical conductivity, is about 30 vol. % nickel.
Figure 17 clearly shows that the percolation threshold depends on the sintering temperature. Increasing the sintering temperature results in lower percolation threshold, which might be due to the decreased porosity as well as narrowed pore size distribution.
Figure 17: Conductivity of nickel/ZrO2cermet as a function of nickel content (T=1000°C)28.
of raw powders as well as contiguity. The electrical behavior of Ni/YSZ cermet is therefore strong function of these factors2930.It was noted that larger Ni particles give rise to larger threshold31.
The conductivity is dependent on its microstructure (support surface area). At the same nickel volume percent, a support with lower surface area has a better nickel coverage, resulting in improved nickel particle to particle contact, thus higher conductivity for the cermet4.
The electrical conductivity of Ni/YSZ anodes is also dependent on the particle size and particle size distribution, as for the conductivity threshold. Tietz et al.32 studied the electrical conductivity of the Ni/YSZ cermet anodes prepared from different commercial NiO powders. The electrical conductivity measured at 800 C varies between 300 S cm-1 to 4000 S.cm-1 with the highest conductivity obtained on NiO powder with small grain size. Tintinelli et al. 33 have shown that the electrical conductivity increases with the YSZ/NiO ratio. Additionally, a broader size spectrum of YSZ powders shows improved packing efficiency, and hence enhanced electrical conductivity. However, coarse YSZ particles seem not to be recommended. Indeed, they are more likely to show large shrinkage, which can potentially cause macro cracks and rapid degradation of the cell 34. From an electrocatalyst point of view, another likely consequence of using coarse YSZ powder is the decline in TPB area, thus driving up the activation polarization. The conductivity of the cermet is also dependent on its microstructure (support surface area). At the same nickel volume percent, a support with lower surface area has a better nickel coverage, resulting in improved nickel particle to particle contact, thus higher conductivity for the cermet4.
As a compromise, in order to achieve a high conductivity and hence an excellent cell performance along with a low overall cell shrinkage, a novel conceptual microstructure that is composed of coarse YSZ, fine YSZ and NiO has been proposed35. Even with a fixed overall YSZ concentration (60% vol.), the electrical conductivity is found to be profoundly altered as a function of coarse YSZ content as illustrated in Figure 18.
Figure 18: Electrical conductivity measured at 1000°C of Ni/YSZ cermet containing both coarse and fine YSZ
particles as a function of coarse YSZ content of total YSZ35
.