Open Access
Research article
Genome-wide expression profiling of
in vivo-
derived bloodstream
parasite stages and dynamic analysis of mRNA alterations during
synchronous differentiation in
Trypanosoma brucei
Sarah Kabani
1, Katelyn Fenn
1, Alan Ross
2, Al Ivens
3, Terry K Smith
4,
Peter Ghazal
2and Keith Matthews*
1Address: 1Centre for Immunity, Infection and Evolution, Institute of Immunology and Infection Research, School of Biological Sciences, King's
Buildings, University of Edinburgh, Edinburgh, UK, 2Division of Pathway Medicine, University of Edinburgh Medical School, Chancellor's
building, University of Edinburgh, Edinburgh, UK, 3Fios Genomics Ltd, ETTC, King's buildings, Edinburgh, UK and 4Centre for Biomolecular
Sciences, The North Haugh, St Andrews University, UK
Email: Sarah Kabani - S.Kabani@sms.ed.ac.uk; Katelyn Fenn - k.fenn@ed.ac.uk; Alan Ross - alan.j.ross@ed.ac.uk; Al Ivens - alicat@fiosgenomics.co.uk; Terry K Smith - tks1@st-andrews.ac.uk; Peter Ghazal - P.Ghazal@ed.ac.uk; Keith Matthews* - keith.matthews@ed.ac.uk
* Corresponding author
Abstract
Background: Trypanosomes undergo extensive developmental changes during their complex life cycle. Crucial among these is the transition between slender and stumpy bloodstream forms and, thereafter, the differentiation from stumpy to tsetse-midgut procyclic forms. These developmental events are highly regulated, temporally reproducible and accompanied by expression changes mediated almost exclusively at the post-transcriptional level.
Results: In this study we have examined, by whole-genome microarray analysis, the mRNA abundance of genes in slender and stumpy forms of T.brucei AnTat1.1 cells, and also during their synchronous differentiation to procyclic forms. In total, five biological replicates representing the differentiation of matched parasite populations derived from five individual mouse infections were assayed, with RNAs being derived at key biological time points during the time course of their synchronous differentiation to procyclic forms. Importantly, the biological context of these mRNA profiles was established by assaying the coincident cellular events in each population (surface antigen exchange, morphological restructuring, cell cycle re-entry), thereby linking the observed gene expression changes to the well-established framework of trypanosome differentiation. Conclusion: Using stringent statistical analysis and validation of the derived profiles against experimentally-predicted gene expression and phenotypic changes, we have established the profile of regulated gene expression during these important life-cycle transitions. The highly synchronous nature of differentiation between stumpy and procyclic forms also means that these studies of mRNA profiles are directly relevant to the changes in mRNA abundance within individual cells during this well-characterised developmental transition.
Published: 11 September 2009
BMC Genomics 2009, 10:427 doi:10.1186/1471-2164-10-427
Received: 21 April 2009 Accepted: 11 September 2009
This article is available from: http://www.biomedcentral.com/1471-2164/10/427
© 2009 Kabani et al; licensee BioMed Central Ltd.
Background
Gene expression analyses have proved useful for dissect-ing the basis of the changes that occur as cells and organ-isms transition between distinct cell types [1-3], developmental stages [4-6] or progress into disease states [7,8]. In many cases, these reflect the regulated activity of gene promoters, or altered stability of mature mRNAs, the integral of these resulting in measurable changes in the steady-state abundance for particular mRNAs. The relative contribution of these two components (regulated synthe-sis, vs. regulated turnover) to changes in the overall tran-scriptome of a cell varies, although regulated promoter activity has received most attention particularly in the context of development processes and differentiation events [9-11].
In one group of organisms, the balance between mRNA synthesis and turnover shows an extreme emphasis toward regulated mRNA stability. These are kinetoplastid parasites, responsible for an array of diseases in the tropics of medical and veterinary importance [12]. In these organisms, among the most evolutionarily divergent eukaryotes for which there is significant molecular infor-mation [13], the contribution of RNA polymerase II pro-moter activity to regulated gene expression is unimportant [14]. Instead, their genome is organised into long polycis-tronic transcription units in which genes are co-tran-scribed [15], primary transcripts being resolved into mRNAs by concerted trans-splicing and polyadenylation reactions [16]. These depend on identifiable RNA process-ing signals within intergenic regions such that the RNA processing reactions of adjacent genes are mechanistically coupled [17,18]. This arrangement dictates that RNA processing is not a primary regulator of differential expres-sion, since neighbouring genes within a transcription unit often exhibit distinct expression profiles. Hence, regulated mRNA stability is a major contributor to differential mRNA abundance, although regulated protein synthesis, modification and turnover are clearly major additional contributors to regulated gene expression [19,20].
Although almost exclusively post-transcriptional, differ-ential gene expression is of key importance in kineto-plastid parasites since they undergo complex life-cycles involving transmission between mammalian hosts by arthropod vectors [21,22]. A good model for such devel-opmental transitions is provided by the African trypano-some, Trypanosoma brucei. When in the mammalian bloodstream, African trypanosomes exhibit waves of par-asitaemia caused by the successive expression of distinct surface antigens by individual 'antigenic variants', these being periodically recognised and destroyed by the host immune response [23]. Superimposed on this cyclical infection profile is a developmental transition induced by quorum-sensing, in which cell-density induces the
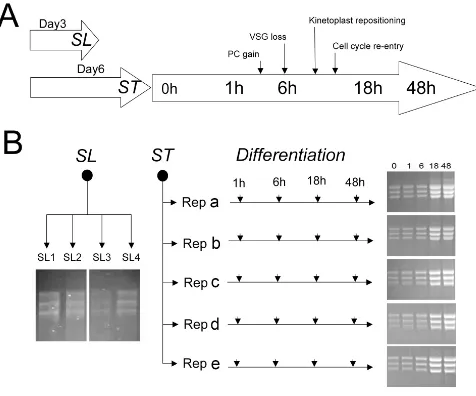
transi-tion to 'stumpy forms' [24,25]. These differ from the pro-liferative bloodstream 'slender forms' in that they exhibit cell-cycle arrest in G1/G0 [26], altered morphology [27], and some pre-adaptations for transmission to the tsetse fly such as the up regulation of certain mitochondrial activities [28], and enhanced resistance to protease attack [29] and pH stress [30]. An attractive feature of this devel-opmental step is that stumpy forms accumulate to near homogeneity at the peak of each wave of parasitaemia and can be induced to undergo efficient differentiation to the next life-cycle stage, procyclic forms, if harvested from blood and incubated in culture media at 27°C containing citrate/cis-aconitate (CCA) [31-33]. Importantly, this dif-ferentiation is almost completely synchronous in the pop-ulation allowing events at the individual cell level to be inferred from events occurring at the population level. Moreover, the developmental events of differentiation are reproducible and well characterised such that the progress of cells through differentiation can be accurately moni-tored [34]. These changes include gain of the procyclic stage-specific coat, comprising procyclins, at 2 h through differentiation, loss of the bloodstream stage-specific var-iant surface glycoprotein (VSG) coat around 4-7 h [33] and repositioning of the parasite's unusual mitochondrial genome (kinetoplast) between 8 and 14 h through differ-entiation [35]. Coincident with these changes the cells re-enter into a proliferative cell-cycle, with progression through S-phase occurring between 8 and 12 h [33,36]. Further developmental changes occur after 18 h entailing cell proliferation and metabolic adaptation although these are less synchronous in the population. The general schema of cytological events associated with trypanosome differentiation is presented in Figure 1A.
Results
Biological sample generation and validation
The biological characteristics of trypanosomes grown in culture likely differ significantly from those in the mam-malian bloodstream [38]. Therefore, to generate samples of closest relevance to the in vivo situation, slender and stumpy forms were derived from infections in mice. Importantly, our analyses used pleomorphic slender forms, which remain able to generate stumpy forms,
unlike previous analyses, which have used laboratory-adapted mutants (monomorphs), which are unable to undergo appropriate growth control either in vivo or in vitro [37,38]. Since the transition to stumpy forms is induced above ~5 × 10⁷ trypanosomes/ml, pleomorphic slender forms were harvested at day 3 post-infection and at 2 × 10⁷/ml, a cell density at which no morphologically stumpy forms could be detected. Identical populations were also harvested from mice at day 6 post-infection
[image:3.612.71.547.94.490.2]Schema for the study
Figure 1
when the population density was at >2 × 10⁸/ml (the der-ivation of slender and stumpy forms is summarised in Fig-ure 1A). In these samples, the parasites were overwhelmingly stumpy (>80%) as assessed by morpho-logical criteria. Samples representing the differentiation to procyclic forms were also generated from the same para-site populations that were used to generate stumpy forms. Stumpy forms were purified from host blood by DE52 chromatography [39] at 37°C and then incubated for 1 h at 37°C in HMI-9 [40] to allow the cells to recover from the purification process, this providing the starting mate-rial for expression analyses during their differentiation to procyclic forms. Aliquots were harvested to generate stumpy form mRNA and, thereafter, cells were transferred to SDM-79 medium containing 6 mM cis-aconitate and 10 mM glycerol, thus initiating differentiation. Further RNA samples were then isolated at 1 h, 6 h, 18 h, and 48 h after the addition of cis-aconitate, these time points being selected to allow correlation with the major cytolog-ical events of differentiation (induction of procyclin cell surface proteins at 1-2 h, VSG loss around 6 h, the gener-ation of early proliferative procyclic forms at 18 h, and more established procyclic forms at 48 h). [41] (Figure 1A). In total four biological replicates of pleomorphic slender cells, 5 biological replicates of stumpy forms and the 5 differentiating populations were isolated (Figure 1B). In each case, total mRNA was purified and its integ-rity validated both by visualisation on ethidium bromide stained formaldehyde gels (Figure 1B) and via an Agilent RNA 6000 Nano chip using a 2100 Agilent bioanalyser (data not shown).
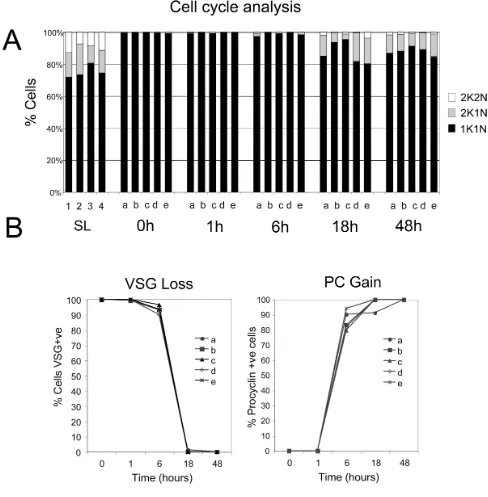
To validate the biological integrity of the material used to generate the mRNAs for array analysis, the trypanosome source material was analysed for their expression of a number of diagnostic cytological markers for develop-ment. Firstly, the samples were assayed for cell-cycle pro-gression, this allowing quantitative distinction between proliferative slender and non-proliferative stumpy forms (Figure 2A). In trypanosomes, distinct cell-cycle stages can be distinguished by the co-ordinated replication, and seg-regation, of the single copy DNA-containing organelles, the nucleus and kinetoplast [42]. Thus cells in G1 (and G0) and S phase exhibit 1 nucleus and 1 kinetoplast (1K1N) whereas G2 phase cells are 2K1N and post mitotic cells are 2K2N. Comparison of the distinct slender and stumpy populations demonstrated that the pleomorphic slender cells were predominantly in the 1K1N configura-tion (72-81%), but that ~15% (10-19%) of cells were 2K1N and ~10% (7-13%) of cells 2K2N, these values being consistent with the expected profile for proliferative trypanosome populations. In contrast, the stumpy cell populations were enriched for cells in G1/G0 with less than 1% of cells in configurations other than 1K1N (Fig-ure 2A). This, combined with our morphological analysis,
confirmed that highly enriched stumpy populations had been generated for each bio-replicate.
Once differentiation is initiated, stumpy cells re-enter into a proliferative cell-cycle with relative synchrony [33]. Although the first morphological event in cell-cycle pro-gression had not occurred in the replicate populations by 1 h or 6 h after the initiation of differentiation, at 18 h cells were seen to be in G2 (2K1N; 3-18%) or in the mitotic/post mitotic phase (2K2N; 0.5-4%), with similar proportions seen at 48 h. This indicated that the cells had progressed from cycle arrest into a proliferative cell-cycle during the time course of differentiation.
In addition to cell-cycle progression the differentiating cells were also assayed for their expression of the stage-specific surface antigens, VSG (expressed on bloodstream forms) and EP procyclin (induced during differentiation and expressed on procyclic forms) (Figure 2B). Matching a normal profile of differentiation, both slender and stumpy bloodstream populations expressed the AnTat1.1 VSG, as did cells during the first 6 h of differentiation. However, thereafter, VSG was no longer detected except-ing on a small number of undifferentiated cells, these rep-resenting the small proportion of proliferative slender cells present in the stumpy-enriched population [33]. The expression of EP procyclin differed from VSG during dif-ferentiation, such that it was already detectable 1 h after the addition of cis-aconitate, although this was relatively weak and restricted to the flagellar pocket region. By 6 h however, when the cells retained VSG, EP procyclin was strongly expressed over the cell surface of the differentiat-ing parasites (79-94%) and this was retained in the 18 h and 48 h samples, as expected.
The final measure we used to monitor the progression of cells through differentiation was repositioning of the mitochondrial genome. During trypanosome differentia-tion, the kinetoplast is relocated from the extreme poste-rior of bloodstream form cells to midway between the cell nucleus and cell posterior in procyclic forms [35]. Analy-sis of 100 cells from each time point of one complete dif-ferentiation series (bio-replicate a) demonstrated that kinetoplast repositioning had initiated after 6 h, with this then continuing until 18 h, when the kinetoplast-poste-rior dimension had increased from ~1 μm to ~4 μm (Fig-ure 3A). Analysis of the kinetoplast-posterior dimension of 100 cells in each of the remaining four bio-replicates at 1 h and 6 h confirmed that all the samples used for expres-sion analysis repositioned their kinetoplast on approxi-mately the same timescale, with the initiation of differentiation being detected by 6 h (Figure 3B).
Cell cycle and surface antigen analysis during differentiation
Figure 2
Kinetoplast repositioning during differentiation
Figure 3
profile of mRNAs from each of the derived samples. Most significantly, the 5 biological replicates of the populations undergoing differentiation from stumpy to procyclic forms underwent differentiation with reproducible kinet-ics despite their derivation from 5 independent rodent infections and differentiation assays. Hence, the derived material provided a robust and biologically relevant data-set for the analysis of mRNAs regulated during the associ-ated differentiation events.
Microarray expression profiling of the trypanosome cells in different life-cycle forms or stages of development
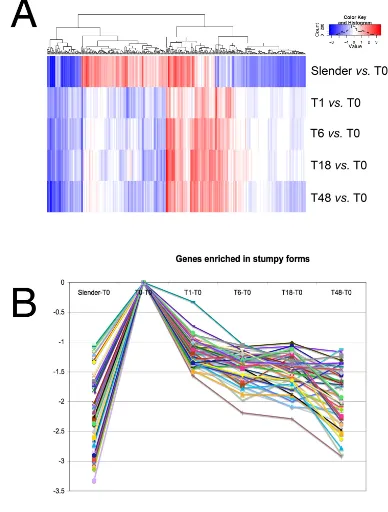
In total, 29 RNA samples were generated (5 biological licates of stumpy, 1 h, 6 h, 18 h and 48 h; 4 biological rep-licates of slender) and hybridized to JCVI Trypanosoma brucei v3 arrays, comprising 19,200 features representing 8,801 different loci, of which 8,300 were T. brucei genes. The resulting hybridization profiles were assessed pre-and post-quantile normalization pre-and from this analysis four arrays were identified as being standard and sub-sequently removed from the analysis. Thereafter, a design matrix was established in order to describe the array hybridizations with respect to the sample time point, with bio-replicates being combined to generate group compar-isons. In total 12 group comparisons were generated, detailing 'slender compared to all others', 'stumpy com-pared to all others' in addition to comparisons through a moving window throughout the differentiation time course (i.e. T1 vs. T6, T6 vs. T18 and T18 vs. T48). For these analyses, normalised data were linear model fitted and Empirical Bayesian analysis, coupled with p value adjust-ment, performed (full comparison data is available in Additional file 1 and Additional file 2). From the resulting comparisons, a total of 407 genes were identified which exhibited at least 2-fold change in at least one compari-son, with an associated p value of <0.001 (Additional file 3 shows the expression profile of this 407 gene set; the expression profile of all genes irrespective of their signifi-cance is also included in the same folder). From the 407 gene set, it was clear that the distinctions between slender and all other samples were greater than the distinctions between the samples derived from within the differentia-tion time course (Figure 4). This was not surprising for two reasons. Firstly, the distinct time-points from the dif-ferentiation samples were biologically linked, such that each time point sample from each bio-replicate was derived from a common progenitor (see Figure 1B). Hence the variation within these sample series is expected to be relatively low compared with comparisons from independent samples. Secondly, stumpy cells had already undergone significant changes in expression compared to slender cells, likely reflecting their pre-adaptations for dif-ferentiation and possible embarkation on some aspects of the differentiation programme during their isolation and purification from blood. Although the purification from
blood was carried out rapidly at 37°C, stresses resulting from the isolation procedures could have induced these early changes in expression. Hence, both stumpy-enriched and early procyclic form transcripts would be expected in these 'stumpy' mRNA profiles.
Analyses of transcripts up-regulated in stumpy cells
Using a stringent threshold of an adjusted P value of < 0.05 for comparison, 42 genes were scored as up-regu-lated and 41 were scored as down-reguup-regu-lated when com-paring stumpy forms with slender forms (Additional file 4). At a slightly reduced stringency of an adjusted P value of < 0.1, 96 genes were scored as 'up in slender' whereas 190 genes were 'up in stumpy' (Additional file 4). Consist-ent with expectation, slender cells expressed significantly more ESAG transcripts (ESAG2, ESAG11, ESAG5) reflec-tive of the down-regulation of VSG expression site tran-scription in stumpy forms [43]. Also, histone transcripts (histone H2, H3, H4) and an HMG protein (Tb927.3.3490), were elevated in slender forms as were mRNAs for structural components of the cell (e.g. PFR1, PFR2, beta-tubulin) and components of the translational apparatus (Tb927.8.5880, Tb11.01.5720, Tb11.02.4050, Tb927.5.1610). These changes reflect the proliferative sta-tus of slender forms compared to the cellular quiescence of stumpy cells [44]. The metabolism of slender forms was also represented by the enrichment of the bloodstream form glucose transporter THT1 (Tb10.6k15.2040) [45], aldolase [46] and PGKC (Tb927.1.700) [47].
citrate/cis-Expression profiles of genes at different time points in the analysis
Figure 4
aconitate mediated differentiation in stumpy forms para-sites under cold shock conditions [51]. The absence of PAD1 (Tb927.7.5930), recently identified as being up-regulated in stumpy forms at the mRNA and protein level [51], reflects the stringency of the threshold used, with this gene being detected, along with PAD 6 (Tb927.7.5980) and PAD8 (Tb927.7.6000) when the slightly reduced stringency was applied (adj P value < 0.1) (Additional file 4).
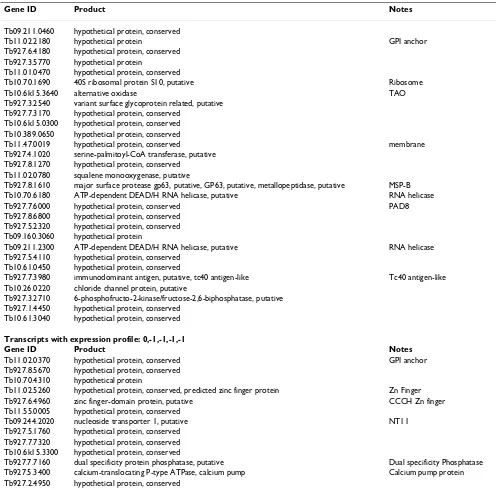
The presence of abundant procyclin and procyclic-enriched mRNAs in the stumpy form mRNA samples indi-cated that either these cells exhibit pre-adaptation for dif-ferentiation at the mRNA level, or that some of these mRNAs were rapidly induced during the parasite isolation procedures. Therefore, to identify transcripts likely to be enriched in stumpy forms, transcript expression profiles from all time points were assigned to a trinary scoring sys-tem, where transcript levels were expressed relative to their level in stumpy forms. Hence, transcripts with no sig-nificant change (less than 2-fold change, P > 0.05) would be annotated 0,0,0,0,0 (1 h vs. ST, 6 h vs. ST, 18 h vs. ST, 48 h vs. ST, SL vs. ST,) whereas transcripts up-regulated in stumpy forms (>2-fold change, p < 0.05) with respect to all other time points would be annotated -1, -1, -1, -1, -1. This group, along with transcripts also elevated at t = 1 h (0, -1, -1, -1, -1), was assigned as "stumpy -enriched" and comprised a total of 65 genes. The full list of these genes is available in Additional file 5, and those predicted to encode functional proteins are summarised in Table 1. The predicted stumpy-specific group comprised mRNAs encoding two RNA helicases (Tb10.70.6180, Tb09.211.2300), an additional chloride ion channel pro-tein (Tb10.26.0220), a PAD member (Tb927.7.6000; PAD8), enzymes involved in membrane sphingolipid (Tb927.4.1020; a putative serine-palmitoyl-CoA trans-ferase) and sterol biosynthesis (Tb11.02.0780; a putative squalene monooxygenase) and the metabolic enzymes trypanosome alternative oxidase and fructose-2, 6-biphosphatase. The enzyme MSP-B, elevated early in dif-ferentiation and associated with VSG release in this proc-ess, was also elevated in the stumpy sample and through differentiation when compared with more established procyclic forms, this matching previous observations [52]. Widening the set to include transcripts elevated in stumpy cells and cells at 1 h, included two zinc-finger proteins, one of the CCCH class (Tb927.6.4960), members of which have previously been demonstrated to be impor-tant in differentiation control [53-56]. In common with these proteins, Tb927.6.4960 has only a single CCCH domain, which has closest similarity to members of the OMA family of proteins involved in C.elegans oocyte mat-uration [57]. Other proteins included a dual specificity phosphatase (Tb927.7.7160), a calcium pump protein
(Tb927.5.3400) and a recently characterised nucleobase transporter (Tb09.244.2020; NT11 [58]).
In addition to those known genes, or genes for proteins with predicted function, were a group of genes of no pre-dicted function, being annotated hypothetical unlikely. This group, comprising 25% of the stumpy-enriched mRNA representatives (Additional file 5), were unex-pected and among the transcripts most highly enriched in stumpy forms when compared to slender forms. These genes were frequently small, or positioned on the oppo-site strand to the predicted polycistronic transcription unit. The presence of these transcripts may represent dys-regulated control of genome expression in quiescent stumpy forms, non-specific transcriptional noise or a hitherto unrecognised feature of gene expression or regu-lation in trypanosomes.
Phenotypic correlation of transcript profiles
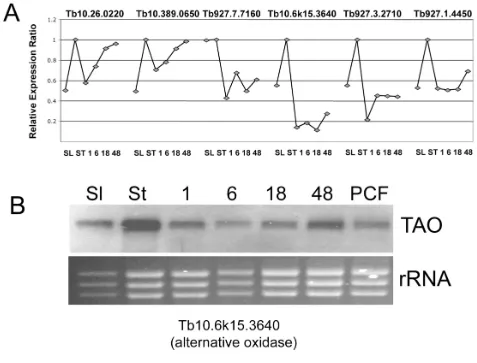
To assess the validity of the observed expression profiles for stumpy elevated transcripts, a subset of 6 genes from the 'stumpy-enriched' (-1, -1, -1, -1, -1) trinary group and a control transcript (Tb10.389.0540), which was well expressed but had low standard deviation across all time points, were evaluated by qRT-PCR against the mRNA samples used to hybridize to the array replicates. Figure 5A demonstrates that each transcript observed to be up-regulated in stumpy forms by microarray was confirmed as being elevated at that life-cycle stage by qRT-PCR, although the anticipated expression levels did not pre-cisely correspond with the array profile. In addition, anal-ysis of one transcript predicted to be stumpy-enriched (TAO) was confirmed by northern blotting (Figure 5B). However, four other transcripts (Tb10.70.6180, Tb927.5.3400, Tb927.8.1270, Tb927.7.3170) analysed by qRT-PCR did not clearly correspond to the array data. Analysis of the raw array hybridization data for these tran-scripts revealed consistent hybridization profiles between duplicate spots on individual arrays and between distinct bio-replicates, these matching the expression trends of the group normalised data. Hence, observed discrepancies may reflect the inability to precisely model array normal-isations by assays on individual mRNA samples in our val-idation experiments, differences in primer or probe recognition sites or non systematic errors.
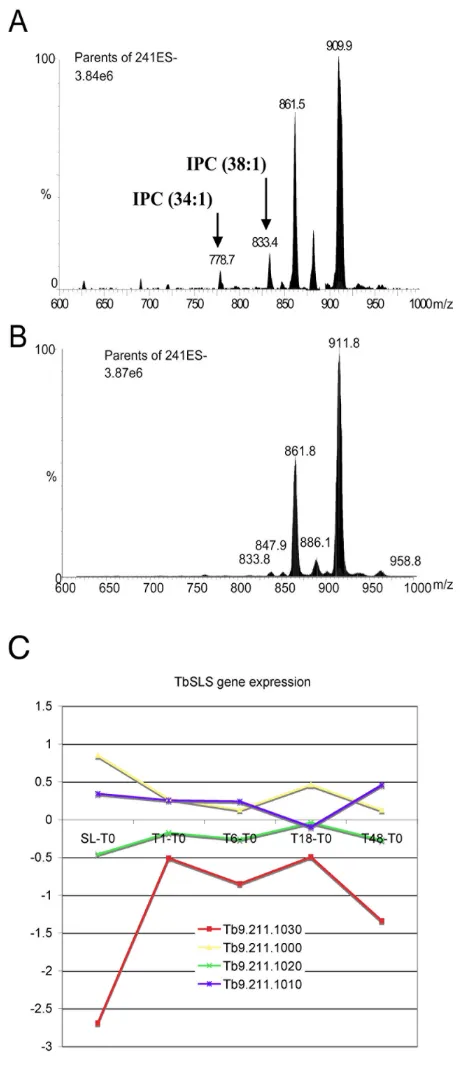
developmentally regulated, with inositol phosphocera-mide (IPC) being produced by procyclic, but not blood-stream monomorphic slender forms [48]. To determine whether Tb09.211.1030 expression correlated with the appearance of IPC in stumpy forms, monomorphic slen-der and pleomorphic stumpy T. brucei phospholipids were analysed by ESI-MS. Since comparisons of the nega-tive and posinega-tive ion survey scans showed no substantial
[image:10.612.54.550.99.589.2]differences between each cell type (data not shown), a more detailed investigation by ESI-MS-MS using parent ion scanning of individual phospholipid classes by spe-cific collision induced fragmentation was carried out [59]. This revealed that only the phosphatidylinositol (GPIno) phospholipids were different between slender and stumpy forms (compare Figures 6A and 6B), the most tell-ing of which were the peaks at 778.7 m/z and 833.4 m/z
Table 1: Transcripts with expression profile: -1,-1,-1,-1,-1
Gene ID Product Notes
Tb09.211.0460 hypothetical protein, conserved
Tb11.02.2180 hypothetical protein GPI anchor Tb927.6.4180 hypothetical protein, conserved
Tb927.3.5770 hypothetical protein
Tb11.01.0470 hypothetical protein, conserved
Tb10.70.1690 40S ribosomal protein S10, putative Ribosome Tb10.6k15.3640 alternative oxidase TAO Tb927.3.2540 variant surface glycoprotein related, putative
Tb927.7.3170 hypothetical protein, conserved Tb10.6k15.0300 hypothetical protein, conserved Tb10.389.0650 hypothetical protein, conserved
Tb11.47.0019 hypothetical protein, conserved membrane Tb927.4.1020 serine-palmitoyl-CoA transferase, putative
Tb927.8.1270 hypothetical protein, conserved Tb11.02.0780 squalene monooxygenase, putative
Tb927.8.1610 major surface protease gp63, putative, GP63, putative, metallopeptidase, putative MSP-B Tb10.70.6180 ATP-dependent DEAD/H RNA helicase, putative RNA helicase Tb927.7.6000 hypothetical protein, conserved PAD8 Tb927.8.6800 hypothetical protein, conserved
Tb927.5.2320 hypothetical protein, conserved Tb09.160.3060 hypothetical protein
Tb09.211.2300 ATP-dependent DEAD/H RNA helicase, putative RNA helicase Tb927.5.4110 hypothetical protein, conserved
Tb10.61.0450 hypothetical protein, conserved
Tb927.7.3980 immunodominant antigen, putative, tc40 antigen-like Tc40 antigen-like Tb10.26.0220 chloride channel protein, putative
Tb927.3.2710 6-phosphofructo-2-kinase/fructose-2,6-biphosphatase, putative Tb927.1.4450 hypothetical protein, conserved
Tb10.61.3040 hypothetical protein, conserved
Transcripts with expression profile: 0,-1,-1,-1,-1
Gene ID Product Notes
Tb11.02.0370 hypothetical protein, conserved GPI anchor Tb927.8.5670 hypothetical protein, conserved
Tb10.70.4310 hypothetical protein
Tb11.02.5260 hypothetical protein, conserved, predicted zinc finger protein Zn Finger Tb927.6.4960 zinc finger-domain protein, putative CCCH Zn finger Tb11.55.0005 hypothetical protein, conserved
Tb09.244.2020 nucleoside transporter 1, putative NT11 Tb927.5.1760 hypothetical protein, conserved
Tb927.7.7320 hypothetical protein, conserved Tb10.6k15.3300 hypothetical protein, conserved
Tb927.7.7160 dual specificity protein phosphatase, putative Dual specificity Phosphatase Tb927.5.3400 calcium-translocating P-type ATPase, calcium pump Calcium pump protein Tb927.2.4950 hypothetical protein, conserved
(Figure 6A). These correspond to two IPC species (C34:1 and C38:1, respectively), which were detected only in stumpy forms (Figure 6A). This demonstrates that the induction of IPC synthesis, either in stumpy forms or as a very early event in their differentiation to procyclic forms, is indeed coincident with the up-regulation of Tb09.211.1030. Interestingly, analysing the expression profile of each member of the TbSLS gene family indicated that only Tb09.211.1030 (TbSLS1) showed significant developmental up-regulation (Figure 6C). Therefore, this analysis provided a phenotypic validation of expression profiles identified by microarray analysis and also sug-gested that the developmental regulation of IPC synthesis may depend on the regulated expression of
Tb09.211.1030 (TbSLS1) rather than the activity of the other genes in this cluster. This prediction has been recently confirmed providing functional support for the expression changes we observed (Jay Bangs, University of Wisconsin, USA, personal communication).
Trends of expression during synchronous differentiation from stumpy to procyclic forms
In addition to comparisons of slender and stumpy forms, we also exploited the synchrony of differentiation between stumpy forms and procyclic forms to examine transcripts transiently regulated during the differentiation programme. Initially we analysed the expression profile of known transcripts predicted to exhibit temporal or
[image:11.612.64.541.93.456.2]differ-Validation of the microarray by alternative expression assays
Figure 5
ential regulation during the development from blood-stream to procyclic forms. This involved analysis of the expression profile of stage-specific surface proteins expressed in bloodstream and procyclic forms, markers for re-entry into a proliferative cell-cycle and transcripts associated with the differential metabolism of
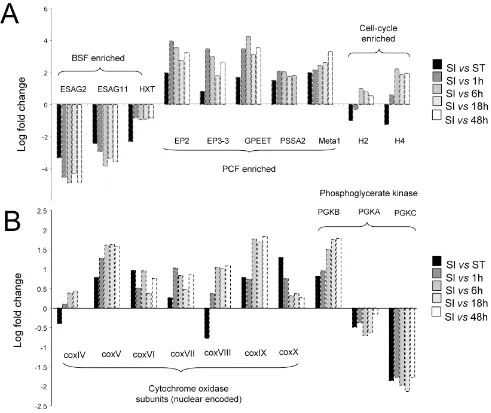
[image:12.612.60.292.173.711.2]blood-stream and procyclic forms. Figure 7 shows the expression of 20 transcripts throughout the differentiation time course, with each exhibiting the expected expression pro-file. Thus, ESAG2, ESAG11 and the glucose transporter THT1 (Tb10.6k15.2040) were rapidly and progressively down-regulated during differentiation, whereas EP2 and EP3 procyclin transcripts were up-regulated, as was PSSA2 [60] and a homologue of the Leishmania metacyclic-pro-mastigote expressed virulence protein Meta1 (Tb927.5.2160; [61]). Also, re-entry into DNA synthesis by the differentiating parasites was reflected by the induc-tion of histone mRNAs after 6 h, this immediately preced-ing detectable progression of the cells into a cell-cycle as determined in our DAPI-scoring of the parasites from which the mRNA samples were derived (Figure 2) [33]. The metabolic adaptation of the differentiating parasites was also confirmed by the differential mRNA regulation of phosphoglycerate kinase C, which was down-regulated, and the up regulation of the procyclic form specific PGKB [47]. The mRNA abundance of the constitutively expressed PGKA was not altered significantly during the differentiation programme, as expected. Finally, we assayed the mRNA expression profile of seven nuclear encoded components of the cytochrome oxidase com-plex, which are known to be induced at the mRNA level and have previously been characterised during the syn-chronous differentiation of stumpy forms to procyclic forms [62]. Confirming earlier analyses, each subunit was up-regulated during differentiation to the procyclic form, this occurring rapidly after the initiation of the process. Combined, these analyses demonstrated that the mRNAs generated from parasites undergoing synchronous differ-entiation from stumpy to procyclic forms, matched expec-tation based on known bloodstream vs. procyclic expression profiles or previous studies of synchronous dif-ferentiation between bloodstream stumpy and procyclic forms.
Figure 6
IPC expression in different life cycle stages
Figure 6
Expression changes for a subset of genes whose developmental expression profile is known
Figure 7
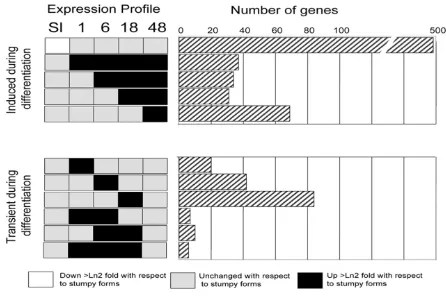
Having carried out a validation of the observed dynamic mRNA changes during differentiation from stumpy to procyclic forms, we examined the regulated mRNA popu-lations for temporally-regulated changes that were detect-able during the synchronous differentiation programme. As before, a trinary scoring system was used to identify the expression profiles of transcripts sets, which exhibited up-, or down-regulation (>2-fold changeup-, p < 0.05) at distinct time points. Of the total of 243 distinct profiles possible, 74 distinct expression profiles were detected. However, most of these differences represented distinctions between the slender and stumpy forms, and 15 of the groups contained only a single member (data not shown). Figure 8 shows a representation of eleven of the most rel-evant different expression profiles in which transcripts were up-regulated with respect to stumpy forms after 1 h, 6 h, 18 h and 48 h or were transiently up-regulated at each time point (1 h, 6 h, 18 h) or during a combination of time points (1 h and 6 h; 6 h and 18 h; 1, 6, and 18 h). A summary of these transiently regulated mRNAs is
availa-ble in Additional file 6, whereas a complete expression profile of all genes showing transiently regulated changes is provided in Additional file 7. As expected the greatest difference was between slender and stumpy forms (Figure 8). However transcript groups with distinct expression profiles during the time course of differentiation were also observed. In particular, among those transcripts tran-siently elevated during distinct phases of the differentia-tion time course were nucleoside and amino acid membrane transporters (Tb927.8.7670, Tb927.4.4000, Tb11.02.1100; each elevated at t = 1 h) and a predicted serine threonine phosphatase (Tb09.160.4460; elevated at 1 h) identified as a substrate of the differentiation regu-lator, TbPTP1 (Szöor et al., manuscript in preparation). The activation of translation early in the differentiation time course was also evidenced by the enrichment of mRNAs for two nucleolar proteins (NOP44/46 [63], ele-vated at 1 h and 6 h), a nucleolar RNA helicase (Tb927.5.4420, elevated at 1-18 h), and ribosomal com-ponents (Tb10.70.5670, EIF1α).
Dynamic expression profile changes during differentiation between stumpy and procyclic forms
Figure 8
In order to functionally classify transcripts during the dif-ferentiation events, a GO analysis of the significantly reg-ulated mRNAs was performed. Thus, transcripts significantly regulated at the P < 0.05 level were analysed across the three GO ontologies (biological process, molec-ular function, cellmolec-ular compartment) using hypergeomet-ric tests, with enhypergeomet-richment of any one GO group (P < 0.01) being scored independently for genes up and down-regu-lated in each comparison with respect to the GO-group frequency for all genes on the array. The complete list of GO assignments of those genes up- or down- regulated during differentiation from stumpy to procyclic forms is provided in Additional file 8. Analysis of those genes whose expression was temporally regulated during entiation demonstrated that upon the initiation of differ-entiation to procyclic forms (t = 1 h), transcripts associated with RNA translation, transport and regulation were rapidly enriched, whereas endonucleases were down-regulated, this matching the overall increase in mRNA abundance and protein synthesis predicted as the cells enter into the differentiation programme (Figure 1B, [64]). Within 6 h of the initiation of development to pro-cyclic forms, translation associated mRNAs (EIF4E, Tb10.61.0210) were enriched with respect to T = 1 h, as were mRNAs encoding proteins associated with DNA rep-lication (histone H2A, Tb927.7.2870; histone H2B, Tb10.406.0370; histone H4, Tb927.5.4240, histone deacetylase 2, Tb11.01.7240; a minichromosome mainte-nance protein complex subunit, Tb927.2.3930 and an HMG protein, Tb927.3.349) and structural proteins (PFRA, Tb927.3.4310; PFRB, Tb927.8.4990; flagellum calcium binding protein, Tb927.8.5460; alpha-tubulin, Tb927.1.2360 and beta-tubulin, Tb927.1.2370). These are each consistent with preparation of the differentiating cells for re-entry into the proliferative cell-cycle, which occurs at 8-10 h into the differentiation programme. Although there were relatively few transient changes in mRNAs with discrete GO classification groups beyond 6 h, there was a significant and progressive trend for the up-regulation of genes contributing to translation, and trans splicing during the differentiation programme, matching expectation as stumpy forms progress from translational quiescence into proliferative procyclic forms which are
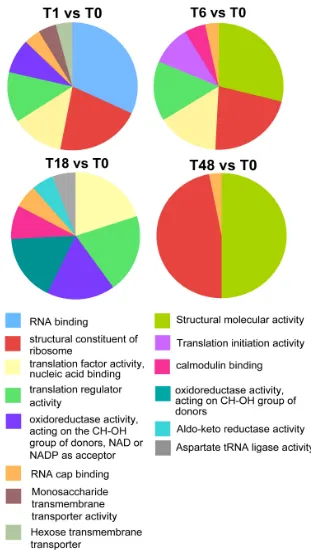
highly active in protein synthesis with abundant polyri-bosomes [44]. A summary of the GO groups elevated at each time point with respect to stumpy cells (assigned according to their frequency in each 'molecular function' category) is presented in Figure 9, whereas a profile of the statistically significant changes in GO group representa-tion during differentiarepresenta-tion is shown in Table 2.
In order to determine if any genomic clustering was evi-dent for co-regulated transcript groups during the differ-entiation programme we also analysed the chromosomal context of the 2166 genes identified as showing 2-fold expression differences at the 5% level in one or more of the comparisons: Slender vs. T0, T1 vs. T0, T6 vs. T0, and T48 vs. T0. These genes were plotted in physical order along each of the 11 chromosomes of the T. brucei genome and colour coded with respect to their up- or down-regulation according to the trinary code classes described above (Additional file 9). Supporting previous small-scale analyses of gene clustering for genes differen-tially regulated between different life-cycle stages, this revealed no extensive physical association of co-regulated gene clusters in the trypanosome genome. This provides further comprehensive evidence for regulation of the genome of T. brucei at the level of post-transcriptional operons.
Analysis of stumpy-enriched transcripts by oligonucleotide motif scoring
[image:15.612.51.563.617.700.2]We recently applied an oligonucleotide frequency scoring algorithm to identify nucleotide motifs statistically over-represented in the 3'UTR of procyclic form enriched tran-scripts in order to identify potential regulatory sequences [62]. The same approach was applied here to analyse the subset of transcripts predicted to be up-regulated in stumpy forms, these being searched for sequences statisti-cally overrepresented when compared with either slender forms, or differentiating parasites. As in our previous anal-ysis a training set derived from the 300 nt downstream of the stop codon of all predicted open reading frames on chromosome 1 and 2 (883 genes) of the T. brucei genome was generated. This provided frequency tables which were used to interrogate the 300 nt region downstream of the
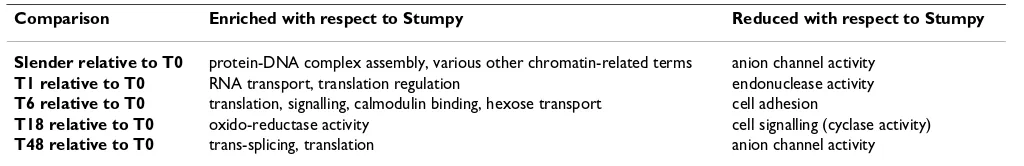
Table 2: Enrichment or reduction of GO groups with respect to stumpy forms
Comparison Enriched with respect to Stumpy Reduced with respect to Stumpy
Slender relative to T0 protein-DNA complex assembly, various other chromatin-related terms anion channel activity
T1 relative to T0 RNA transport, translation regulation endonuclease activity
T6 relative to T0 translation, signalling, calmodulin binding, hexose transport cell adhesion
T18 relative to T0 oxido-reductase activity cell signalling (cyclase activity)
T48 relative to T0 trans-splicing, translation anion channel activity
Gene ontology classifications for transcripts elevated at different time points after the initiation of differentiation from stumpy forms to procyclic forms
Figure 9
40 transcripts predicted to be enriched in stumpy forms (i.e. those genes with a -1, -1, -1, -1, -1 trinary profile; Additional file 5) this being carried out using the Regula-tory Sequence Analysis Tools (RSAT) web server [65]. Comparison of the two datasets identified two related hexanucleotide sequences in the stumpy enriched cohort (TCTTAC and TTCTTA) these being named stumpy motif 1 and stumpy motif 2 (SM1 and SM2). Of the cohort of 40 stumpy-enriched transcripts, SM1 was detected in 7/40 transcripts (17.5%) whereas SM2 was present in 12/40 (30%) of transcripts, with at least one of the motifs being present in 33% of stumpy-enriched transcripts. This con-trasted with the frequency of these motifs in the 300 nt downstream of every gene predicted in the T. brucei genome database (a set of 11,008 genes) of 6.2% (SM1) or 11.5% (SM2), respectively.
Most interestingly, when we expanded the analysis to examine the 3'UTR of those genes with the highest overall probability of being enriched in stumpy forms when com-pared with slender forms (i.e. genes up-regulated in stumpy forms with an adjusted p value of between 0.01 and 0.06, this representing a cohort of 106 genes) we found that the context of the over-represented oligonucle-otide sequences was not random (Figure 10). Thus, apply-ing oligonucleotide frequency scorapply-ing to this gene set again identified the SM1 sequence (TCTTAC) as the most significantly over-represented motif, it being present at a frequency of 14% compared to 6.2% in the background dataset. However, when the position of the motif was determined in relation to the stop codon, we found that it was predominantly located 151-200 nt downstream of the stop codon, whereas there was no obvious positional enrichment of the motif in the 683 genes from the rest of the trypanosome genome that harbour SM1. We conclude that two related oligonucleotide motifs SM1 (TCTTAC) and SM2 (TTCTTA) are overrepresented in the 3'UTR of those mRNAs more abundant in stumpy forms and that SM1 shows a positional bias 150-200 nt downstream from the gene stop codon. This suggests that these sequences might represent context-specific regulatory motifs contributing to elevated gene expression in stumpy forms.
Discussion
In this paper we describe an analysis of the mRNA expres-sion profile of trypanosomes from two discrete blood-stream form stages of the parasite (slender and stumpy forms), as well as during the transition of the stumpy pop-ulation to the procyclic life-cycle stage. Although previous analyses have compared either cultured or rodent derived bloodstream form parasites with cultured procyclic forms [37,38], our analysis represents the first comparison of in vivo derived pleomorphic slender cells with genetically identical stumpy forms, and a first analysis of the dynamic changes in mRNA profile that accompany the transition to procyclic forms. Previous analyses of the differentiation from stumpy to procyclic forms have established that this transition follows a defined and highly reproducible tem-poral programme, with progression through the major events of differentiation occurring with great synchrony in the population [33]. This provides a considerable power to the analysis of regulated mRNA changes because the observed changes at the population level can be used to direct infer changes at the individual cell level. Moreover, by tracking the progressive changes in mRNA abundance between time points in the differentiation programme, trends in the expression of individual or groups of tran-scripts can be identified, enabling regulated changes in expression to be distinguished from sample-specific vari-ations.
Motif analysis for the regulation of transcripts predicted to be up-regulated in stumpy forms
Figure 10
Consistent with current consensus for the best optimisa-tion of microarray analyses [66], our study focused on maximising the number of biological replicates, with 5 bio-replicates used for the stumpy and differentiating cell populations and 4 bio-replicates used for the pleomor-phic slender populations. This allows both measurement and biological variability to be assessed and statistically tested, providing considerable statistical power over tech-nical replicates alone. However, the consequence of this approach is that the ability to detect significantly regu-lated transcript groups is likely to be somewhat quenched due to the extent of biological variability, such that tran-scripts known to be differentially regulated may fall out-with the range of statistical significance. This is particularly the case when considering the analysis of stumpy and differentiating populations, which were derived after independent growth in individual mice over six days, likely generating considerable variability in many regulated mRNAs. Nonetheless, by detailed analysis of several cytological events of differentiation, the overall developmental progression of the distinct populations was found to be remarkably consistent enabling the iden-tification of distinct regulated transcript profiles through the transformation process.
Our analyses focussed particularly on mRNAs up-regu-lated in the bloodstream stumpy form. These are the transmission stage of the trypanosome in the mammalian blood and have not been subject to extensive molecular analysis. A number of characteristics define stumpy forms cytologically: their characteristic morphology [27], cell-cycle arrest [67], resistance to proteolytic [29] and pH stress [30] and their capacity for differentiation in response to low concentrations of citrate/cis aconitate (CCA) when exposed to cold shock conditions [51,68]. Consistent with these characteristics, we observed that cell-cycle related transcripts were down-regulated in the stumpy forms (e.g. histone transcripts) whereas the PAD mRNAs (required for CCA reception) [51] were up-regu-lated. In addition to these changes we also observed by mRNA analysis and phenotypic validation that the lipid profile of stumpy forms was modified with respect to slen-der forms, with the expression of IPC representing either pre-adaptation for their differentiation to procyclic forms or early expression of this pathway. Indeed, individual analysis of the expression of each of the four sphingolipid synthase genes showed that one, TbSLS1 (Tb9.211.1030), exhibited particular developmental regulation, indicating that this gene may encode the T. brucei IPC synthase. Based on this prediction, a biochemical analysis has recently confirmed that TbSLS1 has IPC synthase activity, functionally distinguishing it from the closely related TbSLS4, which exhibits sphingomyelin/ethanolamine phosphorylceramide synthase activity [48] (Professor Jay Bangs, University of Wisconsin, USA; personal
communi-cation). Interestingly, squaline monooxygenase utilised in sterol biosynthesis was also up-regulated in stumpy forms. These changes in the lipid composition of stumpy forms perhaps provide explanation for the more robust characteristics of stumpy forms when compared to blood-stream slender forms [29,30] or demonstrate a require-ment for rapid membrane rearrangerequire-ment upon entry into the tsetse fly. Although a functional analysis of other stumpy-enriched transcripts is needed to dissect their role in stumpy form biology, several of the identified mole-cules are consistent with the characteristics of this life cycle stage. For example, the enhanced expression of two chloride channel proteins related to mammalian lyso-somal chloride channel proteins may reflect the known elevated lysosomal activity of stumpy forms [50].
In an attempt to distinguish transcripts regulated as a pre-adaptation for the transformation to procyclic forms, we analysed mRNAs elevated in stumpy forms and 1 h into the differentiation programme. Unsurprisingly in these very transient expression profiles, some discrepancy with the validation assays was observed, possibly reflecting both normalisation bias and some non-systematic errors. Nonetheless, the analysis identified a relatively small sub-set of significantly elevated mRNAs, which comprised sur-face protein mRNAs, possible gene expression regulators, the aforementioned membrane lipid components and some metabolic enzymes. In all probability these will be a considerable under-representation of those molecules whose expression is enriched in stumpy cells because no account is taken of the differential translational efficiency of mRNAs whose overall abundance does not change sig-nificantly. Nonetheless, by bioinformatic comparison of these stumpy enriched mRNAs with the whole cohort of predicted genes in the trypanosome genome, enriched oli-gonucleotide sequences (SM1, SM2) could be identified in their 3'UTRs. These related motifs were statistically over-represented among stumpy mRNAs and one, SM1, exhibited a positional bias within the 3'UTR, being enriched 150-200 nt from the stop codon. Although the functional significance of over-represented oligonucle-otide motifs requires experimental validation, the pres-ence of a positional bias is not expected for a motif or motifs over-represented by chance alone and instead sug-gests a possible context-dependent function.
quiescent, with metabolic labelling indicating that stumpy forms show only ~25% protein synthesis of bloodstream slender forms [44], TKS and KM, unpub-lished observations). After the rapid induction of mRNAs associated with translational processes, the parasites up-regulated mRNAs associated with cell proliferation, including genes required for DNA replication as well as structural components required for cell division. The kinetics of these molecular changes matched well the pre-viously characterised cytological differentiation events, being induced after 6 h in differentiation conditions. Thereafter mRNAs associated with the metabolic changes that accompany differentiation were up-regulated. These changes indicate that there is rapid adaptation in terms of the mRNA profile as cells initiate differentiation to procy-clic forms.
Although the tracking of known transcripts during the developmental events is informative and reassuring, the most interesting new information is likely to emerge from the analysis of genes which, although regulated, have no known function assigned or where distinct function can-not be assigned on the basis of sequence alone. Two examples that emerge from our analysis include the differ-ential profile of sphingolipid synthesis genes described above and the observed transient elevation of histone deacetylase 2 during differentiation. Unlike the three other histone deacetylases in T. brucei, gene deletion of histone deacetylase 2 does not generate phenotype in bloodstream forms or during monomorphic cell differen-tiation [69]; however more detailed analysis of pleo-morphs undergoing synchronous differentiation may uncover a subtle or unexpected role in development, as observed for these molecules in other systems [70]. Finally, although genes with similar expression profiles were not clustered in the genome, analysis of the regula-tory motifs governing the co-expression of unlinked genes may allow cryptic regulatory motifs to be identified and post-transcriptional operons to be defined [71]. Hence, analysing genes with regulated expression profiles or which are co-regulated with other genes of known and unknown function should help to dissect the co-ordina-tion of events necessary to generate a successfully differen-tiated procyclic form cell.
Conclusion
The synchronous differentiation between bloodstream stumpy forms and procyclic forms in vitro has been exploited to identify regulated changes in gene expression during accessible developmental transitions of the African trypanosome. mRNA profiles were derived and analysed in the context of known biological markers for discrete steps in the differentiation programme and comparisons made between different samples at important points in its progression. Observed changes in gene expression have
been verified by the analysis of known gene expression profiles or phenotypic analysis. The resulting data set will prove useful in analysing expression trends during trans-mission between bloodstream and procyclic forms of Trypanosoma brucei.
Methods
Trypanosomes and biological sample generation
Trypanosoma brucei brucei AnTat1.1 were used for all assays. For sample generation parasites were grown in cyclophosphamide treated mice and purified from host blood in PSG at 37°C via DEAE cellulose. Harvested par-asites were then centrifuged at 2000 rpm in a clinical cen-trifuge, resuspended in pre-warmed (37°C) HMI-9 medium at approximately 1 × 10⁸/ml and settled for 60 minutes. Time 0 h time points were prepared by harvest-ing 2 ml of culture (2 × 10⁷ parasites), the remaining 8 ml being added to 32 ml of SDM-79 medium containing 6 mM cis-aconitate and 10 mM glycerol. 10 ml aliquots were then taken at 1 h, 6 h, 18 h, with an additional 1 ml being harvested to prepare air dried smears, which were fixed in methanol at -20°C. At 18 h a further 10 ml of SDM79 was added to the remaining fluid (4-5 ml) and 10 ml of this harvested at 48 h for RNA preparation. Analyses of cell differentiation were carried out by immunofluores-cence microscopy, as previously described [33], using antibodies specific for mouse anti-EP procyclin (1:500; Cedar Lane Laboratories) or rabbit anti-AnTat1.1 VSG (1:10,000; a kind gift of Professor Jay Bangs), with slides being counterstained with DAPI to allow visualisation of the cell nucleus and kinetoplast(s). Kinetoplast reposi-tioning of 100 cells per sample was scored using ImageJ on a Zeiss Axioskop 2.
Pleomorphic slender cells were grown for 3 days in cyclo-phosphamide treated mice, then purified from host blood as for pleomorphic stumpy cells. The harvested parasites were then centrifuged at 2000 rpm in a clinical centrifuge and resuspended in HMI-9 medium, as above. Matching the treatment of stumpy forms, the slender cells were har-vested after 1 h in HMI-9 and RNA prepared.
RNA preparation
10 ml of cell suspension (~1 × 10⁷ parasites) was centri-fuged at 2000 rpm in a clinical centrifuge for 10 minutes, washed once for 1 minute with PSG and then the cell pel-let lysed in 350 μl RLT buffer containing β -mercap-toethoanol, as specified in the "RNAeasy" RNA preparation protocol (QIAgen). RNA preparation was then completed according to the manufacturer's protocol, including the DNAse I treatment step.
RNA analysis and array hybridization
Nano-Drop™ 1000 Spectrophotometer to assess the quantity and then quality analysed on an Agilent RNA 6000 Nano chip (lab-on-a-chip), using a 2100 Agilent Bioanalyser. For target preparation, a primer containing poly dT and the T7 polymerase promoter was annealed to 500 ng of polyA+ RNA and reverse transcriptase used to synthesize the first and second strands of cDNA. Next, cRNA was syn-thesized from the double stranded cDNA using T7 RNA polymerase as specified by the manufacturer (low input linear amplification protocol; Agilent), this incorporating cyanine 3 (Cy3). Thereafter, 5 ug of the Cy3 target cRNAs were hybridised to the JCVI Trypanosoma brucei microar-rays (version 3) for 18 hours at 60°C, washed, and scanned using an excitation wavelength of 532 nm and Cy3 detection filter in an Agilent microarray scanner (G2505B). Post hybridization and washing, microarray images were quantified using QuantArray software ver-sion 3 (Genomic Solutions). Northern blots were pre-pared and hybridized as described previously [62].
Array normalisation and analysis
All array data analyses were performed in the R environ-ment using Bioconductor packages http://www.r-project.org; http://www.bioconductor.org. Briefly, array scans were background subtracted prior to QC analysis. Sub-standard arrays were removed from the analysis. The remainder were normalised within each array using print-tiploess, and subsequently normalised across arrays using quantile normalisation. Data from control features were removed, and on-array duplicates averaged prior to linear model fitting and comparison of samples. Subsequently, empirical Bayesian analysis was applied (including p value adjustment for multiple testing, which controls for false discovery rate). The Bioconductor package limma was used (Smyth (2005) In:'Bioinformatics and Compu-tational Biology Solutions using R and Bioconductor'. R. Gentleman, V. Carey, S. Dudoit, R. Irizarry, W. Huber (eds), Springer, New York, 2005). Gene lists, with accom-panying statistical data, were generated for each compari-son. Filtering of the data, whether by raw p value, adjusted p value, or fold change was as described within the text. Gene ontology (GO) enrichment analyses were carried out on appropriate subsets of the data, applying a
hyper-geometric test (available in the GOstats Bioconductor package). Up- and down-regulated loci were analysed sep-arately across each of the three ontologies (BP: biological process; MF: molecular function; CC: cellular compo-nent). Array data has been uploaded to Gene Expression Omnibus with series accession ID GSE17026.
Oligonucleotide frequency scoring analysis was carried out essentially as described in [62].
qRT-PCR
cDNA was made from 2 μg RNA using an oligo (dT)15 primer in a 20 μl total volume using the Reverse Transcrip-tion System (Promega) following the manufacturer's instructions, then diluted 1 in 5 with nuclease-free water. For qRT-PCR, 20 μl reactions were set up containing 5 μl cDNA in SYBR Green Master Mix (Roche) with 0.5 μM for-ward and reverse primers (these are listed in Table 3), these being validated by Amplify 3 http://engels.genet ics.wisc.edu/amplify/ and designed to amplify a 143-217 bp amplicon. Amplification was carried out in 96 well plates (Roche) in a LightCycler 480 machine comprising a 10 minute pre-incubation step at 95°C followed by 40 cycles of 95°C for 10 s, 55°C for 20 s, 72°C for 10 s with a single acquisition read at 82°C. A meltcurve analysis was performed from 65°C to 97°C with 2 acquisitions taken per °C, to test for primer dimer contamination. No-RT and no-template controls were run in each experiment and all wells were set up in duplicate. Relative quantifica-tion was calculated using the Pfaffl equaquantifica-tion [72] using as a standard Tb10.389.0540, which was identified as being a stably expressed gene across all time points by array analysis.
Electrospray mass spectrometry analysis of parasite lipids
[image:20.612.54.550.616.717.2]Total lipids from ~1 × 10⁸ monomorphic bloodstream and stumpy trypanosomes were extracted by the method of Bligh and Dyer [73], dried under N2, and stored at 4°C. The lipid extracts were analyzed with a Micromass Quat-tro Ultima triple quadrupole mass specQuat-trometer equipped with a nanoelectrospray source in both positive and neg-ative ion modes. Tandem mass spectra (MS/MS) were obtained with collision offset energies as follows: 45 V,
Table 3: Primers used in qRT-PCR assays
Gene ID Forward primer Reverse primer
Tb10.26.0220 5' TCCAACCGATAACACGACAG 3' 5' CGATATGACCGACACGTCAC 3' Tb927.7.7160 5' AGGCATCCATCGAGTACAGC 3' 5' TATCCTTCCGCAACACCTTC 3' Tb10.6k15.3640 5' ACGGCCTCGTTGATACACTC 3' 5' CAACATTCCACCGACCATC 3' Tb927.3.2710 5' GCAAGTCCATCACACAGGAG 3' 5' GAAGAGGCTACGGACACACC 3' Tb927.1.4450 5' AGCAGCAGGTTATGGTGGAG 3' 5' ATACAACGATTCCGGTGAGC 3' Tb10.389.0540 5' CCAGCCTTCTCAATCTCCAG 3' 5' GGCCACAGTTGGATAGCTTG 3' Tb10.389.0650389.0650 5' ACGCTAGCACAACCAGAAGC 3' 5' GACCGACCAGGTCTTCTACG 3'
GPIno in negative ion mode, parent-ion scanning of m/z 241, as described previously [74]. Each spectrum encom-passed at least 50 repetitive scans. Annotation of all phos-pholipids was also based upon comparison to their theoretical values and other ES-MS and ES-MS/MS analy-ses conducted on whole cell extracts (T. K. Smith, manu-script in preparation). Each spectrum encompassed at least 50 repetitive scans.
Authors' contributions
SK carried out all trypanosome differentiation assays, ana-lysed differentiation markers, prepared RNA samples and completed northern and qRT PCR experiments. KF carried out oligonucleotide frequency analysis and motif identifi-cation. AR performed microarray hybridisations, AI per-formed statistical normalisation and bioinformatics data analysis. TKS analysed the lipid composition of slender and stumpy form parasites. PG contributed to the study design. KM conceived the study and, with SK, analysed the data and wrote the manuscript, which was approved by all authors.
Additional material
Additional file 1
Pairwise comparisons between slender and individual time-points for all genes represented on the microarrays. Each column contains data with respect to each oligonucleotide represented on the array, with the par-ent Gene ID, product description, Protein ID, oligonucleotide sequence, oligonucleotide co-ordinates, signal intensity and statistical association provided for each. Annotations with respect to the presence of a signal pep-tide, transmembrane domain or GO classification are also detailed.
Click here for file
[http://www.biomedcentral.com/content/supplementary/1471-2164-10-427-S1.zip]
Additional file 2
Pairwise comparisons between different individual time-points for all genes represented on the microarrays. Each column contains data with respect to each oligonucleotide represented on the array, with the parent Gene ID, product description, Protein ID, oligonucleotide sequence, oligo-nucleotide co-ordinates, signal intensity and statistical association pro-vided for each. Annotations with respect to the presence of a signal peptide, transmembrane domain or GO classification are also detailed.
Click here for file
[http://www.biomedcentral.com/content/supplementary/1471-2164-10-427-S2.zip]
Additional file 3
Expression profile of all genes or those 407 genes exhibiting Log2 ferential expression (P < 0.001) at one or more time points during dif-ferentiation. Relative fold change in expression is given relative to stumpy forms (T0). Genes are sorted on the basis of relative differential between slender and stumpy forms, with genes up-regulated in slender forms with respect to stumpy forms having a positive value and genes down-regulated having a negative value. Associated statistical values for each comparison are available in Additional file 1 and Additional file 2.
Click here for file
[http://www.biomedcentral.com/content/supplementary/1471-2164-10-427-S3.zip]
Additional file 4
Genes exhibiting Log2 differential expression (adj P < 0.05 or adj P < 0.1) between pleomorphic slender and stumpy forms. Sheet 1 shows genes up-regulated in slender forms with respect to stumpy forms; sheet 2 shows genes up-regulated in stumpy forms with respect to procyclic forms.
Click here for file
[http://www.biomedcentral.com/content/supplementary/1471-2164-10-427-S4.zip]
Additional file 5
Genes elevated in stumpy forms versus all other samples (trinary code profile -1,-1,-1,-1,-1) and genes elevated in stumpy cells and cells at T1 (i.e. 1 hour into the differentiation programme) (trinary code pro-file 0,-1,-1,-1,-1). Analysis of stumpy-enriched transcripts; only genes significant at the p < 0.05 level in one or more comparisons are consid-ered, with the Log2 differential for each gene in each of the comparisons being assigned a trinary code based on whether the value was <-1 (code= -1), >1 (code= 1), or -1>x>1 (code= 0). Values are expressed relative to the expression of each gene in stumpy forms (T0) and are in the order T1 vs. T0, T6 vs. T0; T18 vs. T0; T48 vs. T0 and SL vs. T0.
Click here for file
[http://www.biomedcentral.com/content/supplementary/1471-2164-10-427-S5.xls]
Additional file 6
Summary of transient expression changes during differentiation to procyclic forms. Genes were assigned to each temporal group based on their inclusion in the trinary profiles of transiently regulated genes.
Click here for file
[http://www.biomedcentral.com/content/supplementary/1471-2164-10-427-S6.xls]
Additional file 7
Expression profiles of genes exhibiting transient expression during dif-ferentiation. Individual profiles of different transiently expressed groups as assigned to distinct trinary codes during the differentiation programme.
Click here for file
Acknowledgements
Microarrays were provided through NIAIDs Pathogen Functional Genom-ics resource centre, managed and funded by the Division of Microbiology and Infectious diseases, NIAID, NIH, DHHS and operated by the J. Craig Ventnor Institute. We thank Jay Bangs for the gift of VSG AnTat1.1 specific antibody, for helpful discussions and for communicating to us unpublished experimental observations. We also thank Christine Clayton and Rafael Queiroz for open and helpful discussions and for communicating data prior to publication. This work was supported by a Wellcome Trust Programme Grant to KRM, a BBSRC studentship to SK and a Wellcome Trust Senior Research Fellowship (067441) to TKS. Support was also provided through a Wellcome Trust strategic award for the Centre for Immunology, Infec-tion and EvoluInfec-tion at the University of Edinburgh.
References
1. Cho RJ, Campbell MJ, Winzeler EA, Steinmetz L, Conway A, Wodicka L, Wolfsberg TG, Gabrielian AE, Landsman D, Lockhart DJ, et al.: A genome-wide transcriptional analysis of the mitotic cell cycle. Mol Cell 1998, 2(1):65-73.
2. Chu S, DeRisi J, Eisen M, Mulholland J, Botstein D, Brown PO, Her-skowitz I: The transcriptional program of sporulation in bud-ding yeast. Science 1998, 282(5389):699-705.
3. McCarroll SA, Murphy CT, Zou S, Pletcher SD, Chin CS, Jan YN, Kenyon C, Bargmann CI, Li H: Comparing genomic expression patterns across species identifies shared transcriptional pro-file in aging. Nat Genet 2004, 36(2):197-204.
4. White KP, Rifkin SA, Hurban P, Hogness DS: Microarray analysis of Drosophila development during metamorphosis. Science
1999, 286(5447):2179-2184.
5. Hall N, Karras M, Raine JD, Carlton JM, Kooij TW, Berriman M, Flo-rens L, Janssen CS, Pain A, Christophides GK, et al.: A comprehen-sive survey of the Plasmodium life cycle by genomic, transcriptomic, and proteomic analyses. Science 2005,
307(5706):82-86.
6. Kasuga T, Townsend JP, Tian C, Gilbert LB, Mannhaupt G, Taylor JW, Glass NL: Long-oligomer microarray profiling in Neurospora crassa reveals the transcriptional program underlying bio-chemical and physiological events of conidial germination.
Nucleic Acids Res 2005, 33(20):6469-6485.
7. Konstantinopoulos PA, Spentzos D, Cannistra SA: Gene-expres-sion profiling in epithelial ovarian cancer. Nat Clin Pract Oncol
2008, 5(10):577-587.
8. Farber CR, Lusis AJ: Integrating global gene expression analysis and genetics. Adv Genetics 2008, 60:571-601.
9. Futcher B: Transcriptional regulatory networks and the yeast cell cycle. Curr Op Cell Biol 2002, 14(6):676-683.
10. Bozdech Z, Llinas M, Pulliam BL, Wong ED, Zhu J, DeRisi JL: The transcriptome of the intraerythrocytic developmental cycle of Plasmodium falciparum. PLoS Biol 2003, 1(1):E5.
11. Bozdech Z, Zhu J, Joachimiak MP, Cohen FE, Pulliam B, DeRisi JL:
Expression profiling of the schizont and trophozoite stages of Plasmodium falciparum with a long-oligonucleotide micro-array. Genome Biol 2003, 4(2):R9.
12. Barrett MP, Burchmore RJ, Stich A, Lazzari JO, Frasch AC, Cazzulo JJ, Krishna S: The trypanosomiases. Lancet 2003,
362(9394):1469-1480.
13. Sogin ML, Elwood HJ, Gunderson JH: Evolutionary diversity of eukaryotic small-subunit rRNA genes. Proc Natl Acad Sci USA
1986, 83(5):1383-1387.
14. Haile S, Papadopoulou B: Developmental regulation of gene expression in trypanosomatid parasitic protozoa. Curr Op Microbiol 2007, 10(6):569-577.
15. Ivens AC, Peacock CS, Worthey EA, Murphy L, Aggarwal G, Berriman M, Sisk E, Rajandream MA, Adlem E, Aert R, et al.: The genome of the kinetoplastid parasite, Leishmania major. Science 2005,
309(5733):436-442.
16. Tschudi C, Ullu E: Unconventional rules of small nuclear RNA transcription and cap modification in trypanosomatids. Gene Expression 2002, 10:1-2.
17. LeBowitz JH, Smith HQ, Rusche L, Beverley SM: Coupling of poly(A) site selection and trans-splicing in Leishmania. Genes Dev 1993, 7(6):996-1007.
18. Matthews KR, Tschudi C, Ullu E: A common pyrimidine-rich motif governs trans-splicing and polyadenylation of tubulin polycistronic pre-mRNA in trypanosomes. Genes Dev 1994,
8(4):491-501.
19. Clayton CE: NEW EMBO MEMBER'S REVIEW Life without transcriptional control? From fly to man and back again.
EMBO J 2002, 21(8):1881-1888.
20. Clayton C, Shapira M: Post-transcriptional regulation of gene expression in trypanosomes and leishmanias. Mol Biochem Par-asitol 2007, 156(2):93-101.
21. Cohen-Freue G, Holzer TR, Forney JD, McMaster WR: Global gene expression in Leishmania. Int J Parasitol 2007, 37(10):1077-1086. 22. Leifso K, Cohen-Freue G, Dogra N, Murray A, McMaster WR:
Genomic and proteomic expression analysis of Leishmania
promastigote and amastigote life stages: the Leishmania genome is constitutively expressed. Mol Biochem Parasitol 2007,
152(1):35-46.
23. McCulloch R: Antigenic variation in African trypanosomes: monitoring progress. Trends Parasitol 2004, 20(3):117-121. 24. Vassella E, Reuner B, Yutzy B, Boshart M: Differentiation of
Afri-can trypanosomes is controlled by a density sensing mecha-nism which signals cell cycle arrest via the cAMP pathway. J Cell Sci 1997, 110(Pt 21):2661-2671.
25. Reuner B, Vassella E, Yutzy B, Boshart M: Cell density triggers slender to stumpy differentiation of Trypanosoma brucei
bloodstream forms in culture. Mol Biochem Parasitol 1997,
90(1):269-280.
26. Shapiro SZ, Naessens J, Liesegang B, Moloo SK, Magondu J: Analysis by flow cytometry of DNA synthesis during the life cycle of African trypanosomes. Acta Trop 1984, 41(4):313-323. 27. Vickerman K: Polymorphism and mitochondrial activity in
sleeping sickness trypanosomes. Nature 1965, 208(12):762-766. 28. Priest JW, Hajduk SL: Developmental regulation of mitochon-drial biogenesis in Trypanosoma brucei. J Bioenerg Biomem 1994,
26(2):179-191.
29. Sbicego S, Vassella E, Kurath U, Blum B, I R: The use of transgenic
Trypanosoma brucei to identify compounds inducing the dif-ferentiation of bloodstream forms to procyclic forms. Mol Biochem Parasitol 1999, 104:311-322.
30. Nolan DP, Rolin S, Rodriguez JR, Abbeele J Van Den, Pays E: Slender and stumpy bloodstream forms of Trypanosoma brucei dis-play a differential response to extracellular acidic and prote-olytic stress. Eur J Biochem 2000, 267(1):18-27.
Additional file 8
Gene ontology analysis for genes temporally regulated during differ-entiation. Genes on the array have been assigned annotation from any or all of the three gene ontologies (Biological process, BP; Molecular func-tion, MF; cellular compartment, CC). The charts show the representation within distinct Gene ontology groups of significant genes (P < 0.05) within each comparison. Genes up-regulated and down-regulated are shown separately.
Click here for file
[http://www.biomedcentral.com/content/supplementary/1471-2164-10-427-S8.zip]
Additional file 9
Chromosomal location of the genes encoding regulated transcripts. Physical clustering of genes exhibiting differential expression (P < 0.05) in the comparisons T1 vs. T0; T6 vs. T0; T18 vs. T0; T48 vs. T0 and SL vs. T0. The trinary codes for each gene significant at the 5% level were plotted in physical order along each chromosome. Blue denotes down-reg-ulation, Red denotes up-regdown-reg-ulation, white indicates 'no change'. No evi-dence of clustering was observed.
Click here for file