The SocioMetricVis
Giving Feedback During a Brainstorm Session
Bachelor Thesis Creative Technology Student: M. C. Slot
Final Version, 2 February 2017
Client: Department of Psychology of Conflict, Risk and Safety Client supervisor: Elze Ufkes
Client Website: http://www.utwente.nl/bms/pcrv/
CreaTe supervisor: Khiet Truong Critical Observer: Elze Ufkes
!
Abstract
!
Acknowledgement
I would like to thank everybody who contributed to this thesis and who helped making this visualisation possible. I would like to thank some people in special:
- Khiet & Elze for all the tremendous help, creative ideas, feedback and critical remarks. - Alfred de Vries for al the technical support
!
Table of Contents
Abstract
1
Acknowledgement
2
Table of Contents
3
List of Figures
5
List of Tables
6
Chapter 1 - Introduction
7
Chapter 2 - Methods and Techniques
9
2.1 - The Creative Technology Design Process
9
2.2 - Planning
11
2.3 - User Tests
11
Chapter 3 - Ideation Phase
13
3.1. - Background Research
13
3.2 - State of the Art
16
3.3 - Conclusions of Ideation Phase
20
Chapter 4 - Specification
23
4.1 - User case Scenarios
23
4.2 - User requirements
24
4.3 - Rapid Prototyping
24
4.4 - User test 1
26
4.5 - Functional Requirements
31
4.6 - Technical specification
32
4.7 - Conclusions of Specification Phase
33
Chapter 5 - Realisation
34
5.1 - Complete System
34
5.2 - System Components
35
5.3 - Software
38
5.4 - Prototype 1.0
40
5.5 - Prototype 2.0
42
!
5.7 - Final Prototype 3.0
49
5.8 - Conclusion Realisation phase
50
Chapter 6 - Evaluation
51
6.1 - Discussion
51
6.2 - Conclusion
53
6.3 - Future Work
53
Appendices
55
Appendix 1: Planning
55
Appendix 2: User Test 1
56
Appendix 3: Driver pinout[22]
61
Appendix 4 : Layout Stepper motor [26]
62
Appendix 5: Arduino Mega pinout [27]
63
Appendix 6: Arduino Code
64
Appendix 7: Processing Code
68
Appendix 8: smallbadgedata.xls
70
Appendix 9: User Test Prototype 2.0
70
!
List of Figures
Figure 1: The Creative Technology Design Process [2].
9
Figure 2: The Humanyze Badge Platform [15].
17
Figure 3: Four subjects participate in brain- storming and problem-solving meetings wearing
Sociometric Badges [16].
17
Figure 4: The visualisation on the phone of the Meeting Mediator [16].
17
Figure 5: The visualisation of the data on the screen(left), the setting(middle) and the playback
visualisation shown afterwards (right) [17].
18
Figure 6: The UMF when in use [18].
18
Figure 7: The visualisation of the UMF [18].
19
Figure 8: Concepts using Round shapes and a Hexagon shape
21
Figure 9: Concepts of square visualisations.
22
Figure 10: Concepts for displaying bars on hexagons
22
Figure 11: The final concepts from the Ideation Phase.
24
Figure 12: Top view of a hexagon with different bars in it.
25
Figure 13: Division of bars on top of a hexagon.
25
Figure 14: division of square bars on top of a hexagon
25
Figure 15: Final rapid prototype
26
Figure 16 and 17: Picture shown together with interpretation question
27
Figure 18: Picture shown together with adding colour question
27
Figure 19 and 20: Picture shown together with association question
28
Figure 21: Picture shown together with light intensity question
28
Figure 22 and 23: Picture shown together with light interpretation question
28
Figure 24: Answers to question if visualisation is difficult, 1(agree) - 5(disagree).
29
Figure 25: Answer to the question about difficulty for other users, 1(agree) - 5(disagree).
29
Figure 26: Bar charts showing most noteworthy answers of the user test, 1(agree) - 5(disagree).
30
Figure 27: The different options for mechanisms to move the bars
32
Figure 28: A drawing of the bar mechanism
34
Figure 29: A block scheme of the system components.
34
!
List of Tables
Figure 31: Schematic of the connection of the steppers to the Arduino (Sketch made in
Fritzing).
36
Figure 32: Wiring diagram for connecting the Pololu A4988 Motor driver [22]
37
Figure 33: The Arduino connected to the A4988 driver and the Stepper motor.
37
Figure 34: A schematic of the connection of the RGB LEDs (sketch made in Fritzing).
37
Figure 35: The setup of the three RGB LEDs.
38
Figure 36: A diagram of actions per program.
38
Figure 37: Movement of prototype 1.0.
40
Figure 38: Wood Cutout version 1 for one bar.
40
Figure 39: Extra cutout for prototype 1.0
41
Figure 40: Prototype 1.0 and 2.0 together on the left and Prototype 2.0 on the right.
42
Figure 41: The 3 stepper motors with the mechanism and the top plate.
42
Figure 42: Cutout of plastic for one mechanism of prototype 2.0
43
Figure 43: The RGB LEDs inside of the bars
44
Figure 44: Setup of the user test 2.0
45
Figure 45: Answers to question about how much the user would like to try. N=20
45
Figure 46: Likeliness of using the feedback that is given to change attitude. N=15
46
Figure 47: Answers on a scale from 1-5 about the design of the prototype. N=20
47
Figure 48: Willingness to use the finished visualisation. N=20
48
Figure 49: Answers of users about ease of use and user-friendliness. N=20
48
Figure 50: Prototype 3.0.
49
Figure 51: Legend for colour
50
Figure 52: Picture of Final design
53
Table 1: Planning of the different phases
11
! Chapter 1 - Introduction
Chapter 1 - Introduction
Scientists are very interested in how the dynamic of groups work [1]. Group collaboration and behaviour however, are very difficult to measure. This costs a lot of time to research and analyse. The researcher has to observe a lot of factors and has to rely on surveys of test groups. These observations and surveys will not always give sufficient information. A solution was invented to make this research easier, it is called the Sociometric Badge [1]. The Sociometric Badge contains sensors to measure group interaction. The research group of the department of Psychology of Conflict, Risk and Safety (PCRS) at the University of Twente recently purchased the Sociometric Badge. They want to use the Sociometric Badges not only for research but also in practice. PCRS is looking for a team member interaction visualisation made out of the data collected by the Sociometric Badges.
For this graduation project a visualisation of team member interaction during a brainstorm session will be made. The visualisation should contribute to the group behaviour and team member interaction. Adding extra screens can have a negative influence on the group interaction. Therefore the visualisation will be made tangible. The idea of tangible design is to integrate the visualisation into its surroundings by hiding the electronics. The choice was made to focus on team member interaction in a brainstorm session because during a brainstorm session a lot of team member interaction is required. Team members have to work together to find the best and most efficient solution for their problem.
The Sociometric Badge has advanced sensing, processing and feedback capabilities. It contains sensors which are able to measure and analyse interaction patterns, physical distance, engagement in a conversation, interruptions, speaking time and pitch. With these measurements a visualisation will be made to give feedback on the brainstorm session and to improve the team member interaction. This will be done by showing the team members information about their own measurements from the badge. The setting of this brainstorm will be static, therefore no movement measurements are needed.
The visualisation can be used for further research on group interaction and the effect of giving sociometric feedback to a group. This research might lead to more knowledge about group interaction and with that knowledge, more understanding of the human behaviour. For example, research can be done to see if the group interaction improves and the brainstorm gets more effective with the use of the visualisation. The visualisation will not only be used for research on brainstorming, but it can also be used by the brainstorming group themselves. It might improve their group behaviour during a brainstorm session, which might lead to a more effective brainstorm with better results.
! Chapter 1 - Introduction
The first sub question will be: What are important factors of a brainstorm session, which can be measured with the Sociometric Badges? The Sociometric Badge is capable of measuring various data. It is important to know which data is relevant for the visualisation.
It is very important to design the visualisation in such a way that it will have the most impact on the user. During the design process very important decisions will be made. These design choices will be explained based on research and user tests. The second sub question will be: How can the visualisation be designed to give user-friendly and easy to understand feedback on the brainstorm session to the user?
! Chapter 2 - Methods and Techniques
Chapter 2 - Methods and
Techniques
It is very important to design the visualisation in such a way that it will be the most user-friendly and easy to understand for the user. During the design process, important decisions will be made that have an effect on the design and the user. By explaining how the visualisation will be designed, a part of the second sub question will be answered: How can the visualisation be designed to give user-friendly and easy to understand feedback on the brainstorm session to the user? At first the Creative Technology Design process will be explained.
[image:10.595.169.411.387.725.2]2.1 - The Creative Technology Design Process
The Creative Technology Design Process has been designed for the bachelor program Creative Technology at the University of Twente. This design process is divided into four phases [2]. This thesis will follow the four phases of the Creative Technology Design Process. Figure 1 shows a schematic view of the Creative Technology Design process. How the visualisation will be designed will be described below.! Chapter 2 - Methods and Techniques
2.1.1 - Ideation Phase
The first phase is the ideation phase. The ideation phase starts by gaining as much information as possible about the project and the origin of the design question. This is done through background research on Sociometric Badges, brainstorming, giving feedback, tangible design and all the aspects that are linked to the project. Furthermore, a State of the Art research is done. After doing research, a clear research question will be defined. In the ideation phase, the design space is explored and ideas for the visualisation are described. The end products of the ideation phase are different product concepts. The ideation phase can be found in Chapter 3.
2.1.2 - Specification Phase
The second phase is the specification phase. It builds upon the output of the Ideation phase and reflects on the produced product concepts. A large number of prototypes are developed, this is called fast prototyping. The prototypes will be evaluated and the gained feedback is applied to the design. A user test is conducted to test the functionalities and the effect of the functionalities on the user and the user experience. The different prototypes are discarded, developed or merged into a new prototype. After a short evaluation of the new prototype and the functional specifications, a prototype of the final design will be developed. The specification phase can be found in Chapter 4.
2.1.3 - Realisation Phase
In the third phase, the realisation phase, the functional specifications defined in the specification phase will develop into a functional architecture. This functional architecture is leading in designing the visualisation. The architecture will be translated into system components. For each of this components, different possibilities are explored and the most feasible solution will be implemented into the design. During the implementation, functional testing will be done to answer the question: Does the component fulfill the functional requirements? During the functional testing, testing will be done on the integrations of the sub systems. A user test will be done to evaluate if the expectations are fulfilled. Adjustments are made to the prototype according to the evaluation and the final prototype will be finished. The deliverable of the realisation phase is a fully working prototype of the visualisation. The realisation phase can be found in Chapter 5.
2.1.4 - Evaluation Phase
! Chapter 2 - Methods and Techniques
2.2 - Planning
To make sure every phase will be handled with enough time a planning is made. The full planning can be found in appendix 1. Table 1 shows the simple planning of the phases. With the use of this planning the design process will be explained and structured.
Table 1: Planning of the different phases
2.3 - User Tests
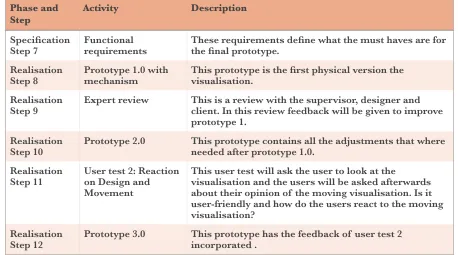
To make sure the visualisation is made to give user-friendly and easy to understand feedback on the brainstorm session, multiple user tests are done. What user test are done and which prototypes follow from this are described in table 2. The user tests are described into more detail later on.
Time Week 46 Week 47 Week 48 Week 49 Week 50 Week 51 Week 52 Week 1 Week 2 Week 3 Week 4 Week 5
Ideation
Specification
Realisation
Evaluation
Report
Phase and Step
Activity Description
Ideation
Step 1 Background research and Brainstorming First ideas for the concepts will be created.
Ideation
Step 2 First concept drawings First concepts will be drawn.
Ideation
Step 3 Expert review This is a review with the supervisor, designer and client. In this review feedback will be given and some concepts will be thrown away.
Specification
Step 4 User scenarios & requirements These scenarios and requirements give insight in what the needs and requirements are from the user. Specification
Step 5 Rapid prototyping Multiple concepts will be drawn. Specification
Step 6 User test 1: User interpretation & Adding light intensity or colour
! Chapter 2 - Methods and Techniques
Table 2: An overview of the user tests, evaluations and prototypes.
Specification
Step 7 Functional requirements These requirements define what the must haves are for the final prototype.
Realisation
Step 8 Prototype 1.0 with mechanism This prototype is the first physical version the visualisation.
Realisation
Step 9 Expert review This is a review with the supervisor, designer and client. In this review feedback will be given to improve prototype 1.
Realisation
Step 10 Prototype 2.0 This prototype contains all the adjustments that where needed after prototype 1.0. Realisation
Step 11 User test 2: Reaction on Design and Movement
This user test will ask the user to look at the
visualisation and the users will be asked afterwards about their opinion of the moving visualisation. Is it user-friendly and how do the users react to the moving visualisation?
Realisation
Step 12 Prototype 3.0 This prototype has the feedback of user test 2 incorporated . Phase and
Step
! Chapter 3 - Ideation Phase
Chapter 3 - Ideation Phase
As described in Chapter 2 - Method and Techniques, the ideation phase starts by gaining as much information as possible about the research field of the graduation project. Therefore a background research is done in Chapter 3.1. In Chapter 3.2 a State of the Art research is done. This will give information about development in the field of research and visualisation that have already been made with the use of Sociometric Badges. This section will answer the question: How can a visualisation of the Sociometric badge and look-a-likes inform participants about their behaviour and collaboration in a brainstorm session?
Chapter 3.3 will be a concluding paragraph describing all the choices and concept drawings that have been made based on the gathered information in the background research and the State of the Art.
3.1. - Background Research
Background research has been done to gain more knowledge about social interaction, social sensing, the Sociometric Badges, brainstorming, feedback and tangible design. The goal of this section is to give more information to answer the first sub question: What are important factors of a brainstorm session, which can be measured with the Sociometric Badges?
3.1.1 - Social Interaction and Social Sensing
Mast et al., states that any verbal or nonverbal behaviour directed towards one or many interaction partners is called “Social Interaction”. Getting insights in social interaction behaviour is very important to improve our understanding of human psychology because much of human behaviour occurs in a social setting [3]. Social sensing allows for verbal and nonverbal interaction behaviour to be measured by social sensors, such as the Sociometric Badge. The possibility that any behaviour can be measured everywhere, is connected to inventions in the computational data processing. These new inventions make it possible to measure behavioural cues without the need of a user giving input. This concept is called ubiquitous computing [3]. The concept of ubiquitous computing has for example been used in the invention of Reality Mining. It uses the signal of mobile phones to study the interaction and movement of individuals and organizations. Unfortunately, this concept has a lot of privacy issues, is not very accurate and therefore not the ideal method to analyse and collect data about social interaction [4].
! Chapter 3 - Ideation Phase
3.1.2 - The Sociometric Badge
The Sociometer and the Uberbadge evolved into the Sociometric Badge, a device capable of automatically capturing social interaction behaviour. The invention of the Sociometric Badges started at MIT Media Lab by a research group that is called the Human Dynamics Group [7]. The goal was to design a new platform to reveal group dynamics and patterns. This new sensor-based technique origins from the need of researchers to measure bigger organizations, which means more people and gain more data without needing more observers and a large amount of surveys [7].
The Sociometric Badge is not only capable of measuring interaction, it can also analyse the data, which can be exported into an excel file. The excel file contains one tab that is the most interesting for my visualisation, t_speech_profile [8]. In this file the following values are given:
• P1 speaking: this shows when the user is speaking;
• Overlap: the amount of seconds spoken while somebody else is speaking;
• Listening: the amount of seconds which the use is silent while somebody else is speaking; • Silent: the amount of seconds which somebody is silent and nobody is speaking;
• Total_speaking: the total amount of seconds spoken in total; • Total_silent: the total amount of seconds silence.
The values total_speaking and overlap are very interesting because they give information over a period of time. The overlap can show the amount of interruptions of the user and the total speaking time can show if the user, compared to other users, has talked too much or too little.
This data is not always easy to understand, especially not for every psychologist who wants to work with this data. Research shows that it is very important to give feedback to the user to keep them committed to wearing the Sociometric Badge when measurements are done over a longer period of time [7]. The excel file which contains the data of the badges does not provide conclusions about the measurements. The data is very raw and needs to be translated into something visual in order to give understandable feedback and to keep the user interested.
3.1.3 - Brainstorming and Feedback
As stated before in the introduction, the visualisation will give feedback in a brainstorm setting. During a brainstorm session, a lot of social and group interaction is required. By doing a literature study, additional information can be found on important factors of a brainstorm session and insights can be gained in what feedback is important to give to the team members during a brainstorm. Osborn [9] did research on brainstorming and defined four basic rules for brainstorming:
• Think of as many ideas as possible
• Encourage each other to think of as free and creative ideas as possible • Build upon the ideas that are previously thought of
• Combine different ideas into new ones
! Chapter 3 - Ideation Phase
Besides Paulus and Dzindolet [10] and Osborn [9], Thompson [11] did research on how to improve creativity in organizational work groups. She defined that there are four major threats to team creativity:
• Social loafing - wondering off, stop participating because members perceive their own contributions to be unidentifiable and dispensable.
• Conformity - based on the principle that every human desires to be liked and accepted by others, particularly in a group.
• Production blocking- if a person is in a flow and is not interrupted, the brainstorm group cannot speak at the same time. They have to wait for their turns to speak. Consequently, people may forget their ideas or decide during the waiting period not to present theirs.
• Downward Norm setting - The level of performance is often compared to the person who is the most unproductive. This does not contribute to the performance of the team. The least productive member of the team is often more influential in determining overall team performance than the high performers.
The defined rules for brainstorming and the major threats to team creativity are important to keep in mind while choosing what feedback the user will get from the visualisation. The given information will try to influence the team members to not show behaviour that is threatening to the creativity and the brainstorming rules. Very often users are not aware of their own behavior. When a user is presented with this data, the user will realise that it needs to change his/her behaviour. If this behaviour is not shown, the group collaboration and productivity will probably improve [11].
How the feedback affects people’s behaviour during their interaction remains to be investigated. The feedback can be used for training and to increase self-awareness, which can lead to personal development. Behavioural feedback can affect how we experience ourselves, as we sometimes make assumptions about our own behaviour based on our view of ourselves. The study on automated instant feedback is still new [7]. Unfortunately, the Sociometric Badge is not capable of showing automated instant feedback but the visualisation for the project will be made so that it could be used for automated instant feedback.
The Sociometric badges will be used to measure a static brainstorm session with 6 team members. Research by Remmerswaal [12][13] showed that the number of participants for a brainstorm session should be less than 8 and more than 5. Therefore the amount of 6 participants is chosen.
3.1.4 - Tangible Design
! Chapter 3 - Ideation Phase
visualisation will be something that can be put on the table without attracting too much attention. It will be a tangible design, which means that the visualisation will interact with digital information through the physical environment. The idea of tangible design is to input computer interfaces into “the real world”[14].
Tangible design can be distinguished into three different views. The first view is the data-centered view. This can be characterized by using physical representation and manipulation of digital data, offering interactive coupling of physical artifacts with “computationally mediated digital information”. Then there is the Expressive-Movement-centered view, which is characterized to aim beyond form and appearance and focused on designing the interaction itself. The focus lies on what interaction does and how it can be designed in order to achieve the best interaction. The third view is the Space-centered view. This view is characterized by arts and architecture and is focused on the ultimate use of physically embedded systems within real spaces. This view tries to trigger a reaction from the user [14]. This data centered view will be the view that is used for the visualisation. The purpose of using the data centered view is to make the visualisation more attractive and less obtrusive to the user.
3.2 - State of the Art
By looking at literature of the Sociometric Badge as well as current thinking in the research field of social sensors used to improve group behaviour, we will get more insight in how the Sociometric Badge is already used and can be used in the future to give feedback to groups. The development and design choices made for competitors and predecessors can help with developing the visualisation, which uses data from a brainstorm session. The main research question of this state of the art research will be:
How can a visualisation of the Sociometric badge and look-a-likes inform participants about their behaviour and collaboration in a brainstorm session?
3.2.1 - Humanyze
The Sociometric Badge is bought from Sociometric Solutions by the company Humanyze. They developed a program for the badge and offer the complete service from badge to feedback system. The badge platform, as they call it provides all the information for both the individual and management through visualisation and dashboards. An example is given in figure 2. This way they can keep track of the dynamics if the dynamics change after implementing new things, which team collaborates most often and what the most effective spaces are within the company [15].
! Chapter 3 - Ideation Phase
[image:18.595.77.521.73.233.2]! !
Figure 2: The Humanyze Badge Platform [15].
3.2.2 - Meeting Mediator
The “Meeting Mediator” is a real-time portable system that can detect social interaction and gives feedback to the user to improve the interaction within a group. It consists of a Sociometric Badge and cellphones for displaying meeting status. This is shown in figure 3.
[image:18.595.198.397.369.492.2]!
Figure 3: Four subjects participate in brain- storming and problem-solving meetings wearing Sociometric Badges [16]. The Meeting Mediator motivates speech and interactivity by showing the absolute amount of talking per user. The Meeting Mediator also tests if giving feedback to the user about their behaviour will change the dynamic of the meeting and the behaviour of the user [16].
[image:18.595.212.381.579.685.2]
Figure 4: The visualisation on the phone of the Meeting Mediator [16].
! Chapter 3 - Ideation Phase
3.2.3 - Second Messenger
[image:19.595.83.517.112.212.2]! !
Figure 5: The visualisation of the data on the screen(left), the setting(middle) and the playback visualisation shown afterwards (right) [17].
There are also look-a-likes of the Sociometric Badge. Second messenger is a simple version of a sociometric feedback system. The idea is to limit social factors, which can prevent the user from realizing their potential. The platform provides feedback to groups by means of a visual display of participation levels and turn-taking patterns during face-to-face meetings or afterwards in the form of a visual replay. Unlike the Sociometric Badge, Second Messenger only uses noise-cancelling microphones to measure speaking patterns. The different coloured circles represent different users and the size of the circle reflects the participation of the person. This can be seen in figure 5. The researchers tested how they could make the visualisation as unobtrusive as possible, test users reported that they did not think that the visualisation was distracting and would use it again [17].
3.2.4 - Ubiquitous Meeting Facilitator
!
Figure 6: The UMF when in use [18].
[image:19.595.142.454.406.543.2]! Chapter 3 - Ideation Phase
[image:20.595.220.347.89.206.2]!
Figure 7: The visualisation of the UMF [18].
The visualisation shows a clock, which has a maximum of 12 users. Each avatar represents a user. The avatar has different types of faces: normal, talking, laughter and frown. The size of the avatar is relative to the moving average. As shown in figure 7, the hand of the clock points to the user who is speaking and when talking, the avatar will show talking or laughter. A frown face show if someone successfully interrupts someone else. Finally, the avatar can also get a hat on its head, this shows that serious or offensive behaviour is shown by this user for example always interrupting. Technically the UMF is ahead of the Sociometric Badge because it is able to distinguish speech from laughter. This can be used to determine if the user interrupts someone or is laughing friendly [18].
3.2.5 - Conclusion State of the Art
The main research question was: How can a visualisation of the Sociometric Badge and look-a-likes inform participant about their behaviour and collaboration in a brainstorm session? The Meeting Mediator, The Humanyze platform, The Ubiquitous Meeting Facilitator and Second messenger all show a visualisation, which gives feedback about team member interaction. The Second Messenger shows the speaking time, whereas the Meeting Mediator both show the speaking time and the interactivity of the users. These two visualisations show that visualizing the measurement of a sociometric sensor works. They also show that the visualisation of the data has an effect on the user. It is interesting to see if this can be improved to make the visualisation even more interesting and user-friendly.
The different systems show how the Sociometric Badges can be used to visualize data. The UMF, for example, uses humor in combination with advanced technology. This is something that the other systems do not use. The visualisations are all screen-based. Some visualisations use mobile phones for every user, while others use one screen for all users. These screens can be obtrusive and be distracting for the users. All the described visualisations give immediate feedback, except the Humanyze platform. This platform is designed for analyzation of the data after a certain period of time. The collected data can be viewed at any moment. This way the change in data can be viewed live.
! Chapter 3 - Ideation Phase
3.3 - Conclusions of Ideation Phase
3.3.1 - Choices bases on Background Research and
State of the Art
During the background research, an answer has been found for the first subquestion. The first subquestion was: What are important factors of a brainstorm session, which can be measured with the Sociometric Badges? The most important factor of a brainstorm session, which all the found factors have in common, is the idea that everybody has the same speaking time and the same opportunities to share their ideas.
All the important factors reflect on the fact that everybody needs the chance to share their ideas. The Sociometric Badge is capable of measuring the speaking time and the amount of interruptions. These two values can give feedback on the idea that everybody has to have the same time to share their ideas and should be able to share their ideas without being interrupted. The speaking time and the amount of interruptions are measured over time.
To avoid the critical point of downward norm setting, the values that will be shown in the visualisation will not be absolute and the values will be shown over time to not put too much stress on the absolute amounts of speaking and interruptions.
Unfortunately, the Sociometric Badge is not capable of sending real-time data. The background research on brainstorming and feedback in chapter 3.1.3 showed that it is important to give feedback to the user to keep the user interested. Therefore the visualisation will give feedback during the break of the brainstorm session. The Sociometric Badge collects data every second. Showing all these seconds after the brainstorm might take too long. Therefore the visualisation will show a fastened replay version of the collected data over time. This will be different from the visualisations that are described in the State of the Art section, which show live feedback of the interaction. Showing a replay is a temporary solution to solve the problem of not having real-time data. This proof of concept will show the collected data during a break in the brainstorm session. Ultimately the visualisation would give feedback during the brainstorm itself.
! Chapter 3 - Ideation Phase
The Sociometric Badges are not yet capable of recognizing phenomena. In the case of the Sociometric Badges, phenomena might be one speaking turn of a user or a small discussion of multiple users. By looking at a larger amount of time, instead of a live visualisation of the collected data, hopefully one or more phenomena are shown. The conclusions that are drawn from the visualisation might be more realistic and less harmful when wrongfully interpreted because they reflect a larger amount of time. The variable that will be shown will consist out of the summed up data per 30 seconds, instead of data per second.
As described in the State of the Art section, the described visualisations all use a screen or display to show the visualisation. Which is different from the visualisation that will be made. The visualisation will be designed using the ideation of tangible design. This means that the visualisation will be physical. The purpose of this is to make the visualisation more attractive and less obtrusive to the user.
A tangible design can put a computer interface into the real world. Brainstorming is something that is very “human”. By making the visualisation tangible, the visualisation will be more graspable. A screen-based visualisation also can be obtrusive, tangible design helps to avoid this. The most tangible designs make use of a beamer to project things on a table or a visualisation form above. The visualisation will be used for brainstorming and brainstorms are not always conducted in a specific room. To project things onto the table, a whole setup is needed. It will be useful to make the visualisation portable. Therefore the choice was made to not use projection on a table but make a physical visualisation. All these sociometric feedback tools are used for group interaction and research on group meetings. The graduation project will focus on brainstorming, this setting has not been used yet for implementing Sociometric Badges. The decision was made to name the visualisation SocioMetricVis. It is short for sociometric badge and visualisation.
3.3.2 - Concept Drawings
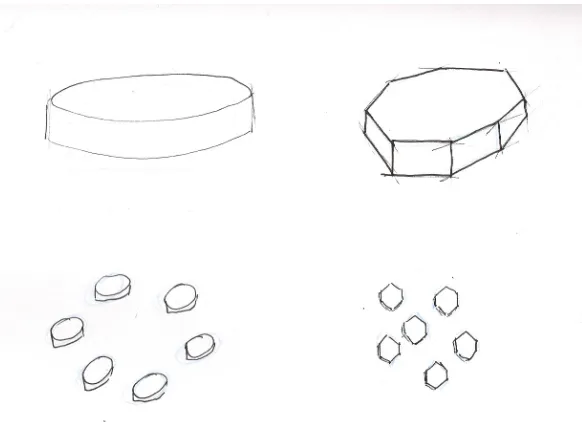
The first sketches are made by looking at different shapes. The idea to make the visualisation in the form a hexagon came from the most efficient number of participants in a brainstorm. This is between the 5 and 8 users [12][13].
[image:22.595.151.442.531.742.2]!
! Chapter 3 - Ideation Phase
Each participant can have its own bar to compare participants. This is inspired by a normal bar chart, which is a good way to visualize data. One big visualisation can be used to show every user or the visualisation can be made modular.
[image:23.595.142.453.346.499.2]!
!
Figure 9: Concepts of square visualisations.
Multiple bars behind each other will be difficult to see and compare. Therefore it might be better to use one bar per user. In one visualisation each participant could have their own partition. In figure 9 and 10, ideas for a visualisation with the shape of a hexagon are drawn.
! !
! Chapter 4 - Specification
Chapter 4 - Specification
As explained in chapter 2 - Methods and Techniques, the Specification Phase builds upon the output of the Ideation Phase. First the user case scenarios will be described to predict the users experience and expectations of the visualisation. These user experiences are translated into user requirement. With these user requirement more prototypes are drawn with the use of rapid prototyping. After the rapid prototyping a concept is picked and evaluated by a user test. After the user test the functional requirements are specified and the user requirements might be adjusted. This Specification phase will work in a cyclic way. During the specification phase the prototype idea will be formed and adjusted according to the user case scenarios, rapid prototyping, the user test and the functional requirements. The goal of the Specification phase is to find the user requirements and obtain the best possible functional specification for the envisioned prototype [2].
4.1 - User case Scenarios
In this section three user case scenarios are described. These scenarios will give more information about the user of the SocioMetricVis and the requirements it needs to have.
4.1.1 - Project Leader Dennis
It is Monday morning and Dennis is going to the university to start with a new course. For this course he needs to make a new product with a group of 6 members. Dennis decided that it would be a good idea to do a brainstorm session to produce as much ideas as possible. Dennis has the habit to speak too much and claim the floor while brainstorming. He decides to use the SocioMetricVis to make sure everybody has enough speaking time and he will get feedback if he speaks too much. He hands a Sociometric Badge to all the other 5 group members and starts by explaining what the visualisation will show. He explains that the SocioMetricVis will show feedback during the break of the brainstorm. Dennis starts the brainstorm by mentioning a couple of his own ideas and the group starts to brainstorm. During the break Dennis collects all the Sociometric Badges again and puts them through the program. He loads the gained Excel file into the system and looks at the visualisation that is moving together with the other members of his group. After the use of the SocioMetricVis with his group, Dennis is no longer afraid of being too dominant during the next brainstorm.
4.1.2 - User and Project Member Kees
! Chapter 4 - Specification
4.1.3 - Researcher Scott
Scott is a social scientist. He is working on a research about group behaviour during a brainstorm session and he wants to know if giving feedback has effect on the behaviour of the group members. He bought the Sociometric Badges and the SocioMetricVis together with the University. He has been busy with collecting enough participants to make a research setting. He finally collects 6 participants who are going to be part of a brainstorm. He explains how it will work and gives each test user a Sociometric Badge. Scott starts the recording of the badges and stops the recording for a break. During the break Scott collects the badge data with a program and puts the gained Excel sheet into the program. He first asks the test users about their vision on the brainstorm and shows the feedback afterwards with the user of the SocioMetricVis. After the second half of the brainstorm session he asks the participants again how they thought the brainstorm went. Together with the data from the Sociometric Badge and the data collected from the surveys he draws conclusions for his research. Scott received good results for his research.
4.2 - User requirements
With the background research and the user case scenario’s, described in previous chapters, the following user requirements have been found:
• The visualisation must be tangible;
• The visualisation must be portable, so it can change places;
• The visualisation must not be obtrusive or block the sight on other team members; • The visualisation needs to be easy to use and user-friendly;
• The visualisation must be inviting to use;
• The visualisation must be foolproof and able to withstand touching; • The visualisation must need as little explanation as possible;
• The user must be able to input the data into the system without complicated steps.
4.3 - Rapid Prototyping
By looking at the different user requirement and the user case scenarios, new concept drawings have been made. Figure 11 show the last concept drawings of the Ideation Phase. The new concepts will be elaborating on these drawings.
!
!
! Chapter 4 - Specification
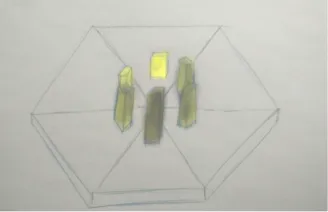
The hexagon is a very interesting shape to elaborate on. Figure 12 shows a top view on how the bars could be displayed on top of the hexagon. The bars could be round or square and there could be two per user or more per user.
!
!
Figure 12: Top view of a hexagon with different bars in it.
It is very difficult to see all the bars if there are more than one per user. Figure 13 shows how the bars could be divided on the hexagon.
!
!
Figure 13: Division of bars on top of a hexagon.
The shape of the bars depend on what is more feasible in designing the mechanism. After elaborating on this the square bars can be moved more easily and give more options for the mechanisms. Figure 14 show how this would look and where the bars could be placed.
!
!
! Chapter 4 - Specification
The most basic version of the concept drawings is shown in figure 15. The visualisation might be clearer if there is only one bar per user and if the bar might show two values. The second value might be shown with light or colour. This will need to be tested with a user test to see what the user prefers.
!
Figure 15: Final rapid prototype
4.4 - User test 1
It is important to test the concept drawings via a user test, to make sure the visualisation is user-friendly and easy to use. During the user test, 6 test users were interviewed. Illustrations were shown to make the explanation clearer. The user test questions and answers can be found in appendix 2. The test users first got a short explanation about the visualisation. The explanation consisted of information about the purpose and setting of the visualisation and information about how the Sociometric Badges work. Every user received the same amount of information. The first part of the interview consisted of open questions. The second part consisted of questions with a Likert-scale from 1 to 5, 1 meaning totally agree to 5 meaning totally disagree.
! Chapter 4 - Specification
!
!
Figure 16 and 17: Picture shown together with interpretation question
The third question was: Do you think colour will add something to the design and why? Figure 18 was shown as illustrations. All the users thought that adding colour had advantages. One test user stated that it could be used for coding the users, while 3/6 users stated that they would like the colours to show a value that is different from the value that is represented by the height of the bars. Values that were named were interruptions, aggressiveness, amount of talk and quality.
!
Figure 18: Picture shown together with adding colour question
Question four asked: What colour should the highest bar be? And the lowest? 3/6 agreed that the highest bar should be red and 3/6 also agreed that the lowest bar should be green. One user stated that he highest bar could also be blue. A table of answers can be found in appendix 2.
! Chapter 4 - Specification
!
!
Figure 19 and 20: Picture shown together with association question
The users were the following about adding light intensity to the visualisation: Do you think that the intensity of light will add something to the design? Figure 21 was shown as illustration. 5/6 test users thought that light intensity would add something to the visualisation. Out of these five test users, one test user thought it would be very difficult to distinguish and one test user thought it would be more fitting if you would go from black to colour or from white to different colours.
[image:29.595.216.380.352.458.2]!
Figure 21: Picture shown together with light intensity question
To find out what scale the intensity of light needs, the test users were asked: Which bar should be the lightest and which bar should be the darkest? 3/6 test users said that the darkest bar should be the person who speaks the least. One user said that the person with the clearest and best ideas should be the most light. One user said that the lowest bar should be the lightest. The illustrations that were shown are in figure 22 and figure 23.
!
! Chapter 4 - Specification
After the open questions 10, quick questions were asked that needed to be ranked from 1-5, totally agree to totally disagree. The overall answers to the questions were moderate. The users gave an average of 3 to the questions: I would like to use this feedback tool while brainstorming. The questions that had noteworthy answers are described below. The other question including their average can be found in appendix 2.
Test users all disagreed to the question: I need to learn a lot of things before I can use the feedback tool This is shown in figure 24. 3/6 users said that more information and learning was not necessary to understand the feedback tool. One user stated that it was absolutely necessary. In contrast to the previous question, all users replied that the visualisation is not complex to the question: I think the feedback tool is unnecessarily complex.
! !
Figure 24: Answers to question if visualisation is difficult, 1(agree) - 5(disagree).
Another question, which had a noteworthy answer was the question: I can imagine that most people would learn to understand this system very quickly. This can be seen in Figure 25. 5/6 users said that it would be easy for other users, while one test user stated that is would be very difficult for others too. This can be the same user who stated that he or she needs to learn a lot of things before using the visualisation.
!
Figure 25: Answer to the question about difficulty for other users, 1(agree) - 5(disagree).
! Chapter 4 - Specification
!
Figure 26: Bar charts showing most noteworthy answers of the user test, 1(agree) - 5(disagree).
Finally, the test users were asked to fill the sentence: I think the feedback tool needs to show this information…
They stated that they liked to see: A legend, more relative values, quality, the amount of speaking and the aggressiveness of the discussion. Furthermore, they suggested that the hexagon had a lot of free space and that it could be used more efficiently by adding colour or differing in size. One test user said that the quiet person can have deep thoughts but might not talk much. He questioned if everybody should have even time to speak.
! Chapter 4 - Specification
4.5 - Functional Requirements
To build the first prototype Functional requirements are needed. These requirements describe must have features of the visualisation. The functional requirements are described below:
• The mechanism should be able to move one bar for each user; • The bar has to represent the amount of speaking time per user; • The bar has to change according to the different values;
• The mechanism should work with a stepper motor and a gear; • The visualisation must be able to show the data over time.
• Multiple bars should be able to change to the values at the same time;
• The mechanism should not be visible to the user and should be hidden in a case;
• The mechanism should be made out of available materials and manufacturing techniques;
• The bar should be accurate enough to change height so that the data can be easily compared with each other;
• The mechanism should be durable and should function for a long time without breaking; • All the electronics should not be visible to the user;
! Chapter 4 - Specification
4.6 - Technical specification
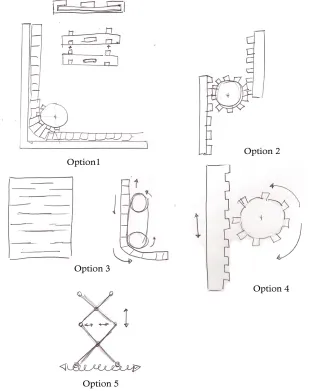
[image:33.595.138.457.153.544.2]To let the bars move according to the values received from the Sociometric Badges there are various options to use. All options are depicted in Figure 27.
Figure 27: The different options for mechanisms to move the bars
Option 1 makes use of separate blocks that are able to click into each other. These blocks have a cut-away where the gear can get grip on the blocks and push them into a groove made to slide the block up. This needs a lot of precision and detail and if one block is not working the whole system can get stuck. Therefore this option is dismissed.
! Chapter 4 - Specification
Option 3 makes use of wood that has incisions to make it flexible. Thanks to the wood being flexible it possible to bend the wood around the gear and sliding it in horizontal direction. This will reduce the height of the visualisation. Unfortunately the incisions will make the wood fragile and the visualisation will be less durable and more prone to breaking. Therefore also this option is dismissed.
Option 4 make use of a gear rack and a gear that is attached to a stepper motor. The gear rack will be held in place by a wooden case around it to prevent if from shifting or standing askew. This option is the most straight forward and will also cause the least complications. Therefore this mechanism will be used for the visualisation.
Option 5 makes use of a spindle and a scissor folding technique. This technique is often used in attic stairs. Two spindles are needed that twist in opposite direction and the scissor mechanism will increase and decrease in height.
4.7 - Conclusions of Specification Phase
! Chapter 5 - Realisation
Chapter 5 - Realisation
As described in Chapter 2 - Method and Techniques, the Realisation Phase builds upon the functional specifications. The functional specifications will help to make the architecture of the complete system. This is described in chapter 5.1. The architecture of the system will be divided into system components. These components are described in chapter 5.2. With the system components the first prototype can be build. The first prototype will be described in chapter 5.3 along with functional testing of this prototype. A description of prototype 2.0 can be found in chapter 5.4. Prototype 2.0 will be user tested in chapter 5.5. Errors found with the user test can be adjusted in the final prototype 3.0. This will be described in chapter 5.5.
5.1 - Complete System
To find out how to build the first prototype, it is important to look at the whole system first.
What components does the system contain and how are they connected? What materials are needed to build the prototype? The complete system consists out of one mechanism which is multiplied for each bar. The bar will be moved by a stepper motor. This mechanism is shown in figure 28.
[image:35.595.206.397.605.733.2]!
Figure 28: A drawing of the bar mechanism
5.1.1 - Block Scheme of the Complete System
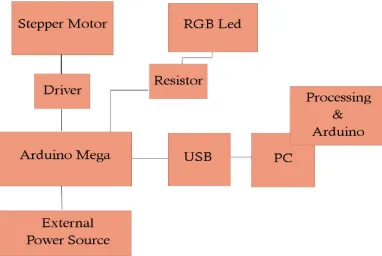
The system consists out of 6 components that are linked to each other. This can be seen in the block scheme in figure 29. The Arduino is connected to the stepper motor and controls the system. The Arduino receives data from the computer through an USB cable. The Arduino controls the Stepper motors and the Led’s that change according to the received data. The whole system is powered by an adaptor of 12 V.
! Chapter 5 - Realisation
5.1.2 - Materials
To build the prototype different materials are needed. All the materials needed are described below: The programs that are used:
• Fritzing, for layouts of the system components. • Arduino, for programming the Arduino board.
• Processing, for sending the data from the computer to the Arduino. • Excel, for data processing.
The electrical components that are used are: • Arduino Mega 2560 R3 incl. USB cable
• 3 x Pololu Motor Drivers A4899 (pinout in appendix 3)
• 3 x Stepper motors, Wantai 42BYGHW60, 1.7A, 1.8 deg/step (specification in appendix 4)
• Connection cables Female - Male
• Connection cables Male - Male • Power adapter, 12,6 V - 1A • 2 x Breadboard 400 points
• 3 x RGB LED Diffuse 5mm Cathode • 9 x Resistor 330Ω
Other supplies that are needed: • 12 x Screws 3mm x 15mm • 12 x Screws 3mm x 20mm • 12 x Bolts 3mm
• Electrical Tape
• Glue for Plastic and Wood
• Acrylic Plates suitable for laser cutting • Wooden Plates suitable for laser cutting
5.2 - System Components
The system consists out of multiple components. In this section, all of these components are
described in more detail.
[image:36.595.206.387.588.709.2]5.2.1 - Arduino Board
Figure 30: A top view of the Arduino Mega 2560 [20].
! Chapter 5 - Realisation
ports. It can be connected to an USB cable and power source. It is a plug and play concept. The Arduino Mega comes with a program called Arduino in which you can program by using java. The Arduino Mega contains 256 KB flash memory where the code can be loaded onto. The Arduino can be used to control different actuators but can also read data from sensors. The Arduino also has protection against shorting and over current. This will protect the computer from any harm. This makes the Arduino the perfect microcontroller to control the LED’s and the stepper motors [21]. The pin layout of the Arduino Mega can be found in appendix 5.
5.2.2 - Stepper Motors
[image:37.595.202.392.304.520.2]To move the bars up and down a gear is used. This gear is attached to a stepper motor. A stepper motor is a DC electric motor which is capable of rotating forwards and backwards. It is known for its power and reliability. These stepper motors are each connected to a driver with 4 cables and powered by an external power source of 12V. The stepper motors will be controlled by the Arduino. Figure 31 shows a schematic on how the stepper motors are connected to the Arduino.
Figure 31: Schematic of the connection of the steppers to the Arduino (Sketch made in Fritzing).
5.2.3 - Drivers
! Chapter 5 - Realisation
!
Figure 32: Wiring diagram for connecting the Pololu A4988 Motor driver [22]
[image:38.595.103.492.278.506.2]!
Figure 33: The Arduino connected to the A4988 driver and the Stepper motor.
5.2.4 - RGB LEDs
During the prototyping phase, RGB LEDs will be added. The LEDs are 5 mm thick cathode with diffuse light. Figure 34 and 35 shows how the RGB LEDs are connected. Each LED has 4 pins, a green, red pin, blue pin and a ground pin. The colour pins will be guarded by a resistor of 330Ω per pin.
!
! Chapter 5 - Realisation
!
Figure 35: The setup of the three RGB LEDs.
5.3 - Software
All the components are controlled with code for the Arduino and the data processing. This section describes the most important parts of the code. Figure 36 shows the different programs and the different actions that will be done in the program.
!
Figure 36: A diagram of actions per program.
5.3.1 - Arduino Code
The Arduino has it’s own IDE, which works with C++. The program Arduino is used to control the mechanism of the visualisation. The most important parts of the code will be explained. The complete code can be found in appendix 6. The Arduino gets it’s data from the computer through the Serial Port. This is a build in function of the Arduino to communicate with a computer. The computer sends an array, which contains the data from the Sociometric Badge to the Arduino. The array contains the headers of the data and the values. More about the data that is sent will be described in chapter 5.3.2.
The function serialRead() reads the data from the serial port and when a “,” or an “/n” is found and splits the data into small pieces of data called substrings. Headers are added to mark the substrings. The substrings are saved into the array called “value”. Value now contains all the substrings with headers that are received from the serial port.
! Chapter 5 - Realisation
A function was made to move the steppers, this function is called setStepper. The data from the Sociometric Badge is loaded into a value for each stepper. The steppers are moved by distracting the position where the stepper needs to move to by the current position. For example when the stepper needs to move to position 1000 but the stepper is already at 400. 1000 - 400 =600 and the stepper moves 600 steps. After moving, the current position will be changed to the new position.
Next to the steppers, there will be RGB LEDs. There are 3 LEDs, each LED has its own variables: The redpin, greenpin and bluepin. To change the colour of the LED the function setColour is used. The value of the red, green and blue pin will be set according to the received data. This function determines the colour of the led by looking at the height of the value. The LED will change into 4 different colours. From blue to red, blue being the value which represents the least amount of interruptions and red being the value representing a large amount of interruptions.
5.3.2 - Processing Code
The data that is received from the Sociometric Badge is transferred into an excel sheet. To send the data to the Arduino IDE a program called Processing which supports java. To read the excel sheet and use the serial port to send it to the Arduino, two libraries are used.
The serial library of processing [24] and the bezier data library [25]. The complete code can be found in appendix 7.
By using the Bezier data library, the xls file is loaded. Based on in which sheet your data is stored, the right sheet will be opened. The program will start by reading the first row of the xls sheet. It reads through the excel sheet by reading through each cell and then going to the next row. The data is put into an array called “val”. These values are multiplied by 20 to get values from 0 till 600. There is a delay to make sure the data is sent properly to the Arduino before skipping to the next row.
A String called output is made and this string is filled with the “val” array and the headers to mark these values. Between the values a “,” is added to separate the values and the information is sent to the Arduino through the serial port.
5.3.3 - Data processing
The Excel sheet that is received from the Sociometric Badge contains a large amount of data which is not used. Therefore its is important to process the data into a simple data sheet. Excel is used to do this. The used data can be found in appendix 8. The original data shows the values per second. This will be summed up per 30 seconds in a new Excel sheet. This can be done with the following formula:
SUM(OFFSET(“sheet that contains the used data”$”First row that contains the data”; (ROW()-ROW(“sheet that contains the used data”$”First row that contains the data”))*30;0;30;1)).
In the case of the excel sheet that is used for the prototypes the formula is:
= S U M ( O F F S E T(t _ s p e e c h _ p r o f i l e 1 ! $ C $ 3 ;(R O W( )- R O W(t _ s p e e c h _ p r o f i l e 1 !
! Chapter 5 - Realisation
By using this formula the new excel sheet will contain the speech and interruption data of all the user per 30 per seconds. This data is summed up to 30 seconds to show more difference between the users and to make the data quicker to show. This can be easily adjusted by changing the 30;0;30;1 to another value.
5.4 - Prototype 1.0
The first prototype is made by laser cutting the mechanism out of wood. The different parts are screwed and glued to each other. For the first prototype, only one stepper motor is used. The stepper motor is connected to the Arduino and the Arduino to the computer. The first stepper motor is tested by a simple code which lets it rotate up and down. The bar moves up and down by the rotation of the gear which is attached to the stepper motor. This can be seen in figure 37.
[image:41.595.151.445.541.749.2]!
!
Figure 37: Movement of prototype 1.0.
5.4.1 - Cut out prototype 1.0
The mechanism is cut out of wood with the use of a laser cutter. 5 mm thick triplex wood was used for prototype 1.0. The design is shown in figure 38.
! Chapter 5 - Realisation
Plate 3 contains hole so the plate can be screwed onto the stepper motor. Plate 2 is glued on top op plate 3 and plate 1 is then glued on top. The gear is attached to the stepper motor with the use of a mounting hub and some small screws. The bar fits between plate 1 and 3 and can now be pushed up and down by the gear.
5.4.2 - Functional Testing Prototype 1.0
[image:42.595.228.371.237.360.2]During the process of making prototype 1.0, minor errors are found and adjusted. This is called functional testing. The first error was found before the plates where glued together. Plate 3 has no support for the bar to move up and down. Therefore another plate was needed, which is shown in figure 39. This plate is glued on top of plate 3 and supports the bar.
Figure 39: Extra cutout for prototype 1.0
When all the plates were glued together, another problem arose. This had to do with the movement of the bar. The gear forced the bar to go up but the gear also tilted the top of the bar to the outside of the mechanism. This would cause problems if a top plate would be attached because the bar would get stuck with the top plate. This could be prevented with little pieces that could connect plate 1 with plate 4 on the right side. The little pieces are also shown in figure 39. The bar sometimes gets stuck between the gap of plate 4. This can be prevented by filling the hole up until the place where the screws stick out.
In the current design, the stepper motor hangs in the air. The thickness of the wooden plates is not strong enough to counterbalance the weight of the stepper motor. Therefore a solution is needed to support the stepper motor. This can be done with the use of another plate like plate 2. Another solution would be to put a block underneath the stepper motor.
! Chapter 5 - Realisation
5.5 - Prototype 2.0
[image:43.595.176.419.229.388.2]Prototype 2.0 is an improved version of prototype 1.0. Both prototypes are showed in Figure 40. Every error that was discovered in the functional testing of prototype 1.0 has been changed. The mechanism is now laser cut out of a 5mm plate of acrylic. The acrylic reflects the light of the LEDs that will be added at a later stage. Prototype 2.0 has a thicker hollow bar, which needs more power to push it up and down. Therefore an extra gear will be added beneath the first one. Both gears will be attached to the same stepper motor. One gear on top op the mounting hub and one on the bottom. Figure 40 shows the new bar and gear.
! !
Figure 40: Prototype 1.0 and 2.0 together on the left and Prototype 2.0 on the right.
At first, only one mechanism is made. If the parts are assembled without errors another two mechanisms will be cut out. In total this makes 3 mechanisms. The first design sketches contained 6 mechanisms because researched showed that this was the best and most efficient number of people to brainstorm with [12][13]. Prototype 2.0 is a proof of concept. If 3 mechanism works then an extra 3 are easy to add. Figure 41 shows the three mechanisms. The top plate is taped to the mechanism instead of glued because the screws still need to be reached.
[image:43.595.87.509.526.715.2]!
!
!
! Chapter 5 - Realisation
One of the user requirements is to make sure that the electronics are not visible to the user. Therefore a top plate will be added. This plate will hide the electronics from the user and will put the focus on the bars and the lights. The top plate is also cut out of 5 mm acrylic. To make sure the electronics are hidden a normal paper is put on the bottom of the acrylic top plate. The hexagon plate is divided into 6 partitions and shown in figure 41. These partitions all represent a user. For this prototype as already explained only 3 users will be able to get feedback.
5.5.1 - Cutout Prototype 2.0
[image:44.595.100.491.181.407.2]!
Figure 42: Cutout of plastic for one mechanism of prototype 2.0
The bars are now thicker and hollow. To realise this a clicking system is needed. This also makes it easy to access the back of the bar where the LED will be put. The bottom plate that is attached to the stepper motor now has more surface to prevent the bar from getting stuck. Figure 42 shows the cutout for one mechanism.
5.5.2 - Adding RGB LEDs
! Chapter 5 - Realisation
Figure 43: The RGB LEDs inside of the bars
![Figure 1: The Creative Technology Design Process [2].](https://thumb-us.123doks.com/thumbv2/123dok_us/9753685.476372/10.595.169.411.387.725/figure-creative-technology-design-process.webp)
![Figure 4: The visualisation on the phone of the Meeting Mediator [16].](https://thumb-us.123doks.com/thumbv2/123dok_us/9753685.476372/18.595.212.381.579.685/figure-visualisation-phone-meeting-mediator.webp)
![Figure 5: The visualisation of the data on the screen(left), the setting(middle) and the playback visualisation shown afterwards (right) [17]](https://thumb-us.123doks.com/thumbv2/123dok_us/9753685.476372/19.595.142.454.406.543/figure-visualisation-screen-setting-middle-playback-visualisation-shown.webp)
![Figure 7: The visualisation of the UMF [18].](https://thumb-us.123doks.com/thumbv2/123dok_us/9753685.476372/20.595.220.347.89.206/figure-visualisation-umf.webp)