Master Thesis
Deposit Funding in the
Euro Area
Determinants of deposit funding demand and supply:
an explorative study on Euro Area bank deposit fund
ing levels and Rabobank’s prospects of increasing its
Euro Area deposit funding.
Martijn Driesprong
MD
r
Deposit Funding in the Euro Area
A thesis submitted in partial fulfilment of the requirements for the degree of
Master of Science in Industrial Engineering & Management
by M. Driesprong
Utrecht, October 22, 2015
University of Twente
Faculty School of Management and Governance
Study program Industrial Engineering & Management
Master track Financial Engineering & Management
Technology Venturing & Innovation Management
Graduation committee
University of Twente Dr. B. Roorda
Dr. R.A.M.G. Joosten
S
U M M A RY
Developments in the Euro Area deposit funding markets, their driving factors and opportunities and difficulties for Rabobank in these markets are the three main topics of this study. We find evidence for a renewed post-crisis importance of deposits as an important bank funding source and conclude that banks have changed their perspective on deposits. Involvement in lending activities has proven an important determinant in banks’ funding ability between 1999 and 2013. Pre-crisis bank lending activi ties preceded deposit funding while post-crisis banks attracted deposit funding first before granting new loans. This shift indicate higher reliance on deposit funding and a return to traditional banks activities. Moreover, this study shows that bank business models are important determinants for banks’ deposit funding ability.
Research approach – Despite the importance of deposit funding for banks, the issue has received little attention in research. Based on a literature study, we identified potential determinants for bank deposit funding levels which we categorized by bank demand or deposit supply perspectives. We composed a dataset with country-level, regulatory bank balance sheet data (12 countries), a dataset with bank-level, accountancy bank balance sheet data (565 banks) between 1999-2013 and collected additional data on the potential deposit supply determinants. Time-dependent regressions were deployed to examine changes in deposit funding levels and associated determinants.
Main findings – We focussed our analysis on two main areas. First, we explored the dynamics of the deposit funding market and second we analysed relationships between deposit funding levels and the identified determinants. We found that Euro Area banks have increased their deposit funding levels in the between 1999 and 2013. This growth was time-invariant although the growth decreased post-crisis. Moreover, we found significant differences in deposit funding levels across countries and across bank business orientation. Banks in Northern Euro Area countries and investment-oriented banks have con siderable higher deposit funding levels than their Southern Euro Area and retail-oriented counterparts.
Lending activities are an important factor for banks’ deposit funding levels. The relationship between lending and deposit funding levels is consistent over time although differences in pre-crisis and post-crisis behaviour exist. In the short run, banks adjust their deposit funding levels after changes in loan levels but not the other way around; on the long run a reciprocal relationship is observed. Post-crisis the long run equilibrium relationship dissipated and banks focused primarily on increasing their deposit funding levels, regardless of their lending activities. Other important demand factors for deposit funding levels include deposit funding variability, bank risk, both negatively related, and bank size, positively related to deposit funding levels. Market power was not found influential on deposit funding levels. Important factors from a deposit supply perspective include national income (positive), housing prices (negative) and median age (positive). These findings extent classic money demand theory towards the demand of bank deposit services and hence deposit funding supply.
Recommendations – In answering our Research Question “What are Rabobank’s difficulties and oppor tunities for increased deposit funding in the Euro Area” we made four main recommendations. First, Rabobank might benefit from stabilizing their deposit funding variability and bank risk profile. Deposit funding variability is significantly higher than banks in a Euro Area peer group and as a result of highly volatile return on assets, Rabobank report relative high levels of bank riskiness. Second, Rabobank might benefit from increased exploitation of the lending-deposit taking relationship. Post-crisis Euro Area banks have shifted their attention towards this core activity which resulted in a higher reliance and stronger demand for deposit funding. Third, Rabobank might benefit from maintained bank size. Euro Area banks have drastically decreased their bank size post-crisis while their deposit funding lev els increased. Fourth, Rabobank might explore Spain and Portugal as sources for deposit funding. The relative higher ageing, lower housing prices and lower economic sentiments in these countries are favourable characteristics for higher levels of deposit funding.
P
R E FAC E
In 2006, I started my academic training in Civil Engineering at the University of Twente. Since then, I walked different paths in life and study. Now, exactly nine years later and with a second thesis on Innovation and Entrepreneurship on the way, I am writing the final words of my master thesis Financial Engineering & Management.
For this thesis, I have been engaged in a seven-month internship at the Special Projects team of Control Rabobank Group (CRG) in Utrecht. I am grateful to Carolien van Eggermond who has provided me with this opportunity. It has given me exactly what I was looking for: a glimpse into all major and minor details that keep a large bank afloat. A special acknowledgement goes out to Allard Bruinshoofd who allowed me to accompany him on his in-depth exploration of these major and minor details and provided me with excellent feedback and support during the development of this thesis. I would be remiss not to thank Annemarie, Himet, Jeroen, William and the CRG staff for their hospitality and time in their incredible busy schedule.
I also thank my supervisors from the University of Twente for their involvement. I admire how Berend Roorda develops, organizes and teaches the Financial Engineering & Management track while making time available for valuable feedback and debates. The thorough and elaborate feedback from Reinoud Joosten was invaluable to the completion of this thesis.
In Dutch fashion, I saved ‘the best for last’. This thesis is not only my final deliverable for obtaining a Master of Science degree in Industrial Engineering & Management at the University of Twente, it also marks a long unwished-for, but now highly anticipated start of new paths. Laura, thank you for your patience and support and I am looking forward to our new paths together.
Martijn Driesprong
Utrecht, August 2015
“Other things may change us, but we start and end with family” (Anthony Brandt)
Contents
Page
Summary i
Preface ii
1 Research Design 1
1.1 Introduction . . . 2
1.2 Problem statement . . . 3
1.3 Relevance . . . 4
1.4 Scope . . . 5
1.5 Thesis outline . . . 5
2 Banks’ Deposit Demand 7 2.1 How bank fund themselves . . . 8
2.1.1 Changed funding patterns . . . 10
2.2 Why banks fund with deposits . . . 11
2.2.1 Economic function . . . 12
2.2.2 Regulation . . . 14
2.2.3 Bank business model . . . 17
2.2.4 Competition . . . 21
3 Banks’ Deposit Supply 25 3.1 Why individuals use deposit services . . . 26
3.1.1 Transaction motive . . . 26
3.1.2 Precautionary motive . . . 27
3.1.3 Speculative motive . . . 28
4 Methods & Data 31 4.1 Explorative analysis on bank deposit funding levels . . . 32
4.1.1 Methods . . . 32
4.1.2 Data . . . 35
4.2 Regression analysis on bank deposit funding levels . . . 39
4.2.1 Methods . . . 41
4.2.2 Data . . . 45
5 Explorative Analysis of Euro Area Deposit Funding 51 5.1 Euro Area time series . . . 52
5.2 Cross-sections . . . 54
5.2.1 Country-level cross section . . . 55
5.2.2 Bank-level cross-section . . . 59
5.3 Conclusion . . . 62
6 Regression Analysis of Euro Area Deposit Funding 65 6.1 Banks’ economic function in the Euro Area . . . 66
6.2 Deposit funding and demand and supply factors . . . 69
6.3 Conclusion . . . 74
7 Discussion and Conclusion 75 7.1 Main results . . . 76
7.2 Discussion . . . 78
7.3 Limitations and further research . . . 79
7.4 Managerial implications . . . 80
Bibliography 82
Appendices
A Methodology A1
A.1 Controlling for spuriousness in panel data regressions . . . A1 A.2 VECM methodology . . . A2 A.3 Fama-MacBeth regressions . . . A3
B Data Description A4
B.1 Description of country-level bank data . . . A4 B.2 Description of bank-level bank data . . . A8 B.3 Coverage between country- and bank-level data . . . A12 B.4 Summary statistics bank business orientations . . . A15
C Euro Area Aggregate Graphs A16
C.1 Aggregated assets and liabilities in the Euro Area . . . A16
D Euro Area Country Graphs A18
D.1 Balance sheets of Euro Area countries . . . A18 D.2 Balance sheets of Euro Area countries . . . A25 D.3 Loan-to-deposit ratios in the Euro Area . . . A29
E Euro Area Bank-level Graphs A31
E.1 Scatter plots bank level assets and liability classes over total assets . . . A31 E.2 Histograms bank-level asset and liability classes . . . A33 E.3 Cluster tree . . . A34 E.4 Transformation deposit funding and loan levels . . . A35
F Unit Root Test Results A37
F.1 Country-level unit root tests . . . A37 F.2 Country-level unit root tests with structural break . . . A44
G VECM Estimation Results A45
H Multivariate Regression Results A49
List of Figures
Page
1 Research Design 1
1.2.1 Research model . . . 4
2 Banks’ Deposit Demand 7 2.1.1 Breakdown of bank liabilities . . . 9
2.1.2 Euro Area bank balance sheet (1999-2014) . . . 10
2.2.1 Euro Area bail in waterfall . . . 15
3 Banks’ Deposit Supply 25 4 Methods & Data 31 4.1.1 Number of banks by year . . . 39
4.2.1 Theoretical framework of factors influencing bank deposit funding levels . . . 41
5 Explorative Analysis of Euro Area Deposit Funding 51 5.1.1 Monthly Euro Area bank deposit funding levels (1999-2013) . . . 52
5.2.1 Country-level distribution Euro Area deposit funding levels . . . 56
5.2.2 Country-level structural break unit root tests . . . 57
5.2.3 Country-level histograms deposit funding levels (Measure A) . . . 58
5.2.4 Country-level histograms deposit funding levels (Measure C) . . . 58
5.2.5 Average bank-level bank balance sheet . . . 60
5.2.6 Spider diagram bank business orientations . . . 61
5.2.7 Bank-level histograms deposit funding levels by bank business orientation . . . 62
5.2.8 Yearly transitions in bank orientation . . . 63
5.2.9 Box plot of deposit funding levels across bank orientation . . . 64
5.2.10 Box plot of deposit funding levels across bank orientation . . . 64
6 Regression Analysis of Euro Area Deposit Funding 65 6.2.1 Number of banks by country and year . . . 72
7 Discussion and Conclusion 75 7.4.1 Average HPI, AGE and ESI in the Euro Area . . . 81
Appendices
Methodology A1
A Data Description A3
B.1 Coverage total assets and deposit funding country and bank-level data . . . A12
B.2 Coverage total assets country and bank-level data . . . A13
B.3 Coverage deposit funding country and bank-level data . . . A14
B Euro Area Aggregate Graphs A16
C.1 Issued debt and capital in the Euro Area . . . A16
C.2 Deposit funding and interbank liabilities in the Euro Area . . . A16
C.3 Loans and other liabilities in the Euro Area . . . A17
C.4 Advances to banks and securities in the Euro Area . . . A17
C.5 Total assets and other assets in the Euro Area . . . A17
C Euro Area Country Graphs A18
D.1 Balance sheet Austria (1999-2013) . . . A18 D.2 Balance sheet Belgium (1999-2013) . . . A19 D.3 Balance sheet Finland (1999-2013) . . . A19 D.4 Balance sheet France (1999-2013) . . . A20 D.5 Balance sheet Germany (1999-2013) . . . A20 D.6 Balance sheet Greece (1999-2013) . . . A21 D.7 Balance sheet Ireland (1999-2013) . . . A21 D.8 Balance sheet Italy (1999-2013) . . . A22 D.9 Balance sheet Luxembourg (1999-2013) . . . A22 D.10 Balance sheet the Netherlands (1999-2013) . . . A23 D.11 Balance sheet Portugal (1999-2013) . . . A23 D.12 Balance sheet Spain (1999-2013) . . . A24 D.13 Deposit funding levels Austria and Belgium (1999-2013) . . . A25 D.14 Deposit funding levels Finland and France (1999-2013) . . . A26 D.15 Deposit funding levels Germany and Ireland (1999-2013) . . . A26 D.16 Deposit funding levels Italy and Greece (1999-2013) . . . A27 D.17 Deposit funding levels the Netherlands and Portugal (1999-2013) . . . A27 D.18 Deposit funding levels Spain and Luxembourg (1999-2013) . . . A28 D.19 Loan-to-deposit ratio in Austria, Belgium and Finland (1999-2013) . . . A29 D.20 Loan-to-deposit ratio in France, Germany and Ireland (1999-2013) . . . A29 D.21 Loan-to-deposit ratio in Italy, Greece and the Netherlands (1999-2013) . . . A30 D.22 Loan-to-deposit ratio in Portugal, Spain and Luxembourg (1999-2013) . . . A30
D Euro Area Bank-level Graphs A31
E.1 Capital and issued debt over total assets . . . A31 E.2 Interbank and deposit funding over total assets . . . A31 E.3 Other and trading liabilities over total assets . . . A32 E.4 Loans and securities over total assets . . . A32
E.5 Advances to banks and other assets over total assets . . . A32
E.6 Histograms bank-level total assets . . . A33 E.7 Histograms bank-level asset and liability classes . . . A34 E.8 Dendrogram of bank clusters in the Euro Area . . . A34 E.9 Transformation of deposit funding levels . . . A35
E Unit Root Test Results A35
E.10 Transformation of loan levels . . . A36
F VECM Estimation Results A45
G Multivariate Regression Results A49
H Results Residual Tests A53
List of Tables
Page
1 Research Design 1
1.1.1 Aggregate balance sheet of the EU and EA . . . 2
1.1.2 Number of MFIs in the EU and EA . . . 3
1.2.1 Research Question and sub-questions . . . 3
2 Banks’ Deposit Demand 7 2.1.1 Key characteristics of funding sources. . . 8
2.2.1 Deposit guarantee schemes in the Euro Area . . . 16
2.2.2 Elements of bank business models . . . 18
2.2.3 Different business models . . . 19
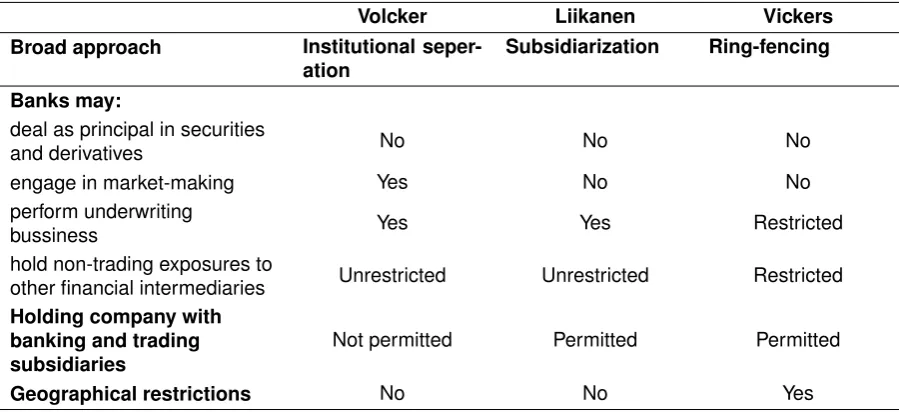
2.2.4 Volcker, Liikanen and Vicker’s structural reform proposals . . . 22
3 Banks’ Deposit Supply 25 3.1.1 Definition of euro area monetary aggregates . . . 26
4 Methods & Data 31 4.1.1 Cases for unit root tests . . . 34
4.1.2 Euro Area country-level data bank balance sheet description . . . 36
4.1.3 Euro Area bank-level financial statement data description . . . 37
4.1.4 Summary statistics of country level Euro Area bank data . . . 40
4.1.5 Summary statistics of bank level Euro Area bank data . . . 40
4.2.1 Residual cross product matrix . . . 44
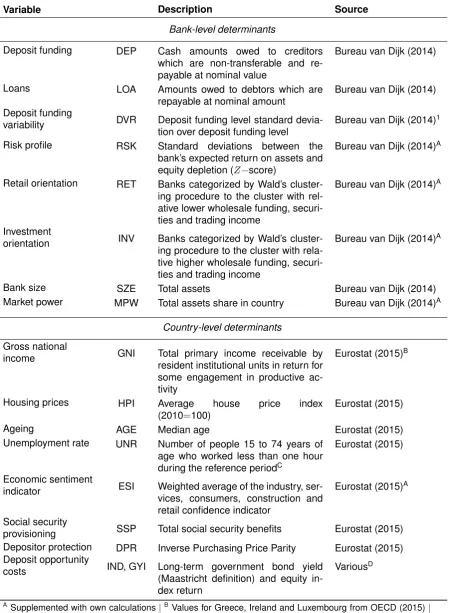
4.2.2 List of variables . . . 47
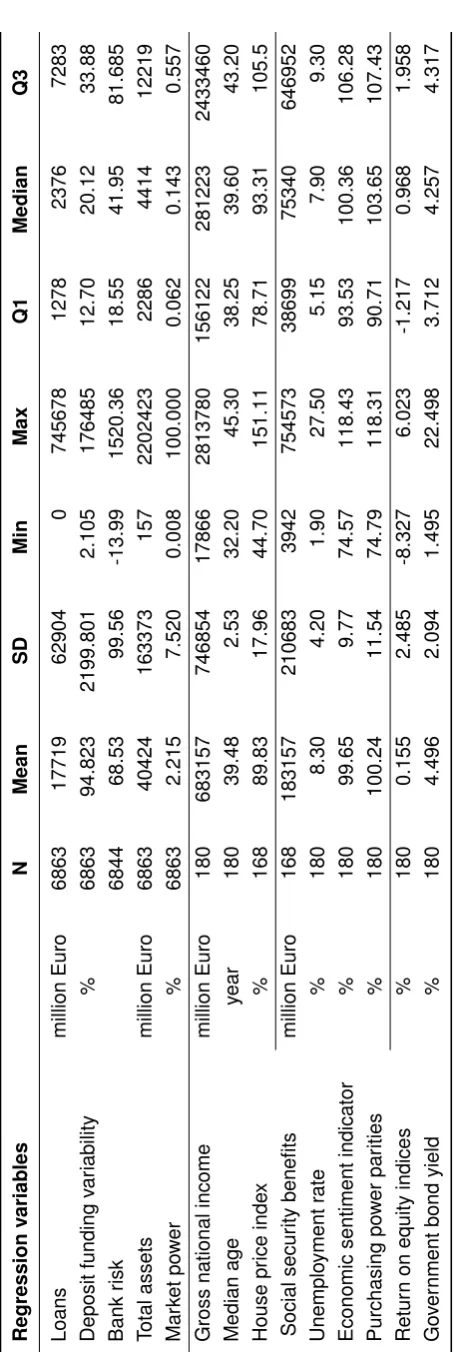
4.2.3 Summary statistics of regression variables . . . 49
5 Explorative Analysis of Euro Area Deposit Funding 51 5.1.1 Euro Area Phillips-Perron unit root test results . . . 53
5.1.2 Euro Area Zivot-Andrews and Clementes-Montanes-Reyes test results . . . 53
5.1.3 Country-level deposit funding level descriptives . . . 54
5.2.1 Country-level Phillips-Perron unit root test results . . . 57
5.2.2 Country-bank level comparison total assets and deposit funding . . . 59
5.2.3 Cluster analysis results . . . 61
6 Regression Analysis of Euro Area Deposit Funding 65 6.1.1 Results unit root test bank-level Euro Area deposit funding and loan levels . . . 66
6.1.2 Results cointegration test bank-level Euro Area deposit funding and loan levels . . . 67
6.1.3 Full sample CE and VECM estimation results . . . 67
6.1.4 Cointegration correction coefficients . . . 68
7 Discussion and Conclusion 75
7.4.1 Ten-year average deposit funding levels for Rabobank and its peer group . . . 80
Appendices
Methodology A1
A Data Description A3
B.1 Aggregated summary statistic country bank assets (1997-2013) . . . A5
B.2 Aggregated summary statistic country bank liabilities (1997-2013) . . . A7
B.1 Summary statistics panel bank balance sheet data (1999-2013) . . . A11
B.2 Key characteristics of clusters . . . A11
B.1 Key bank-level characteristics by bank business orientation . . . A15
B Euro Area Aggregate Graphs A16
C Euro Area Country Graphs A18
D Euro Area Bank-level Graphs A31
E Unit Root Test Results A35
F.1 Country-level Phillips-Perron unit root test results (case 1; level) . . . A38
F.2 Country-level Phillips-Perron unit root test results (case 1; difference) . . . A39
F.3 Country-level Phillips-Perron unit root test results (case 2; level) . . . A40
F.4 Country-level Phillips-Perron unit root test results (case 2; difference) . . . A41
F.5 Country-level Phillips-Perron unit root test results (case 3; level) . . . A42
F.6 Country-level Phillips-Perron unit root test results (case 3; difference) . . . A43
F.1 Country-level Zivot-Andrews and Clementes-Montanes-Reyes unit root test results . A44
F VECM Estimation Results A45
G.1 Results of VECM estimation . . . A46 G.2 Results of VECM estimation (investor orientation) . . . A47 G.3 Results of VECM estimation (retail orientation) . . . A48
G Multivariate Regression Results A49
H.1 Correlation matrix . . . A50
H Results Residual Tests A53
C
HAP TE R
1
1.1 Introduction
The aggregate balance sheet of the European Union and the Euro Area reflects the importance of
deposit funding for banks (see Table 1.1.1). Within the European Union, non-MFI1 deposits amount up
to 38 per cent of monetary financial institution (MFI) funding which is approximately sufficient to fund
outstanding non-MFI loans. For credit institutions2 (CIs) the deposit and loan ratios are nearly identical
to those of MFIs since credit institutions amount for 88 per cent of the number of MFIs in the European Union and 96 per cent in balance size (see Table 1.1.2). The balance sheet of the European Union and the Euro Area also show great similarity. The major differences in other assets and other liabilities are a result of a 6 per cent decrease in the share of external assets and external liabilities within the Euro
Area. This reflects the integration financial markets within the Euro Area into one currency.3
Problem context – Deposit funding is regarded as an important means of stable funding by international
institutions, legislators and regulators, rating agencies and academics.4 This characteristic of deposit
funding is especially important for deposit-funded banks which are more sensitive to decreasing deposit ratios than with large ratios of wholesale funding (Köhler, 2014, p. 212). Rabobank is one of those banks since 49 per cent of their total liabilities consists of funds entrusted of which 44 per cent are retail customer deposits (Rabobank, 2013a, p. 11).
Since the recent crisis, increased capital and bail-in requirements, additional liquidity ratios and the harmonization of deposit guarantee schemes forced banks to evaluate and improve the stability of their funding profiles and especially their deposit funding activities (European Parliament and Council, 2013c; European Commission, 2014b). Rabobank recently launched their strategic framework 2013 2016 which aims at a one billion Euro cost reduction through standardization and virtualization, slower growth of international wholesale, increased capitalization and a decrease of the loan to deposit ratio to 130 per cent through growth of international direct banking activities (Rabobank, 2013a, p. 19 22). Rabobank’s department Control Rabobank Group (CRG) is responsible for monitoring changes in the bank’s environment (e.g., regulation, behaviour of other competitors, customers and markets), translation of these developments in consequences and opportunities for the Rabobank and advising alternative measures to the bank’s management. Hence, CRG is interested in the consequences of the recent developments in the deposit market on the bank’s deposit funding ability. However, the factors influencing the deposit funding market are complex.
1 Monetary financial institutions (MFIs) are central banks and organizations in the European Union that accept deposits from
the public or offer notional protected savings accounts (e.g. money market funds). MFI deposits are generally referred to as interbank funding and therefore not included as deposit funding
2 A credit institution is an organization which undertakes the business of which is to take deposits or other repayable funds from
the public and to grant credits for its own account.
3 External assets and liabilities are those assets and liabilities which are held and owed in foreign currencies.
4 The IMF (2013, p. 106), BIS (2013, p. 67-68), European Parliament and Council (2013c, p. 251) include examples from
legislation and regulation, Standard & Poors (2011, p. 35-36), Moodys Investor Service (2013, p. 21, 28-29), Fitch Ratings (2014, p. 28) emphasize on the importance from a rating agency’s perspective and Van den End (2013, p. 16), Cecchetti, King, and Yetman (2011, p. 10) – amongst others – emphasize on the importance of deposits for stable funding from an academic perspective.
Assets MFI CI Liabilities MFI CI
EA EU EA EA EU EA
Loans 38% 38% 39% Capital 8% 8% 8%
Securities 19% 17% 19% Issued debt 16% 15% 14%
Advances to banks 17% 16% 17% Interbank liabilities 18% 16% 19%
Other assets 25% 30% 25% Deposit liabilities 36% 35% 37%
Other liabilities 22% 26% 21%
MFIs CIs MMFs Other MFIs CBs
Euro Area 6,717 5,846 814 39 18
European Union 8,746 7,727 943 47 29
Table 1.1.2: Number of monetary financial institutions (MFIs), stratified in credit institutions (CIs), money market funds (MMFs), central banks (CBs) and other MFIs in the European Union and Euro Area at the end of April 2014 (ECB, 2014).
1.2 Problem statement
The increased regulatory pressure and Rabobank’s strategic framework towards 2016 underscore the importance of deposit funding for Rabobank. With this study, we examine the dynamics in the Euro Area deposit funding market and influencing factors and use the results to highlight opportunities for
Rabobank in the Euro Area deposit funding market. The research goal is formulated accordingly:
Research goal To assess, given Rabobank’s strategic framework and recent developments in reg
ulation, Rabobank’s prospects of increasing its Euro Area deposit funding by obtaining insights in the main determinants of deposit funding and recent changes in the deposit funding market.
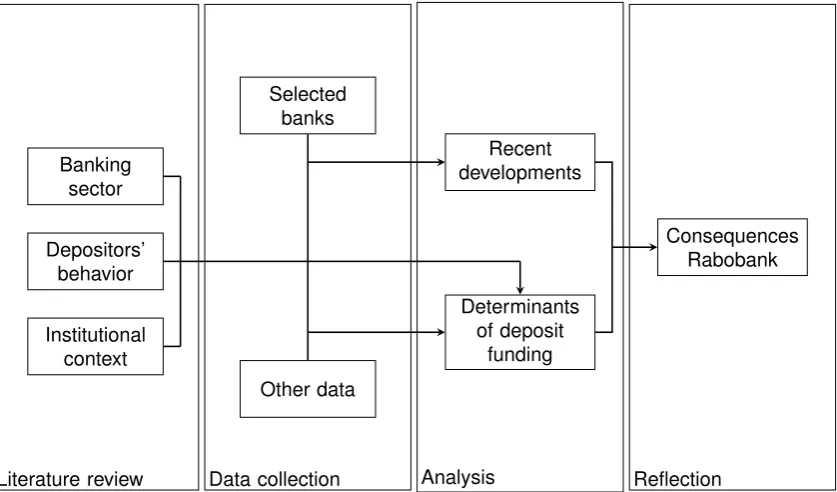
This goal is reflected in our main research question which is illustrated in Figure 1.2.1:
Research question What are Rabobank’s difficulties and opportunities for increased deposit fund
ing in the Euro Area?
In order to answer this main research question, four sub-questions are specified guiding our analysis of the Euro Area Deposit funding market and supporting reflection on the main research question (see Table 1.2.1). Sub-Question 1 enables us to connect to existing literature. In conjunction with economic theory, we distinguish two points of view: the bank demand for deposits and customer supply of de posits. We review existing literature to identify and discuss potential determinants influencing deposit funding from both perspectives. Throughout the literature review, we develop hypothesis for the relation ships between the identified determinants and deposit funding which provides a basis for a conceptual framework with determinants of deposit funding levels.
With Sub-Question 2, we focus on the context of the Euro Area deposit funding market. We construct a database with country-level and bank-level bank balance sheets and explore recent developments in Euro Area deposit funding market. This context provides background for our examination of the rela tionship between deposit funding and identified determinants (Sub-Question 3). We develop measures to test hypotheses, collect data and consequently execute the hypotheses tests. Finally, when the de terminants, the relationship between the determinants and deposit funding and recent developments in the Euro Area deposit funding market are established, we reflect on these findings and highlight opportunities and difficulties for increased Euro Area deposit funding by Rabobank (Sub-Question 4).
Research Question What are Rabobank’s difficulties and opportunities for increased deposit funding in the Euro Area?
Literature review 1. What are the main determinants for Euro Area bank deposit funding lev
els?
Analysis 2. What are the recent changes in Euro Area bank funding profiles?
3. How do the identified determinants relate to the Euro Area bank deposit funding levels?
Reflection 4. How can Rabobank learn from our research and increase their Euro Area
deposit funding level?
Table 1.2.1: Main research question and sub-questions.
Literature review Banking
sector
Depositors’ behavior
Institutional context
Data collection Selected
banks
Other data
Analysis Recent developments
Determinants of deposit
funding
Reflection
[image:18.595.89.508.89.335.2]Consequences Rabobank
Figure 1.2.1: Research model (adapted from Verschuren & Doorewaard, 2004, p. 87).
1.3 Relevance
Knowledge gap – Research on the supply of money can be traced back to the development of the
quantity theory of money which links the supply of money to the price level (i.e. see Newcomb, 1886; Keynes, 1936). Following the Keynesian school of thought, different scholars related money supply to capital – following Friedman’s (1963) wealth spectrum approach – while more recent studies focus on the empirics of money demand model estimation (De Bondt, 2009, e.g., Arnold & Roelands, 2010). This stream of research, however, focusses on the macro-economic determinants and dynamics of monetary aggregates on a national level without implications for availability of deposits on a bank-level.
In more recent years, research on bank deposits focussed on the importance of deposit liabilities for bank stability (e.g., see Köhler, 2014; Beck, De Jonghe, & Schepens, 2013), customer protection (e.g., see Demirgüç-Kunt & Detragiache, 2002; Anginer, Demirguc-Kunt, & Zhu, 2014; Huizinga & Nicodème, 2006) and in relation to other funding sources (e.g., see Demirgüç-Kunt & Huizinga, 2010; Craig & Dinger, 2013). However, these studies disregard the impact of country and bank-specific factors on the availability of deposit funding levels.
Scientific contributions – In light of increased emphasis on deposit funding, the absence of a
bank-level overview of factors influencing deposit funding is impeding our understanding of the dynamics in the deposit market. We examine potential determinants of deposit levels and address the implications for bank’s funding ability. We focus on recent years and include the years since the recent financial crisis. This enables us to specifically include impact of further harmonization of deposit guarantee schemes on the retail operations of Euro Area banks.
Managerial contributions – Rabobank is with 83 per cent of its loans outstanding primarily exposed
1.4 Scope
As discussed in Chapter 4, we obtain our data through the ECB Statistical Datawarehouse (ECB, 2014) and Bureau van Dijk’s Bankscope (2014) database. We are interested in Rabobank’s ability to fund with Euro deposits with a special focus on recent developments. Hence, we focus on banks in countries that were member of the Euro Area at the beginning of the recent financial crisis: Austria, Belgium, Fin land, France, Germany, Greece, Ireland, Italy, Luxembourg, Netherlands, Portugal and Spain. Deposit funding is central to this study, hence we only include banks who report deposit funding levels in the subsequent years from 2008 to the last available year but gather all available data from 1999 onwards. This set-up increases the survivor bias but is in line with our aim to make useful comments on recent developments. Furthermore, we limit our analysis to banks with a balance sheet size of EUR 1.5 billion in order to limit the influence of outlier banks in our analysis. Different data sources are deployed to examine deposit funding from a bank-level (accounting) and country-level (regulatory) perspective.
1.5 Thesis outline
The thesis outline is structured as followed. First we identify potential determinants for bank deposit funding with use of a literature review. We base this review on scientific articles and discussion papers from the banking sector – mainly from regulators working in close cooperation with bank research departments – and report results in Chapter 2 and Chapter 3. In Chapter 4, methods for hypothesis testing, data collection and data treatment is discussed.
In Chapter 5, we focus on Sub-Question 2 and create an overview of the Euro Area deposit funding mar ket and recent developments. In Chapter 6 we complement this overview with an empirical examination of potential determinants for deposit funding levels. By way of synthesis, Chapter 7 includes an overview of our main findings. We discuss the connection to existing literature, provide with directions for future research and reflect on the main research question with a discussion on managerial implications.
C
HAP TE R
2
B
A N K S
’ D
E P O S I T
D
E M A N D
This chapter is concerned with Sub-Question 1:
“What are the main determinants for Euro Area deposit funding?”
2.1 How bank fund themselves
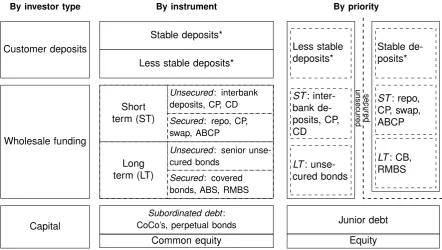
Banks are the only institutions permitted to attract deposit funding from the public in the Euro Area (European Parliament and Council, 2013a, p. 355). Consequently, bank funding consists of deposit liabilities but these are not their only funding source. Bank funding sources may be typified by maturity, risk profile and fund provider (see Figure 2.1.1); but a differentiation in funding by funds provider – including capital, wholesale funding and deposit funding – is most common. These types of funding also vary by loss-absorption and risk-bearing capacity, cost of funding, informedness of the fund providers and stability.
Capital – Capital is the residual value of the bank in the event of liquidation and is first in line for
risk-and loss-absorption (ECB, 2012, p. 84). End of April 2014, capital risk-and reserves amounted up to 8 per
cent of the aggregate Euro Area bank liabilities.1 Capital comprises the bank’s equity, non-distributed
funds and reserves for risks associated with the business activities and is the bank’s primary source of risk-absorption. Providers of capital are financially informed decision makers and include shareholders, bank’s own operations and some types of subordinated (‘junior’) risk-bearing debt. Although capital is a stable source of funding, it is also expensive since providers of capital demand higher returns for the
associated higher risk.2
Wholesale funding – Wholesale funding is provided by informed institutional investors which include
pension funds, insurers, money market funds and other banks. Wholesale funding includes interbank deposits, issued debt, trading liabilities and money market funds. In the Euro Area, wholesale funding provides in aggregate 54 per cent of bank funding needs and was regarded relatively stable prior to the recent financial crisis. Since then a large reliance on wholesale funding is considered hazardous as it increases the exposure to market shocks as investors have the ability to withdraw funds at the first negative market signals (Van Rixtel & Gasperini, 2013, p. 3). This altered perspective and the increased volatility of wholesale funding is mainly due to a change in risk perception as in some cases the legal obligation to repay wholesale funding was not met. This perspective was later formalized in Euro Area regulation on bank resolution (European Parliament and Council, 2013b).
The fleetingness of wholesale funding is also an attractive characteristic as it allows banks to manage
the balance sheet size pro-cyclical and fills the funding gap.3 As such, wholesale funding is used as
an additional source for funding needs that exceed the relative stable capital, reserves and deposit funds. Reliance on wholesale funding is in general inevitable as the availability of other funding sources
is limited by their costs and country-specific social structures.4Attracting wholesale funding involves
expensive activities related to accountability, reporting, investor relations and maintaining an active dealer network for the issued debt to ensure a liquid market. These mainly fixed costs require a certain bank size for wholesale funding to become an attractive source of funding.
1Aggregated Euro Area bank balance sheets data obtained from Statistical Data Warehouse (ECB, 2014). Figure 2.1.2 shows
increased capital levels in Euro Area bank funding profiles from 5.5 per cent in 2008 to 8 per cent in 2014.
2The financial informedness of providers refers to the providers’ ability to assess the banks’ riskiness and mitigate potential
information asymmetries (Freixas & Rochet, 1997, p. 1).
3The funding gap refers to the inability of banks to fund outstanding loans with deposits. See for example Ayadi, Arbak, and De
Groen (2011, p. 12), Le Leslé (2012, p. 9), Van den End (2013, p. 2).
4For example, the availability of deposit funding is lower in countries with large mandatory pension systems.
Capital Wholesale funding Deposit funding
Provider’s informedness Informed Informed Uninformed
Risk- and loss-absorption Full Limited None
Cost of funding 8–12% 6–10 % 0-3%
Stability High Intermediate to low High
Volume 8% 54% 38%
By investor type By instrument By priority
Customer deposits
Wholesale funding
Capital
Stable deposits*
Less stable deposits*
Short term (ST)
Long term (LT)
Unsecured: interbank deposits, CP, CD
Secured: repo, CP, swap, ABCP
Unsecured: senior unse cured bonds
Secured: covered bonds, ABS, RMBS
Subordinated debt : CoCo’s, perpetual bonds
Common equity
Less stable deposits*
Stable de posits*
ST : repo, CP, swap, ABCP
LT : CB, RMBS
ST : inter bank de posits, CP, CD
LT : unse
cured bonds
Junior debt
Equity
secured
[image:23.595.73.516.97.347.2]unsecured
Figure 2.1.1: Breakdown of bank liabilities (adapted from IMF, 2013, p. 108). (*) Stable or secured deposits are those which are covered by deposit guarantee schemes (DGSs).
Deposit funding – Deposits are ‘amounts which are owed to creditors (...) which are not negotiable
[standardized products] and not marketable’ (ECB, 2012, p. 66) and provided by uninformed decision
makers, i.e. mainly households and small and medium enterprises.5The non-marketability of the de
posit liabilities refers to restrictions on the transfer of legal ownership and accounts for the absence of an organized market for deposits and hence to a great extent the stability of deposit funds as banks are unable to trade these deposits (e.g., see BIS, 2013; BIS, 2014). Furthermore, deposits are largely exempt from loss-absorption by deposit guarantee schemes as it is assumed that providers of retail deposit funding make less informed financial decisions opposed to providers of other funding sources. However, stability of deposit funding increases while regulatory preferential treatment of deposits de creases depositors’ incentives to monitor bank riskiness and ultimately to change banks’ risk-taking behaviour.
In the Euro Area, deposits form the primary funding source of many banks with a median deposit level over total liabilities of 60% in the last 5 years. End of April 2014, the aggregate deposit volume in
the Euro Area amounted 38 per cent of the banks’ total liabilities.6 A breakdown by maturities include
overnight deposits (46%), deposits with an agreed maturity (28%) and deposits redeemable at notice (26%). In some instances repurchase agreements (repos) are also referred to as deposit funding; how ever we exclude repos from our definition of deposit funding as repurchase transactions are negotiable and often represent transferable liabilities.
Before the crisis, deposits proved an inexpensive source of funding with spreads of 300 basis points under one-year Euribor rates (ECB, 2014). Nowadays, the spreads have diminished to 10 basis points, mainly due to a drop in wholesale funding costs but also as a result of increased costs of attracting retail deposits.
5Corporations and other non-households may also hold deposits (23%). However, these deposits are less stable by nature since
these often employ more sophisticated strategies to manage their cash positions which involve higher portions of wholesale funding and short-term deposit positions. Households hold twice as much of their deposits in long-term deposits and less in overnight deposits (41%) than corporations (66%).
6The difference between the median and aggregate measure of relative deposit funding levels is partly caused by different data
sources – accounting and regulatory data respectively – and might be the result of differing dependence on deposit funding across bank sizes.
0.00
0.20
0.40
0.60
0.80
1.00
Assets (% Total assets)
1997 2001 2004 2008 2011 2015
Year
Loans Securities
Advances to banks Other assets
0.00
0.20
0.40
0.60
0.80
1.00
Liabilities (% Total assets)
1997 2001 2004 2008 2011 2015
Year
Capital Deposit funding
[image:24.595.89.509.104.403.2]Wholesale funding Other liabilities
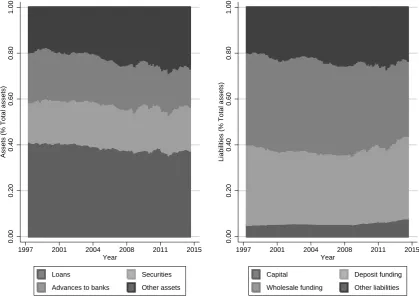
Figure 2.1.2: Asset and liabilities levels in Euro Area bank balance sheets between 1999-2014.
Conclusion – Banks fund with a wide variety of financial instruments which differ in risk-return char
acteristics, stability and their regulatory treatment. Capital is expensive, full risk- and loss-absorbing funding while wholesale funding provides limited loss-absorption against lower funding costs. Whereas capital providers are severely limited in their ability to withdraw their funding, wholesale funding is more flexible but also less reliable. Both capital and wholesale funding providers are considered informed financial decision makers and do not receive special regulatory protection. In contrast, depositors are considered uninformed and deposit funding receives regulatory preference in insolvency procedures. As a result, deposits are stable, generally not loss-absorbing and relatively inexpensive.
2.1.1 Changed funding patterns
Deposit funding levels in the Euro Area bank balance sheets increased from 5,064 to 11,076 billion euros between 1999 and 2014 while in the same period relative deposit funding grew from 34.1 % to 35.8 % of the total assets. This increase in absolute and relative deposit funding levels in Euro Area bank balance sheets might emanate from an increased regulatory emphasis on deposit funding as a source of funding, attractive risk-return characteristics of deposit funding – primarily resulting from depositor protection regimes – and the opportunities for cross-selling arising from deposit taking activities. In later sections we discuss potential determinants for deposit funding levels in more detail.
Regardless of the specific driving forces, there is a strong indication that deposit funding levels have grown. To formally test this presumption and to allow an examination of the underlying mechanisms for deposit funding level growth, we hypothesize that:
Different scholars have argued that bank funding structures have changed in line with changes in their main business activities. After a movement towards investment banking activities in the 1980s (Elsas, Hackethal, & Holzhäuser, 2010, p. 1286; Llewellyn, 2012, pp. 45-46), banks moved again away from these activities after the recent crisis (Demirgüç-Kunt & Huizinga, 2010, p. 648; ECB, 2013, p. 24), resulting in a Euro Area aggregated reduction of wholesale funding from 44 to 38 per cent of total liabilities. The wholesale funding reduction was absorbed by an increase in equity (+ 2.5 per cent),
secured debt and deposit funding (+ 3.5 per cent) in the period 2008-2013.7The shift towards other
non-wholesale funding sources, indicate a stronger demand for deposit funding. Hence, we expect stronger growth of deposit funding levels in Euro Area bank balance sheets since the recent crisis:
Hypothesis 1b Growth of bank deposit funding levels in Euro Area bank balance sheets increased
since the recent crisis.
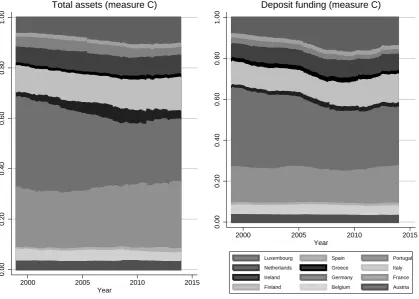
We discuss bank business models and their impact on deposit funding levels in Section 2.2.3; here we focus on the presence of cross-sectional differences and their impact on deposit funding levels. In a recent study of bank funding patterns since the financial crisis, Mesquita (2010) found that banks “regard the geographical funding structure not as a choice variable, but as a consequence of their in stitution’s history, which determines the overall business model, which in turn instils a corporate culture and risk attitude that ultimately translates into the funding approach" (Mesquita, 2010, p. 9). Hence, de terminants of funding structures also include banks’ country-specific history, geography and institutional context supporting our expectation of large differences in deposit funding levels not only across bank business orientations but also across countries:
Hypothesis 1c Bank deposit funding levels vary across countries.
Hypothesis 1d Bank deposit funding levels vary across bank business orientations.
Our indication of deposit funding level growth raises the question what the driving forces are behind deposit growth. Regulatory emphasis, attractive-risk return characteristics and bank business models – and hence competitive considerations – are mentioned as potential determinants. In the next sections, we highlight evidence that deposit funding demand is indeed driven by these factors; furthermore, we highlight bank’s economic function in which deposit funding plays an important role.
2.2 Why banks fund with deposits
Euro Area banks fund with deposits as banks are by definition the only financial institutions that ac
cept – and permitted to accept8– deposits from the public and grant credits for own account (European
Parliament and Council, 2013c, p. 19). Hence, the basic function of banks is to transform deposits into loans. This transformation mechanism is an important starting point for our discussion of four ex
planatory themes for deposit funding levels from a bank perspective:9the economic function, regulatory
incentives, bank business models and competitive considerations. First, the mechanism underscores banks’ economic function as liquidity distributor in the Euro Area. Second, the mechanism shows the regulatory favouritism for banks in deposit taking activities and the need for regulatory involvement to foster financial stability and customer protection. Third, the extent to which banks are involved with this mechanism highlights the existence of different business models. Fourth, these business models position banks and their deposit funding ability differently in the Euro Area deposit funding market and hence result in different competitive considerations.
7The shift towards deposit funding is especially welcome since retail oriented banks have shown a high degree of stability and
resilience to the recent crisis (Merck Martel, Van Rixtel, & Mota, 2012, p. 116). The shift to less volatile funding also results in increased funding costs but operating profits – and hence solvability – have remained stable (ECB, 2013, pp. 18, 19, 26).
8A permit to attract deposit funding from the public is a necessary condition to classify as a bank.
9Note that these themes are undoubtedly interrelated (cf. Barth, Caprio, & Levine, 2004, pp. 206, 245; Goddard, Molyneux,
Wilson, & Tavakoli, 2007).
2.2.1 Economic function: the role of deposits in banks’ main function
Although banks diversified their activities drastically in the last decades, banks’ core business activi ties continued to include deposit taking from the public, offering deposit-linked payment services and lending for own account. This asset transformation mechanism allows banks to execute an important
economical function, i.e. creation and distribution of temporal- and spatial-specific liquidity10between
their customers. This economic function and the underlying mechanism is a major driver of banks’ demand for deposit funding.
Liquidity distribution – Liquidity distribution is beneficial for economic growth as it ensures efficient al
location of liquidity to its most productive use and allows distribution of economic resources with varying size in uncertain environments (Merton, 1995, pp. 23-24). However, liquidity distribution is – especially in uncertain environments – also associated with transaction costs. Banks minimize the transaction costs – and hence create liquidity – through intermediation between customers, asset transformation, depositor and debtor monitoring, risk management, information processing and value transfers (Freixas & Rochet, 1997, pp. 1-2; Cavelaars & Passenier, 2012, pp. 4-5). In fact, “the raison d’être for [the
banking] industry is the existence of transactions costs” (Scholes et al., 1976, p. 215). This is because
the presence of transaction costs enables banks to utilize economies of scope and scale, minimize the transaction costs for individual customers and create additional liquidity.
Economies of scale and scope – As platforms for liquidity distribution come with fixed costs, banks
attract and grant large volumes of deposits and loans to minimize transaction costs. Providing the same platform to multiple customers results in scale advantages. Increased scale of operations allows depos itors and borrowers to hold more diversified portfolios as a broader range of investment opportunities become available from large coalitions of depositors. These large coalitions are then able to invest in more illiquid investments while satisfying the liquidity needs of individual investors (Freixas & Ro chet, 1997, p. 19; Diamond & Dybvig, 1983, p. 416). Moreover, scale advantages coincide with scope advantages as the distinct combination of deposit taking activities and lending are essentially two man ifestations of the same function – providing of liquidity – and need similar risk analysis, monitoring and information processes (Kashyap, Rajan, & Stein, 2002, p. 65). Especially the information advantages resulting from simultaneous provisioning of loans and deposit services provide banks with large scope
advantages.11As a result, banks are likely to adjust their deposit funding and loan levels simultaneously
which indicates a strong interrelationship – or cointegrating relationship – between deposit funding and lending over time:
Hypothesis 2a Bank deposit funding and loan levels are dynamically related.
Although banks have the ability to fund loans with a wide array of sources, this relationship implies that loans are – at least on the long-run – funded with deposit funding. Hence, deposit funding and loan levels are not only dynamically related, there is likely a causal flow – or Granger causality – from deposit funding to loan levels which indicates that changes in deposit funding precede changes in loan levels:
Hypothesis 2b Changes in bank deposit funding levels lead to changes in bank loan levels.
Such a causal flow from deposit funding to loan levels is in line with prudential principles as banks attract funding with similar characteristics first before these are transformed and transferred in the form of loans.
Regulatory favouritism12– Required knowledge and capabilities to minimize transaction costs in liq
uidity provision is not unique to banks. However, deposit taking is restricted in practice to banks13as
10Assets which have the property of being transformed at minimal transaction costs are referred to as liquid assets (Scholes,
Benston, & Smith, 1976, p. 219).
11These advantages include cross-selling potential. However, simultaneous involvement in deposit and loan activities may not
only provide banks with information benefits but also increase information asymmetries which undermine depositors’ ability to value bank assets and offerings correctly. These asymmetries enable banks to extract monopolistic rents which might lessen wealth creation (Benston & Kaufman, 1995, p. 18; Ayadi et al., 2011, p. 9). This tension highlights regulatory involvement and emphasis on competition.
banks benefit from regulatory favouritism. This restriction allows governments and regulators to monitor and influence economic development, financial stability and customer protection but limit competition-fuelled efficiency as the regulatory favouritism resulted in banking sectors characterized by monopolistic
competition (Freixas & Rochet, 1997, p. 1; Goddard et al., 2007, p. 1922).
Diversification – Diversification allows banks, in addition to cross-selling and cost-sharing, to mini
mize transaction costs further. Banks offer and use risk diversification through distribution of different risks from a variety of debtors over various investors and diversify their own risk profile similarly by diversification of activities. Diversification of bank activities increases the profitability but interestingly not necessarily the market value of banking conglomerate. This valuation-profitability paradox is most likely explained by the mediating effect of the banks’ increased risk profiles which is especially true for
European banks.14 Large, diversified banks are considered ‘too big to fail’ (TBTF) and benefit from
(implicit) government guarantees which might result in excessive risk taking15while smaller banks often
lack the expertise to undertake different streams of business activities (Mercieca, Schaeck, & Wolfe, 2007, p. 1995). The impact of diversification and bank size on bank stability is also stressed by Bank of England director Andrew Haldane who argued that implicit and explicit state-support had distorted risk-return considerations in banking which led to different innovations, including new business line di versification. These diversifications resulted in increased systemic risk for the overall banking sector (Haldane, 2013, p. 3). Investors might discount banks’ market value with the increased risk of the finan cial sector but this is not necessarily true for all banks. Banks with high reliance on one type of income might benefit from increased bank stability by income diversification and vice versa (Lepetit, Nys, Rous, & Tarazi, 2008, p. 1461; Stiroh & Rumble, 2006, p. 2158). Similar results are found for funding struc tures which indicates the U-shaped relationship of deposit funding and interest income on bank stability (Köhler, 2014, p. 208).
Although diversification is closely related to banks’ asset transformation mechanism, the economic added value of bank diversification itself depends on the bank’s specific business activities. The ex tent to which banks diversify their activities is of great significance for the bank’s risk profiles, funding structures and hence for the importance of deposit funding in these structures.
Recent changes in banks’ asset transformation mechanism – Since the start of the crisis many
banks emphasised – again – on providing liquidity as their main activity. As a result, attention increased for the asset transformation mechanism and hence for deposit funding. However, this focus likely co incided with a change of the dynamic relationship between deposit funding and lending. Shortly after
the fall of Lehman Brothers, banks world wide decreased their lending.16 Similarly, European banks
decreased the levels of lending as the uncertainty of European economies and their ability to repay loans continued (Howcroft, Kara, & Marques, 2014, p. 489). For a stable deposit-loan transformation mechanism, the decreased lending activities indicate decreased deposit funding activities.
Decreased deposit funding levels conflict with our hypotheses 1a and 1b. On the other hand, the relative stability of deposit funding levels, the rapid decrease of other funding sources and regulatory emphasis on deposit funding favour the premises of growing deposit levels (H1a-b) with decreasing loan levels. As a result, we hypothesize that the deposit–loan transformation mechanism has probably changed since the crisis:
Hypothesis 2c The dynamic relationship between deposit funding and loan levels changed since
the crisis.
Conclusion – Banks deploy their main asset transformation mechanism between deposits and loans,
13This restriction is true for all deposit taking activities and especially for deposits from households and SMEs, the majority of
depositors in the Euro Area. Differences between Anglo-Saxon financial systems and mainland European financial systems exist where the former are less restrictive although in Anglo-Saxon systems deposit taking activities from uninformed decision makers also is reserved for licensed banks.
14See for a more broad discussion Stiroh and Rumble (2006, p. 2158), Baele, De Jonghe, and Vander Vennet (2007, p. 2020),
Laeven and Levine (2007, p. 365), Elsas et al. (2010, p. 1286), Jonghe (2010, p. 415).
15Regulators have also argued that banks are too complex rather than too big to save as a result of the breath of activities.
Disciplining these banks efficiently has proven a challenge for regulators which has enabled large banks to continue to extract monopolistic rents (Kane, 2000, p. 695; Stiroh & Rumble, 2006, p. 2159).
16Although banks with generous access to deposit funding showed lower decreases (Ivashina & Scharfstein, 2010, p. 335).
exploit scale and scope economies and support efficient liquidity allocation to its most productive use. Hence, banks’ deposit demand is a direct result of their economic function: liquidity distribution at minimum transaction costs. This economic function suggests a strong interrelation between deposit funding and loans (H2a); moreover, it implies a causal flow from deposit funding to lending as loans are funded by deposits (H2b). Since the recent crisis, deposit funding levels have grown while lending activities decreased. Consequently, the transformation mechanism between deposit funding and loans has likely changed (H2c).
The economic function is supported by regulatory favouritism and influenced by scope advantages which might result in different business models. The influence of regulation and business models on banks’ deposit demand are discussed in next sections.
2.2.2 Regulation: regulatory incentives for deposit preference
Regulators are involved with banks for numerous motives,17 primarily to foster economic growth, finan
cial stability and customer protection. Deposits play a special role for regulators as these provide both the rationale and means for regulatory interventions (Laeven & Levine, 2009, p. 260): from a customer protection perspective, depositors require a preferred position as they are considered uninformed deci sion makers (see Section 2.1 and Figure 2.1.1). However, depositor preference might result in reduced depositor market discipline which increases moral hazard and lead to excessive risk-taking. To counter these effects, regulators impose capital requirements which align the risk-taking incentives of a bank and its owners by forcing them to allocate more personal wealth at risk in the bank. The alignment of
risk-taking incentives for the owners and depositors increases financial stability.18
Euro Area bank regulation – European Union member states have a long history of bank regula
tion which from the seventeenth century increasingly focused on deposit taking and lending (Benston, 2000, p. 185). In the last decades a number of regulatory initiatives aimed to integrate Euro Area bank
regulations.19 This resulted in the capital requirements regulation (CRR), capital requirement directive
(CRD), bank recovery and recovery directive (BRRD) and deposit guarantee scheme directive (DGSD) nowadays in effect. These regulations all aim to increase financial stability and customer protection through restrictions on leverage, liquidity requirements and adjustment of priorities in insolvency claims.
The CRR and CRD – generally referred to as the CRD IV package20 – contain the Euro Area specific
requirements for capital and liquidity and specifically designate retail deposits as stable funding. Out flows of deposits covered by a deposit guarantee scheme are expected not to exceed 5 per cent per annum and hence considered highly stable while other funding sources receive higher discounts and are considered significantly less stable (see European Parliament and Council, 2013c, article 421).
Banking union – The most recent edition of the CRD IV package, the DGSD and BRRD form the basis
the EU initiatives to prevent future bank crises and are referred to as the banking union. The banking
union is part of the efforts to create a fully integrated European banking market21 and is based on three
pillars (Goddard et al., 2007, p. 1928; European Commission, 2014a, p. 1).
• Single supervision – by the ECB as central prudential supervisor of all financial institutions in the Euro Area. The largest banks are supervised by the ECB directly while supervision of smaller banks is mandated to the national supervisors.
• Single resolution – by the Single Resolution Board (SRB) and financed by the banking sector. The single resolution mechanism allows for orderly resolution of banks in the Euro Area at the minimal
17See for example Benston (2000) for a discussion on potential justifications for bank regulation.
18Laeven and Levine (2009), Forssbæck (2011) show however that the effects of increased depositor guarantees and capital
requirements are highly bank-specific as these also may stimulate banks into excessive risk-taking when altered risk profiles induce bank owners to demand higher returns.
19See Goddard et al. (2007, p. 1915) for an overview of EU banking legislations between 1977 and 2008.
20These requirements are the transposition of the Basel agreements on stable funding and liquidity management. In essence,
these aggreements focus on minimum leverage requirements of 3 per cent and a net stable funding ratio and a liquidity coverage ratio of at least 100 per cent (e.g., see BIS, 2013; BIS, 2014).
21Dermine (2006) already argued prior to the recent financial crisis that continuing European integration requires cross-boarder
Bail-in hierarchy under BRRD Current rules
Exempted Secured liabilities
Covered deposits Salary, pension
& tax claims
Hier
arch
y of loss-absor
ption under bail-in
Super-preference
Prefference
Non preffered uncovered deposits
DGS covered
Uncovered deposits from natural persons and SMEs
Subordinated debt
Share capital Senior liabilities
Corporates Public bodies Financial institutions
Exempted from bail-in
Share capital
[image:29.595.86.515.87.422.2]Subordinated debt
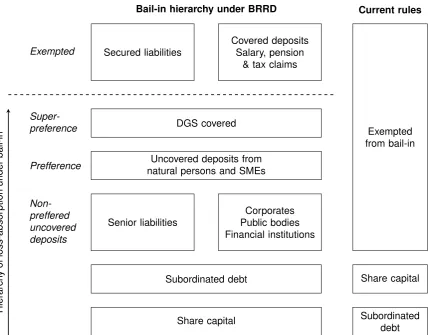
Figure 2.2.1: Bail-in waterfall (based on European Commission, 2013, p. 8; European Parliament and Council, 2013b, pp. 267-269).
costs for taxpayers. The contribution of large banks to the ex ante Single Resolution Fund (SRF) is based on the deposit volumes of banks.
• Single rulebook – for all banks active in the European Union. The rulebook includes the capital requirements (CRD IV package), designating supervision authority and recovery and resolution planning (BRRD) and the depositor preference (DGSD).
The impact of the banking union on banks’ funding structures is multifold. The single supervision mech anism increases homogeneity of funding structure requirements and interrelations between bank fund
providers in the Euro Area22 while the single resolution mechanism forces banks to structure their ac
tivities upfront to minimize resolution costs. Increased homogeneity – more specifically, the limitation of diversification – of funding structures is also enforced by the hierarchy of loss-absorption under the BRRD which – in line with the DGSD – show super-preference to the majority of retail deposit funding (see Figure 2.2.1).
Depositor preference – Depositor preference in the European Union is since the 1994 directive on
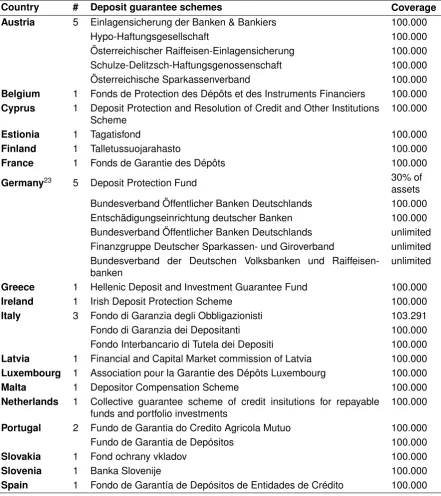
deposit guarantee schemes harmonized at a supra-national levels (European Parliament and Council, 1994) and aims to provide customer protection and financial stability by guaranteeing repayment of a covered level of funds deposited and by limiting the occurrence of bank runs (European Parliament and Council, 2014, p. 173). The harmonization of depositor preference required all banks to operate under a deposit guarantee scheme and provided with a uniform coverage level across the European Union.
22Especially the minimum capital requirements are influential for the bank funding structure; however, the risk weightings in CRD
IV and BIS III create ‘buckets’ of risk categories, influencing the concentration of available risk-return profiles.
23Germany has a tiered DGS-system with statutory coverage of EUR 100.000 and voluntary additional coverage.
Country # Deposit guarantee schemes Coverage
Austria 5 Einlagensicherung der Banken & Bankiers 100.000
Hypo-Haftungsgesellschaft 100.000
Österreichischer Raiffeisen-Einlagensicherung 100.000
Schulze-Delitzsch-Haftungsgenossenschaft 100.000
Österreichische Sparkassenverband 100.000
Belgium 1 Fonds de Protection des Dépôts et des Instruments Financiers 100.000
Cyprus 1 Deposit Protection and Resolution of Credit and Other Institutions 100.000
Scheme
Estionia 1 Tagatisfond 100.000
Finland 1 Talletussuojarahasto 100.000
France 1 Fonds de Garantie des Dépôts 100.000
Germany23 5 Deposit Protection Fund 30% of
assets
Bundesverband Öffentlicher Banken Deutschlands 100.000
Entschädigungseinrichtung deutscher Banken 100.000
Bundesverband Öffentlicher Banken Deutschlands unlimited
Finanzgruppe Deutscher Sparkassen- und Giroverband unlimited
Bundesverband der Deutschen Volksbanken und Raiffeisen unlimited
banken
Greece 1 Hellenic Deposit and Investment Guarantee Fund 100.000
Ireland 1 Irish Deposit Protection Scheme 100.000
Italy 3 Fondo di Garanzia degli Obbligazionisti 103.291
Fondo di Garanzia dei Depositanti 100.000
Fondo Interbancario di Tutela dei Depositi 100.000
Latvia 1 Financial and Capital Market commission of Latvia 100.000
Luxembourg 1 Association pour la Garantie des Dépôts Luxembourg 100.000
Malta 1 Depositor Compensation Scheme 100.000
Netherlands 1 Collective guarantee scheme of credit insitutions for repayable 100.000
funds and portfolio investments
Portugal 2 Fundo de Garantia do Credito Agricola Mutuo 100.000
Fundo de Garantia de Depósitos 100.000
Slovakia 1 Fond ochrany vkladov 100.000
Slovenia 1 Banka Slovenije 100.000
[image:30.595.77.519.90.587.2]Spain 1 Fondo de Garantía de Depósitos de Entidades de Crédito 100.000
Table 2.2.1: Overview of deposit guarantee schemes in the Euro Area (data from DGS websites).
This form of customer protection resulted in lowered risk and price characteristics of deposit funding and decreased deposit fund variability since depositors’ exerted market power reduced. Hence, deposit guarantee schemes form an important regulatory influence on deposit funding for banks.
The effects of deposit guarantee schemes on bank stability are evident:24 depositor preference might
prevent bank runs which have severe impact on the real economy (Diamond & Dybvig, 1983) and during the last financial crisis, systemic stability and bank risk proved lower in countries with depositor
guarantee schemes (Anginer et al., 2014, p. 9). Furthermore, the regulatory-induced under priced
24Although recent examples of bank runs in the United Kingdom (2007), Iceland (2008), the Netherlands (2009), Cyprus (2013)