This paper is made available online in accordance with
publisher policies. Please scroll down to view the document
itself. Please refer to the repository record for this item and our
policy information available from the repository home page for
further information.
To see the final version of this paper please visit the publisher’s website.
Access to the published version may require a subscription.
Author(s): Emma J Cooke, Richard S Savage, Paul DW Kirk, Robert
Darkins and David L Wild
Article Title: Bayesian hierarchical clustering for microarray time series
data with replicates and outlier measurements
Year of publication: 2011
Link to published article:
M E T H O D O L O G Y A R T I C L E
Open Access
Bayesian hierarchical clustering for microarray
time series data with replicates and outlier
measurements
Emma J Cooke
1, Richard S Savage
2, Paul DW Kirk
2, Robert Darkins
2and David L Wild
2*Abstract
Background:Post-genomic molecular biology has resulted in an explosion of data, providing measurements for large numbers of genes, proteins and metabolites. Time series experiments have become increasingly common, necessitating the development of novel analysis tools that capture the resulting data structure. Outlier
measurements at one or more time points present a significant challenge, while potentially valuable replicate information is often ignored by existing techniques.
Results:We present a generative model-based Bayesian hierarchical clustering algorithm for microarray time series that employs Gaussian process regression to capture the structure of the data. By using a mixture model likelihood, our method permits a small proportion of the data to be modelled as outlier measurements, and adopts an empirical Bayes approach which uses replicate observations to inform a prior distribution of the noise variance. The method automatically learns the optimum number of clusters and can incorporate non-uniformly sampled time points. Using a wide variety of experimental data sets, we show that our algorithm consistently yields higher quality and more biologically meaningful clusters than current state-of-the-art methodologies. We highlight the importance of modelling outlier values by demonstrating that noisy genes can be grouped with other genes of similar biological function. We demonstrate the importance of including replicate information, which we find enables the discrimination of additional distinct expression profiles.
Conclusions:By incorporating outlier measurements and replicate values, this clustering algorithm for time series microarray data provides a step towards a better treatment of the noise inherent in measurements from high-throughput genomic technologies. Timeseries BHC is available as part of the R package‘BHC’(version 1.5), which is available for download from Bioconductor (version 2.9 and above) via http://www.bioconductor.org/packages/ release/bioc/html/BHC.html?pagewanted=all.
Background
Post-genomic molecular biology has resulted in an explosion of typically high dimensional, structured data from new technologies for transcriptomics, proteomics and metabolomics. Often this data measures readouts from large sets of genes, proteins or metabolites over a time course rather than at a single time point. Most bio-logical time series aim to capture information about processes which vary over time, and temporal changes in the transcription program are often apparent [1].
Grouping together genes which exhibit similar varia-tions in expression over time can identify genes that are likely to be co-regulated by the same transcription fac-tors [2]. Whilst there are many clustering algorithms available which allow genes to be grouped according to changes in expression level, the standard approaches to clustering use pairwise similarity measures, such as cor-relation or Euclidean distance, to cluster genes on the basis of their expression pattern. These algorithms disre-gard temporal information: the implicit assumption is that the observations for each gene are independent and identically distributed (iid) and are invariant with respect to the order of the observations. If the order of observations in two sequences is permuted, their * Correspondence: d.l.wild@warwick.ac.uk
2Systems Biology Centre, University of Warwick, Coventry, UK Full list of author information is available at the end of the article
correlation or Euclidean distance will not change. How-ever, this does not hold for time series, where each observation depends on its past, and gene expression levels at adjacent time points exhibit correlation. This was demonstrated in the classic paper of Eisenet al. [2], who observed that the biologically meaningful clusters obtained by hierarchical clustering of S. cerevisiae microarray time series data, using a correlation distance metric, disappeared when the observations within each sequence were randomly permuted.
McLachlan et al. [3] use a model-based approach to clustering microarray data, and demonstrate the cluster-ing of a relatively small number of tissue samples on a very large number of genes. Model-based approaches to time series clustering have included the use of finite and infinite hidden Markov models [4,5]. Another popular approach is the use of splines as basis functions [6-9]. Liveraniet al. [10] also use Fourier series as basis func-tions. Ng et al. [11] use a random-effects model for mixture model-based clustering of correlated microarray data, including gene profiles over time. A number of additional methods for time series data analysis have been reviewed by Bar-Joseph [12].
The Bayesian Hierarchical Clustering (BHC) algorithm [13] is a fast approximate inference method for a Dirich-let process mixture model, which performs agglomera-tive hierarchical clustering in a Bayesian framework. BHC has previously been used to cluster genes from sin-gle time point microarray observations [14]. Heard [15], has applied an iterative reclassification extension to BHC which leads to improvements in the quality of the clustering. In this paper we extend BHC for use with time series data. Microarray time series data sets often contain several replicate values per observation and standard clustering algorithms lack the ability to incor-porate this information, two exceptions being the meth-ods of Nget al. [11] and Zhouet al. [16]. Nget al. [11] demonstrate an extension of finite mixture model clus-tering by introducing random gene effects and random tissue effects, such that within each cluster the random gene effects are shared among replicate measurements from the same gene (in the same tissue), while random tissue effects are shared among measurements from the same tissue. In their Bayesian model-based approach,
Zhou et al. [16] use the information from replicate
experiments to inform prior distributions for the data being clustered. Whereas Zhouet al. [16] use a replicate experiment to inform the prior distributions and then cluster single (non-replicated) observations, we adopt an empirical Bayes approach that uses all the replicate information to inform the prior distributions, and then cluster the mean of the data profiles.
Measurement error is not the only source of noise to consider. Genes regulated by the same transcription
factor(s) are unlikely to have identical expression pro-files for the duration of the time series, which leads to inherent variation in the expression data of co-regu-lated genes. Liu et al. [17] highlight the uncertainty about the precise biological time at which gene expression measurements are taken. Smith et al. [18] address the issue of outlier profiles in a data set by demonstrating a method of setting the model hyper-parameters which can prevent agglomerative cluster-ing methods such as that of Heard et al. [8] from combining outlier profiles into a single cluster at an early stage in the clustering. In this paper, we model the total noise variance as a sum of the measurement error variance and the inherent biological variation within a cluster. Typically, the noise inherent in gene expression microarray data is modelled with a Gaus-sian distribution, which provides a good model for the majority of data. However, a subset of the data may contain much higher levels of noise, which cannot be correctly modelled by the same distribution as that used for the majority of the data. By using a mixture model likelihood, we explicitly model a small propor-tion of the data as outlier measurements, and there-fore allow genes which have noisy observations to participate in the clustering assignment, instead of being assigned to noisy and biologically meaningless clusters.
Methods
Bayesian Hierarchical Clustering
Agglomerative hierarchical clustering is a commonly used approach to group genes according to their expres-sion levels. In this algorithm, each gene begins in its own cluster and at each stage the two most similar clus-ters are merged.
The BHC algorithm [13] performs agglomerative hier-archical clustering in a Bayesian setting. It uses a model-based criterion to decide which clusters to merge at each stage, and learns the most likely number of clus-ters, given the data. Another interpretation of the BHC algorithm is as a fast approximate inference method for a Dirichlet process mixture (DPM) model. DPM models are frequently used in clustering, and allow for an infi-nite number of clusters to be considered, although only a finite number of clusters are actually ever used to describe any data set.
The prior probability, πk, that a given pair of clusters,
C1 and C2, should be merged is defined by the DPM and is determined solely by the concentration hyper-parameter for the DPM and the number of genes cur-rently in each partition of the clustering (see Savage et al. [14] for details). BHC uses Bayes’ rule to find the posterior probability, rk, that the pair of clusters should
rk= πk P(y|Hk1)
P(y|Tk)
(1)
where y= {y1,...,yN} is the set of Ndata points
con-tained in clusters C1 and C2. P(y|H1k)is the marginal likelihood of the data given the hypothesis,H1k, that the dataybelong to a single cluster and requires the specifi-cation of a likelihood function, f, as the probabilistic model generating the observed data, y. P(y|Tk) is the
probability that the data could be partitioned in any way which is consistent with the order of assembly of the current partition, (see Heller and Ghahramani [13] for further details), and is defined recursively:
P(y|Tk) =
πkP(y|Hk1) + (1−πk)P(y|Ti)P(y|Tj)
(2)
where Ti andTjare previously merged clusters
con-taining subsets of the data iny.
Whilerkis greater than 0.5, it is more likely that the
data points contained in the clusters C1 and C2 were generated from the same underlying function, f, than that the data points should belong to two or more clus-ters. Whenrkis less than 0.5 for all remaining pairs of
clusters, the number of clusters and partition best described by the data has been found.
Gaussian Process Regression
Gaussian process regression (GPR) is a non-linear regression method with several previous applications in the analysis of gene expression data [1,17,19,20].
In our GPR model a single observation at time pointti
is represented asy(ti) = f(ti) + ε. For each cluster, we
assume the latent function f is drawn from an infinite dimensional Gaussian distribution, where the correlation structure between the points is determined by a covar-iance function,Σ, with hyperparameters,θΣ. We assume
εisiidnoise with a Gaussian distribution,N(0,σε2). Lety= [y1,T. . .yG,T] be theN = G×Tobservations in
a cluster ofGgenes, where the {yg,T} are time series of
{1,..., T} time points. Each gene is normalised to have mean 0 and standard deviation 1 across time points. The prior offis given for fixed values ofθΣ, such thatP(f|θΣ) =N(0,Σ). It follows that the likelihood function forfis
P(y|f,σε2) =N(f,σε2I), where I is the N × N identity matrix. The marginal likelihood of the data,y, is then:
P(y|θ,σε2) =N(0,+σε2I)
= (2π)−N2|K|− 1
2exp(−1 2y
T(K)−1y) (3)
where K=+σε2Iis the covariance function for y. We have implemented both the squared exponential
and cubic spline covariance functions into BHC. The probability P (y) is given for fixedθΣ andσ2
ε, since all observations in a cluster are assumed to have the same latent functionf and noise variance.
Covariance Functions
The covariance function Kdescribes the relationship between the values of the function, f, at different time points and must be positive semi-definite to be valid. In BHC we have implemented the squared-exponential covariance functionKSE, which is a widely-used choice
forK:
KSE(ti,tj) =σf2
exp
−(ti−tj)2 2l2
+σε2δij (4)
where δij is the Kronecker delta function and ti and
tj are two time points for f. The covariance function
encodes our assumptions about the underlying signal in the data. For example in KSE the hyperparameter
σ2
f is the signal variance,σε2is the noise variance, and the length scale, l, is intuitively how far along the input time axis must be travelled between stationary points. As the inputs become closer in time, the value of KSE increases and tends to unity, meaning these
values of f are more closely correlated. This encodes the intuition that our time series are smoothly-vary-ing, once we have accounted for noise. We have also implemented the cubic spline covariance function, KC S, to facilitate comparison with the clustering
method of Heard et al. [7], which can use cubic splines as basis functions:
KCS(ti,tj) =σf2
|
ti−tj|υ2
2 +
υ3 3
+σε2δij (5)
where v = min (ti,tj). KCS only has two
hyperpara-meters, σf2and σε2, as described above, but no length hyperparameter.
Using replicate data to learn the noise hyperparameter
For each cluster, we learn the hyperparametersθΣ and
σ2
ε, which maximise the marginal likelihood of the data, y, using a gradient ascent method. We want to use the replicate information to inform the value ofσ2
ε. For this hyperparameter we assume a Gamma prior, where
P(σ2
ε) = Ga(α,β).
The total noise variance,σ2
ε, is assumed to be a sum of the measurement error variance,σ2
σ2 m=
1
R(GRT−1) T
t=1 G
g=1 R
r=1
(yr,g,t− ¯yg,t)2 (6)
where Gis number of genes in the cluster,Ris num-ber of replicates per observation, T is number of time
points in the time series andy¯g,t=
R
r=1yr,g,t/R, where {yr,g,t} is the set of replicates for an observation.
It is these averages of the replicate values,{¯yg,t}, that are used as the observations in the clustering algorithm.
P((a - 1)/b) is the modal value of the Gamma distri-bution, and the hyperparameters aandbare chosen to give a weakly informative prior onσ2
ε such that:
1
P α−1
β
≈P(1)≈Pσm2 (7)
wherePdenotes the Gamma distribution andΩis cho-sen to be 100. Equation 7 reflects our prior knowledge thatσm2is a lower bound for the total noise variance, and also that the total noise variance is unlikely to be greater than the total variance of the data, which is approximately unity because of initial normalisation, see Figure 1.
The hyperparameters, θ = (θ,σ2
ε), are estimated by maximising logP(θ|y) using a gradient ascent method. The partial gradient of the log marginal likelihood with respect toθj=σε2is:
∂ ∂θj
logP(θ|y) =
1 2tr γ γ
T−K−1∂K
∂θj
+αj−1
θj −βj
(8)
whereg = K-1y, ∂ K/∂θjis a matrix of element-wise
derivatives and ‘tr’denotes the trace of the matrix. In the case of the remaining hyperparameters, a flat prior, P(θj), is assumed, and therefore the corresponding
par-tial gradients contain only the trace term above. If repli-cate information is not required to be included in BHC, a flat prior is also assumed forσ2
ε.
Modelling outliers
We have so far considered the total noise in microarray measurements to have a Gaussian distribution. However, despite averaging replicate values, microarray data typi-cally contain some outliers that are not well modelled by the Gaussian noise distribution used for the majority of the data.
Kuss et al. [21] introduce the idea of a mixture
model for the likelihood function, P (y|f), where the likelihood functions for observations with regular noise have a Gaussian distribution, and a likelihood function of a different form is assumed for the outlier measure-ments. Stegle et al. [1] used such a mixture model likelihood with an expectation propagation scheme to identify differentially expressed genes. They show that the mixture model likelihood provides more accurate predictions.
We simplify our notation to denote, y¯g,t, a single expression value from gene g and time point t, asyn.
Following the reasoning in Kusset al. [21], we assume there is a small probability, b, that this value, yn, was
generated by an unknown likelihood function,Po,
pro-ducing outlier measurements, and a probability a= 1 -b that yn is a regular value, which was generated by a
Gaussian likelihood function,Pr. This mixture likelihood
function is therefore:
P(yn|fn,θ) =aPr(yn|fn,θ) +bPo(yn|fn,θ) (9)
The expression for the marginal likelihood then becomes:
P(y|θ) =
df P(f|θ) N
n=1
[aPr(yn|fn,θ) +bPo(yn|fn,θ)].
(10)
Multiplying out the likelihood function product would result in 2Nterms. In the case that Po is a
con-jugate distribution to Pr, evaluation of this integral
would be analytically solvable, but computationally intractable for large numbers of observations. How-ever, if the proportion of outlier measurements is small, this series can be approximated. Making the fol-lowing simplifications to notation: An = Pr (yn|fn, θ)
[image:5.595.57.292.417.660.2]andBn=Po (yn|fn,θ) gives:
Figure 1Gamma prior on the total noise variance. A Gamma
σ2
m (11)
The term with coefficient aN represents the case where no observations are outliers. Terms with coeffi-cientaN-1b represent the case that a single observation is an outlier.
Terms with b2 or higher order in their coefficients represent the case that two or more observations are outliers. Sinceb is small, these terms are considered to represent events unlikely to occur and are disregarded. Our first order approximation considers every datum as an outlier; higher order approximations would incur a disproportionate computational burden.
The likelihood function for the outlier terms,Bn, is
modelled as the same constant function for all measure-ments, B = 1/Range, where Range is the difference between the highest and lowest observations in the data set.
When theAnrepresent Gaussian distributions, it
fol-lows that
P(y|θ)≈aN(2π)−N2|K|− 1
2exp −1 2y
T(K)−1y
+
aN−1b N
n=1
⎡ ⎣B(2π)−
N−1 2 |K−n|−
1 2exp(Q)
⎤ ⎦.
(12)
WhereQ=−12yT−n(K−n)−1y−n,y−nis the vector of N -1 observations excluding the nthobservation andK-nis
the corresponding covariance matrix.
After optimisation of the hyperparameters for the cov-ariance function, K, the proportion of outliers, 1 - a, is calculated to optimise the marginal likelihoodP (y|θ). Simplifying the notation, such thatP(y|θ)≈ aNV1 +aN-1 (1 - a)V2, we haveamax = (1 - N)V2/N(V1 - V2) as the value ofagiving the highest value for P(y|θ). Therefore if 0 <amax< 1, thena = amax, otherwisea =1.
Datasets
For the computational experiments we have used time series data sets from four published microarray studies, which we refer to asS. cerevisiae 1, S. cerevisiae 2, H. sapiensandE. coli. TheS. cerevisiae 1data set uses the 17 time point cell-cycle data from Cho et al. [22] and contains 169 genes from eight clusters as found by the multiple data source integration method of Savageet al. [23]. There are no replicates for this data set.
The S. cerevisiae 2 data set uses the 15 time point
data from Orlando et al. [24] for the 440 genes which were identified as periodic in the paper, and which were also identified as such by Spellmanet al. [25] and Pramila et al. [26]. Two independent biological repli-cate samples were taken for each time point. The data
from Rangel et al. [27] comprises two biological repli-cates of 34 and 10 technical replirepli-cates respectively of 58 genes from an experiment investigating how the H.
sapiens Jurkat T-cell line responds to PMA and
iono-mycin treatment. This data is used for the H. sapiens data set. These samples were taken at 10 unequally spaced time points. The data set of Carzaniga et al. [28] measures the transcriptional response of E. coli K-12 cells as they are moved from 10°C to 37°C at K-12 unequally spaced time points. In this data set there are three biological replicates each with two technical replicates. The genes were first ranked for differential expression using the method of Stegle et al. [1] and the 200 top ranked differentially expressed genes used as the E.coli data set.
Performance metrics
When comparing BHC to other clustering methods, we are interested in identifying which method produces the most biologically meaningful clusters, and therefore use the Biological Homogeneity Index (BHI) [29] as a qual-ity measure to reflect this. We used the R package clVa-lid [30] to calculate the BHI scores. The BHI performance metric scores a clustering partition between 0 and 1, with higher scores assigned to more biologically homogeneous partitions with respect to a reference annotation set. For these sets we used the gene ontology (GO) annotations in the Bioconductor packagesorg.Sc.sgd.db, hgu133plus2.dband org.EcK12.eg. dbfor the S. cerevisiae1 and 2,H. sapiens andE. coli data sets respectively.
The average Pearson correlation coefficient,PCC, of the expression profiles within the clusters, was used as a measure of the similarity of gene expression shapes within clusters.
[image:6.595.70.290.335.402.2]The BHI and average PCC both represent mean values of a large number of pairwise similarity comparisons. For BHI, we considered whether or not pairs of (anno-tated) genes that have been allocated to the same cluster share GO annotations. For each such pair of genes, we thereby obtained a 1 or 0, depending on whether or not the genes do (1) or do not (0) have the same annotation. The confidence intervals for the BHI scores provided in Table 1 were determined by applying a nonparametric bootstrap (1000 iterations) to the set of all calculated 0’s and 1’s in each cluster in order to obtain an estimate of the standard error of the mean [31]. The confidence intervals for the average PCC were determined similarly with 100 iterations.
Results and Discussion
Comparison of BHC to other clustering methods
For each of the four data sets, we compared the BHC time series algorithm using squared exponential (BHC-SE) and cubic spline (BHC-C) covariances to the clus-tering methods of SplineCluster [7] using both linear (SC-linear) and cubic (SC-cubic) splines, SSClust [9], CAGED [32] and the method of Zhouet al [16]. These methods are designed to account for the correlations between the observations in time series data. For a clear comparison with the BHC algorithm, we did not use a mixture model likelihood, or include any replicate infor-mation. We also compared BHC to Euclidean distance average linkage hierarchical clustering (HCL) as imple-mented in the MeV software [33], and MCLUST [34]. For these two methods the clustering partitions are invariant to permutation of the time points.
Freely available software is available for each method, and all but HCL estimate the number of clusters for a
data set. However, the BIC score in SSClust generally continued to improve with an increasing number of clusters, suggesting overfitting. For the method of Zhou
et al., we used the JAGS code (available from http://
[image:7.595.56.544.100.438.2]faculty.washington.edu/jonno/biometrics_code.txt) for the first order random walk model described in Zhouet al. [35], which allows incorporation of prior information. This method is a generalised case of the method described in Zhou et al. [16], which is specifically for periodic data. The JAGS implementation required the preferred number of clusters to be pre-specified. Details of the priors used for this method are available in Addi-tional File 1. Therefore for HCL, SSClust and the method of Zhouet al., the number of clusters was fixed at the number obtained for BHC-SE. The CAGED algo-rithm was tried with all possible Markov orders allowed by its software, but a low number of clusters was always favoured, a phenomenon also found by Heardet al. [8]. We restricted the MCLUST clustering to models with
Table 1 Comparison of clustering methods using performance metrics
# S. cerevisiae 1 # S. cerevisiae 2 # H. sapiens # E. coli Clustering
method
clusts PCC±stdev clusts PCC±stdev clusts PCC±stdev clusts PCC±stdev
BHC-SE 13 0.68 ± 0.005 58 0.883 ± 0.003 6 0.75 ± 0.009 24 0.84 ± 0.003
BHC-C 9 0.66 ± 0.004 40 0.877 ± 0.002 2 0.55 ± 0.009 15 0.80 ± 0.003
SC-linear 7 0.60 ± 0.006 40 0.881 ± 0.002 4 0.69 ± 0.009 17 0.78 ± 0.004 SC-cubic 4 0.49 ± 0.005 22 0.852 ± 0.002 2 0.44 ± 0.010 8 0.67 ± 0.004 HCL 13* 0.53 ± 0.009 58* 0.881 ± 0.002 6* 0.66 ± 0.016 24* 0.68 ± 0.006 SSClust 13* 0.60 ± 0.008 58* 0.846 ± 0.003 6* 0.69 ± 0.015 24* 0.72 ± 0.010
CAGED 2 0.42 ± 0.042 6 0.606 ± 0.003 3 0.55 ± 0.020 2 0.47 ±0.005
MCLUST 8 0.60 ± 0.004 30 0.858 ± 0.002 6 0.75 ± 0.011 11 0.73 ± 0.004
Zhou 13* 0.60 ± 0.008 58* 0.853 ± 0.004 6* 0.75 ± 0.011 24* 0.74 ± 0.006
# S. cerevisiae 1 # S. cerevisiae 2 # H. sapiens # E. coli
Clustering method clusts BHI ± stdev clusts BHI ± stdev clusts BHI ± stdev clusts BHI ± stdev
BHC-SE 13 0.70 ± 0.07 58 0.57 ± 0.03 6 0.62 ± 0.06 24 0.46 ± 0.06
BHC-C 9 0.73 ± 0.11 40 0.55 ± 0.03 2 0.78 ± 0.05 15 0.47 ± 0.04
SC-linear 7 0.69 ± 0.10 40 0.55 ± 0.02 4 0.66 ± 0.07 17 0.35 ± 0.03
SC-cubic 4 0.64 ± 0.02 22 0.53 ± 0.01 2 0.70 ± 0.03 8 0.32 ± 0.02
HCL 13* 0.50 ± 0.04 58* 0.56 ± 0.04 6* 0.52 ± 0.07 24* 0.44 ± 0.07
SSClust 13* 0.65 ± 0.03 58* 0.56 ± 0.02 6* 0.64 ± 0.05 24* 0.36 ± 0.03
CAGED 2 0.64 ± 0.02 6 0.52 ± 0.02 3 0.68 ± 0.04 2 0.21 ± 0.01
MCLUST 8 0.69 ± 0.02 30 0.55 ± 0.02 6 0.61 ± 0.06 11 0.47 ± 0.04
Zhou 13* 0.66 ± 0.03 58* 0.54 ± 0.02 6* 0.61 ± 0.06 24* 0.43 ± 0.07
# S. cerevisiae 1 # S. cerevisiae 2 # H. sapiens # E. coli
Clustering method clusts log marginal likelihood
clusts log marginal likelihood
clusts log marginal likelihood
clusts log marginal likelihood
BHC-SE 13 -3293 58 -3956 6 -633 24 -2497
BHC-C 9 -3356 40 -4294 2 -734 15 -2622
spherical and diagonal covariance matrices, since we found that permitting full covariance matrices tended to yield poor results. When using SplineCluster, the prior precision on the coefficients was selected by maximisa-tion of the log marginal likelihood of the clustering. Only BHC, SplineCluster and the method of Zhouet al. were able to incorporate the non-uniformly sampled time intervals for theH. sapiensandE.colidata sets.
Table 1 shows the results of the two performance metrics PCC and BHI for these comparisons, where higher values are better for both metrics. In all cases the BHC algorithm gives the most coherent or joint most coherent clustering according to expression level, as measured by thePCC. For the H. sapiens data set the MCLUST and Zhou methods give an identical cluster-ing, which has an equal PCC to the almost identical clustering of the BHC-SE method. BHC also gives the most biologically relevant clustering partition as mea-sured by the BHI, except in the case of S. cerevisiae 1 where the BHI confidence intervals of BHC-C and SC-linear overlap considerably. However, the greater num-ber of clusters generated by BHC-C are more biologi-cally meaningful (see Figure 2). Liverani et al. [10] also find a greater number of clusters for their data set than the SplineCluster method of Heard et al. [7] and
demonstrate this is an improvement in the quality of clustering.
At each stage, the BHC algorithm calculates the mar-ginal likelihood of the tree structure for the data, p(y| Tk), as given by Equation (2). Denoting the final,
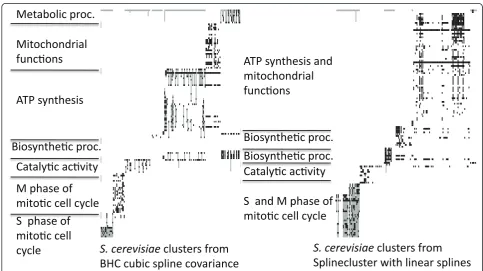
unpruned tree structure returned by the algorithm asT, we may use the final (root node) marginal likelihood,p (y|T), in order to do model comparison between differ-ent choices for the covariance function (a similar strat-egy is employed by Heller and Ghahramani [13] in order to select model hyperparameters). In Table 1, we provide (log) marginal likelihoods for the squared expo-nential and cubic spline covariance functions. For all data sets considered in this paper, the squared exponen-tial covariance function yields the higher log-marginal likelihood. We note that this is in good agreement with thePCC¯ , which is also consistently higher for BHC-SE. For all data sets the gene lists and plots of clusters for BHC-SE and BHC-C are available in Additional File 2. Figure 2 shows the over-represented GO annotations using the R package GOstats in the clusters resulting from BHC-C and SplineCluster using linear splines, for theS. cerevisiae 1data set. Grey and white vertical shad-ing separates the clusters and each row represents a GO annotation, where the dark block shading indicates an
!
!
!
!
[image:8.595.55.539.408.679.2]Figure 2GO annotation matrices. Over-represented GO annotations,p< 0.01 for the BHC-C clustersleft(BHI = 0.73) and the SplineCluster
annotation is over-represented in the cluster. A repre-sentative GO annotation is given for each cluster. Figure 2 shows that BHC is able to separate the clusters of mitochondrial and ATP synthesis functions and also the M- and S-Phase mitotic cell cycle genes, that Spli-neCluster combines together. The increased biological homogeneity of the BHC clusters is reflected in a higher BHI score of 0.73, compared to a BHI for SplineCluster of 0.69. For the full GO annotations and a large version of Figure 2, see Additional Files 3 and 4.
BHC clustering of simulated data sets
An advantage of the BHC algorithm is that it allows simulated data with realistic noise and expression pro-files to be generated from the Gaussian processes inferred from the BHC clustering of real biological data.
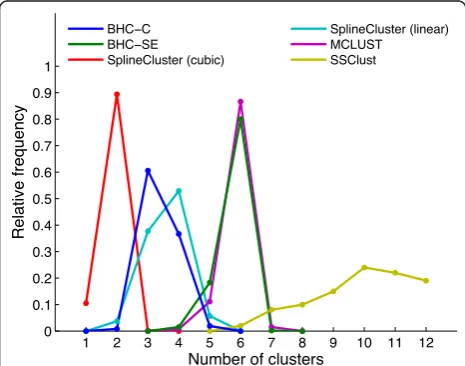
To demonstrate that the BHC algorithm can find the correct number of clusters for a synthetic data set, we analysed simulated data sets with the same number of genes, timepoints and noise levels, which were generated from the 6 and 13 Gaussian processes inferred from the BHC-SE clustering of the H. sapiensandS. cerevisiae 1 data sets respectively. These Gaussian processes are therefore models of true biological data. Figures 3 and 4 show the estimated number of clusters found for 1000 simulated H. sapiens and S. cerevisiae 1 data sets
respectively, for BHC-SE, BHC-C, SplineCluster (linear and cubic), MCLUST and SSClust methods. We did not use CAGED in the comparison, since it is a Windows-based program that does not permit automation.
BHC-SE finds the correct number of clusters for the simulated data generated from the 6 Gaussian processes in 80% of cases. For the simulated data generated from the 13 Gaussian processes, BHC-SE finds between 11-13 clusters in 89% of cases. For the H. sapiens data, MCLUST is the only method other than BHC-SE to correctly favour 6 clusters. For theS. cerevisiae 1 data, BHC-SE is the only method to favour around 13 clus-ters. Simulated data sets generated from the Gaussian processes with half the noise standard deviation were always partitioned by BHC-SE into exactly the original number of clusters of 6 and 13 (data not shown).
Modelling outlier measurements
We investigated the effect of using the mixture model likelihood. Figure 5 shows for an example of a noisy gene from three of the data sets, the clusters to which the gene was assigned using standard BHC (with a sin-gle likelihood function) and mixture BHC (with a mix-ture model likelihood function).
In the S. cerevisiae 1data set, four of the 169 genes were assigned to different clusters using the mixture BHC-SE instead of standard BHC-SE. There was no change in the clustering partition for BHC-C. For stan-dard BHC-SE, the FSP2 (IsoMaltase)gene is annotated with several GO terms which are over-represented in its
)!&# )'(&'
(*&%)"+
$ " )'(&)
[image:9.595.305.539.86.272.2]
$ " )'(& "& )'(
Figure 3H. sapiens simulated data. Relative frequencies of the
estimated number of clusters obtained when a variety of clustering algorithms (BHC-C, BHC-SE, SplineCluster with linear and cubic splines, MCLUST and SSClust) were applied to simulated data sets (due to slow running times, we only used 100 of the 1000 simulated data sets to obtain the SSClust results). For each clustering algorithm, we draw lines between relative frequency values to aid interpretability. Each simulated data set was generated from the 6 Gaussian processes obtained from the BHC-SE clustering of theH. sapiensdata set, and has the same number of genes, timepoints and per cluster noise levels. Note that, for SSClust, we specified the maximum permissible number of clusters to be 12.
)!&# )'(&'
(*&%)"+
$ " )'(&)
[image:9.595.57.290.420.603.2]
$ " )'(& "& )'(
Figure 4S. cerevisiae 1 simulated data. As Figure 3, except that
cluster (top left in Figure 5). These GO terms include glucosidase activity, whichFSP2shares with three out of 20 genes, and the whole cluster has a BHI of 0.46. When using mixture BHC-SE, theFSP2gene expression at time point 11 has been treated as an outlier measure-ment, which has resulted in the FSP2 gene no longer being a member of this noisy cluster wherePCC = 0.42, but being assigned to a tighter(PCC = 0.75), more bio-logically homogeneous cluster (bottom left in Figure 5), with a higher BHI of 0.50, and where all of the four members, SOR1 (Sorbitol dehydrogenase), RFC2
(Repli-cation Factor C), RMA1 (Reduced Mating A)and FSP2
are annotated as being involved incatalytic activity. In
the S. cerevisiae 2 data set, the standard BHC cluster
containing theCSM3 (Chromosome Segregation in Meio-sis) gene (top middle in Figure 5 ) does not contain any over-represented GO terms at a significance level ofp< 0.01, and has a BHI of 0.42. This cluster is quite noisy, with aPCC of 0.16. Using a mixture model likelihood allows BHC to treat theCSM3 expression level at time point 2 as an outlier value. This allows theCSM3 gene to join a tighter cluster (bottom middle in Figure 5) with aPCC of 0.94, where it shares over-represented GO terms such as mitotic sister chromatid cohesion, DNA replicationandM phase of mitotic cell cycle, with 9 of the 15 cluster members.
In the E. colidata set, the clustering partition using BHC-C has only one gene,WcaC, (Putative colanic acid biosynthesis glycosyl transferase)assigned to a different
cluster, when comparing standard and mixture BHC. The cluster containing this gene for standard BHC-C (top right in Figure 5) has no over-represented GO terms and a BHI of 0.22. Using the mixture mode likeli-hood allows time point 4 of theWcaCexpression profile to be treated as an outlier value and the gene is reas-signed to a highly correlated cluster (bottom right in Figure 5) where thePCC = 0.98and whereWcaCshares several significant GO terms with two of the other three genes in the cluster, such as lipopolysaccharide biosyn-thetic process. For all data sets the gene lists and plots of clusters for both BHC-SE and BHC-C using the mix-ture model likelihood are available in Additional File 2.
Inclusion of replicate information
We investigated the effect of including the replicate information. Figure 6 shows the effect on a cluster from each dataset which has replicate information.
The standard BHC cluster from the S. cerevisiae 2 data set (top left Figure 6) has over-represented GO terms, such asDNA replication, DNA repairand hydro-lase activity. Including the replicate information in the BHC clustering resulted in profiles which are subtly dif-ferent during the first few time points being distin-guished and reassigned (top right Figure 6), as shown by the increase in thePCCfrom 0.91 to 0.92 and 0.94 for the two resulting ‘child’clusters. These two child clus-ters have similar over-represented GO terms to the ori-ginal cluster.
Cluster containing gene
FSP2gene from
S. cerevisiae 1data set
CSM3gene from
S. cerevisiae 2data set WcaCgene fromE.colidata set
BHC with single model likelihood
0 2 4 6 8 10 12 14 16 18
ï3
ï2
ï1 0 1 2 3 4
0 5 10 15
ï3 ï2 ï1 0 1 2 3
0 2 4 6 8 10 12 14
ï2
ï1.5
ï1
ï0.5 0 0.5 1 1.5 2 2.5
¯
PCC = 0.42, BHI = 0.46 PCC¯ = 0.16, BHI = 0.42 PCC¯ = 0.80, BHI = 0.22
BHC with mixture model likelihood
0 2 4 6 8 10 12 14 16 18
ï4
ï3
ï2
ï1 0 1 2 3
0 5 10 15
ï2.5 ï2 ï1.5 ï1 ï0.5 0 0.5 1 1.5 2 2.5
0 2 4 6 8 10 12 14
ï1.5
ï1
ï0.5 0 0.5 1 1.5 2 2.5
¯
[image:10.595.53.541.87.315.2]PCC = 0.75, BHI = 0.50 PCC¯ = 0.94, BHI = 0.68 PCC¯ = 0.98, BHI = 1
Figure 5Effect of a mixture model likelihood on noisy gene classification. Using a mixture model likelihood allows BHC to model certain
Including the replicate information for theH. sapiens data set resulted in the distinct and highly correlated (PCC = 0.90), profiles of the two genesCASP7 (Caspase 7)andIKZF1 (IKAROS family zinc finger 1)being distin-guished (middle row, Figure 6). These genes are both members of the disease-specific gene signature of the neoplastic disease Mantle cell lymphoma [36] and their protein products are both implicated in apoptosis [37,38]. An unusually noisy cluster (bottom left Figure 6) was formed using standard BHC for theE. colidata set, with aPCC = 0.0023. However, this cluster contains several over-represented GO terms such asmetal ion binding. Including replicate information allows this cluster to be split into three clusters with distinct profiles (bottom right Figure 6). The child cluster with BHI = 0.12 has no over-represented GO terms and the remaining two child clusters have similar over-represented GO terms to the standard BHC cluster. For all data sets the gene lists and plots of clusters for both BHC-SE and BHC-C using replicate information are available in Additional File 2.
Run time
Table 2 gives the run time for our BHC algorithm for each of the four data sets used in this paper. The most time-intensive calculation in the BHC algorithm is the
inversion of the covariance matrix,K, which has dimen-sionGT×GT, whereGis the number of genes in a clus-ter andTis the number of time points in the data set. To reduce the calculation time, we arranged the data by order of time points, which gives the corresponding cov-ariance matrix a block matrix structure. Using thematrix inversion lemmawith recursion as detailed in Rasmussen [39], this then only requires the inversion of a singleT× T matrix. The hyperparameter optimisations now become the factor limiting the algorithm run time.
Conclusions
We have presented an extension to the BHC algorithm [14] for time-series microarray data, using a likelihood based on Gaussian process regression, which learns the optimum number of clusters given the data, and which incorporates non-uniformly sampled time points. We have extensively tested the performance of BHC against other leading clustering methods for four sets of time series data, and found that BHC consistently produced more coherent clusters both in terms of expression pro-files and biological function.
BHC facilitates the inclusion of replicate information, and our results clearly demonstrate an improvement in the ability to distinguish between distinct expression
Data set Cluster from Clusters from BHC with standard BHC replicate information
S. cerevisiae 2 ï30 5 10 15 ï2 ï1 0 1 2 3
0 5 10 15 ï3 ï2 ï1 0 1 2 3
0 5 10 15 ï2.5 ï2 ï1.5 ï1 ï0.5 0 0.5 1 1.5 2 2.5 ¯
PCC = 0.91 PCC¯ = 0.94 PCC¯ = 0.92 BHI = 0.74 BHI = 0.70 BHI = 0.84
H. sapiens ï31 2 3 4 5 6 7 8 9 10 ï2 ï1 0 1 2 3
1 2 3 4 5 6 7 8 9 10 ï3 ï2 ï1 0 1 2 3
1 2 3 4 5 6 7 8 9 10 ï3 ï2 ï1 0 1 2 3 ¯
PCC = 0.46 PCC¯ = 0.90 PCC¯ = 0.51
BHI = 0.70 * BHI = 0.70
E. coli ï30 2 4 6 8 10 12 14 ï2 ï1 0 1 2 3
0 2 4 6 8 10 12 14 ï2.5 ï2 ï1.5 ï1 ï0.5 0 0.5 1 1.5 2 2.5
0 2 4 6 8 10 12 14 ï2.5 ï2 ï1.5 ï1 ï0.5 0 0.5 1 1.5 2 2.5
0 2 4 6 8 10 12 14 ï3 ï2 ï1 0 1 2 3 ¯
[image:11.595.57.540.89.363.2]PCC = 0.0023 PCC¯ = 0.40 PCC¯ = 0.31 PCC¯ = 0.16 BHI = 0.28 BHI = 0.12 BHI = 0.28 BHI = 0.34
Figure 6Effect of including replicate information on noisy clusters. Using replicate information can split a noisy cluster into smaller more
profiles when this replicate information is included. Microarray data typically contain outlier observations, which should not be treated together with the majority of observations. One unique aspect of the BHC algorithm presented in this paper is its ability to model these noisy outlier measurements using a mixture model likelihood. The result is that genes with a small number of noisy values, which would otherwise have been assigned to a noisy cluster, are assigned to a biologically relevant cluster, where the noisy gene shares biological functions with the other cluster members. This method provides a step towards a better treatment of the noise inherent in mea-surements from high-throughput post-genomic technologies.
Availability
Timeseries BHC is available as part of the R package ‘BHC’ (version 1.5), which is available for download from Bioconductor (version 2.9 and above) via http:// www.bioconductor.org/packages/release/bioc/html/BHC. html?pagewanted=all. The timeseries functionality was developed under R version 2.13. The ‘BHC’package is available for Mac OS X, Linux and Windows operating systems.‘BHC’is released under the Gnu GPL (v3).
Additional material
Additional file 1: The clustering method of Zhou et al. Further details for running the method of Zhouet al.
Additional file 2: Genes lists and cluster plots. Gene lists and cluster eps files for theS. cerevisiae 1, S. cerevisiae 2, E. coliand H. sapiens data sets using BHC with both squared exponential SE) and cubic (BHC-C) covariances. For each covariance option, results are given for the single model likelihood, mixture model likelihood, and including replicate information.
Additional file 3: GO annotation matrix for S. cerevisiae 1 data set clustered using BHC with cubic spline covariance. A large version of Figure 2, left panel.
[image:12.595.56.539.101.163.2]Additional file 4: GO annotation matrix for S. cerevisiae 1 data set clustered using SplineCluster with linear splines. A large version of Figure 2, right panel.
Acknowledgements and Funding
We thank Francesco Falciani and Gianni Dehò for providing theE. colidata set, and Christopher Penfold for ranking this data set by differential expression using the GP2Sample software. We also thank Zoubin
Ghahramani and Jim Griffin for helpful discussions. DLW, PDWK and RD acknowledge support from the EPSRC (grant EP/F027400/1, Life Sciences Interface). RSS acknowledges support from an MRC Biostatistics Fellowship. EJC acknowledges support from the MOAC Doctoral Training Centre.
Author details 1
Department of Chemistry, University of Warwick, Coventry, UK.2Systems Biology Centre, University of Warwick, Coventry, UK.
Authors’contributions
EJC and RSS wrote the clustering code, EJC and PDWK analysed the simulated data and performed bootstrapping, EJC performed the clustering analysis, RD optimised the C++ code and updated the BHC Bioconductor package, DLW designed and directed the research. All authors contributed ideas, participated in writing this article, and read and approved the final manuscript.
Received: 12 May 2011 Accepted: 13 October 2011 Published: 13 October 2011
References
1. Stegle O, Denby KJ, Cooke EJ, Wild DL, Ghahramani Z, Borgwardt KM:A Robust Bayesian Two-Sample Test for Detecting Intervals of Differential Gene Expression in Microarray Time Series.Journal of Computational Biology2010,17:355-367.
2. Eisen M, Spellman P, Brown P, Botstein D:Cluster Analysis and Display of Genome-wide Expression.Proceedings of the National Academy of Sciences
1998,95:14863-14868.
3. McLachlan GJ, Bean RW, Peel D:A mixture model-based approach to the clustering of microarray expression data.Bioinformatics2002,18:413-422. 4. Schliep A, Costa IG, Steinhoff C, Schonhuth A:Analyzing Gene Expression
Time-Courses.IEEE/ACM Trans Comput Biol Bioinform2005,2:179-193. 5. Beal M, Krishnamurthy P:Gene Expression Time Course Clustering with
Countably Infinite Hidden Markov Models.Proceedings of the Proceedings of the Twenty-Second Conference Annual Conference on Uncertainty in Artificial Intelligence (UAI-06)Arlington, Virginia: AUAI Press; 2006, 23-30. 6. Bar-Joseph Z, Gerber G, Gifford D, Jaakkola T, Simon I:Continuous
representations of time-series gene expression data.Journal of Computational Biology2003,10(3-4):341-356.
7. Heard NA, Holmes CC, Stephens DA, Hand DJ, Dimopoulos G:Bayesian coclustering of Anopheles gene expression time series: Study of immune defense response to multiple experimental challenges. Proceedings of the National Academy of Sciences2005,102(47):16939-16944. 8. Heard NA, Holmes CC, Stephens DA:A Quantitative Study of Gene
Regulation Involved in the Immune Response of Anopheline Mosquitoes: An Application of Bayesian Hierarchical Clustering of Curves.Journal of the American Statistical Association2006,101(473):18. 9. Ma P, Castillo-Davis CI, Zhong W, Liu JS:A data-driven clustering method
for time course gene expression data.Nucleic Acids Research2006, 34:1261-1269.
10. Liverani S, Cussens J, Smith JQ:Searching a Multivariate Partition Space Using MAX-SAT.InComputational Intelligence Methods for Bioinformatics and Biostatistics, 6th International Meeting, CIBB 2009 Genova, Italy, Volume 6160 of Lecture Notes in Computer Science.Edited by: Masulli F, Peterson L, Tagliaferri R. Springer, Heidelberg; 2010:240-253.
11. Ng SK, McLachlan GJ, Wang K, Jones LBT, Ng SW:A Mixture model with random-effects components for clustering correlated gene-expression profiles.Bioinformatics2006,22:1745-1752.
Table 2 Run time
Data set BHC-SE BHC-SE mixture model Genes Time points Replicates
S. cerevisiae 1 6 m 3 s 38 m 49 s 169 17 N/A
S. cerevisiae 2 24 m 8 s 5 h 48 m 440 15 2
H. sapiens 19 s 49 s 58 10 44
E. coli 7 m 6 s 34 m 39 s 200 13 6
[image:12.595.301.537.397.731.2]12. Bar-Joseph Z:Analyzing time series gene expression data.Bioinformatics
2004,20(16):2493.
13. Heller KA, Ghahramani Z:Bayesian Hierarchical Clustering.Twenty-second International Conference on Machine Learning (ICML-2005)2005.
14. Savage RS, Heller K, Xu Y, Ghahramani Z, Truman WM, Grant M, Denby KJ, Wild DL:R/BHC: Fast Bayesian Hierarchical Clustering for Microarray Data.BMC Bioinformatics2009,10:242.
15. Heard NA:Iterative Reclassification in Agglomerative Clustering.Journal of Computational and Graphical Statistics2010,1:1-17.
16. Zhou C, Wakefield J, Breeden L:Bayesian Analysis of Cell-Cycle Gene Expression Data.University of Washington Biostatistics Working Paper Series
2005,276.
17. Liu Q, Lin K, Anderson B, Smyth P, Ihler A:Estimating replicate time shifts using Gaussian process regression.Bioinformatics2010,26:770-776. 18. Smith JQ, Anderson PE, Liverani S:Separation measures and the geometry
of Bayes factor selection for classification.Journal of the Royal Statistical Society2008,70:957-980.
19. Chu W, Ghahramani Z, Falciani F, Wild DL:Biomarker discovery in microarray gene expression data with Gaussian processes.Bioinformatics
2005,21:3383-3393.
20. Kirk PDW, Stumpf MPH:Gaussian process regression bootstrapping: exploring the effect of uncertainty in time course data.Bioinformatics
2009,25:1300-1306.
21. Kuss M, Pfingsten T, Csato L, Rasmussen CE:Approximate Inference for Robust Gaussian Process Regression, Technical Report No. 136.Max Planck Institute for Biological Cybernetics, Tuübingen2005.
22. Cho R, Campbell M, Steinmetz EWL, Conway A, Wodicka L, Wolfsberg T, Gabrielian A, Landsman D, Lockhart DJ, Davis R:A Genome-Wide Transcriptional Analysis of the Mitotic Cell Cycle.Molecular Cell1998, 2:65-73.
23. Savage RS, Ghahramani Z, Griffin JE, de la Cruz BJ, Wild DL:Discovering Transcriptional Modules by Bayesian Data Integration.Bioinformatics
2010,26:i158-i167.
24. Orlando DA, Lin YL, Bernard A, Wang JY, Socolar JES, Iversen ES, Hartemink AJ, Haase SB:Global control of cell cycle transcription by coupled CDK and network oscillators.Nature2008,453(7197):994-947. 25. Spellman P, Sherlock G, Zhang M, Iyer VR, Anders K, Eisen M, Brown P,
Botstein D, Futcher B:Comprehensive Identification of Cell Cycle regulated Genes of the Yeast Saccharomyces cerevisiae by Microarray Hybridization.Molecular Biology of the Cell1998,9:3273-3297.
26. Pramila T, Wu W, Miles S, Noble W, Breeden L:The Forkhead transcription factor Hcm1 regulates chromosome segregation genes and fills the S-phase gap in the transcriptional circuitry of the cell cycle.Genes and Development2006,20:2266-2278.
27. Rangel C, Angus J, Ghahramani Z, Lioumi M, Sotheran E, Gaiba A, Wild DL, Falciani F:Modeling T-cell activation using gene expression profiling and state-space models.Bioinformatics2004,20:1361-1372.
28. Carzaniga T, Sarti D, Trevino V, Buckley C, Salmon M, Moobed S, Wild DL, Constantinidou C, Hobman JL, Dehò G, Falciani F:The analysis of cellular transcriptional response at the genome level: Two case studies with relevance to bacterial pathogenesis.InMicroarray Technology Through Applications.Edited by: Falciani F. Taylor 2007:125-154.
29. Datta S, Datta S:Methods for evaluating clustering algorithms for gene expression data using a reference set of functional classes.BMC Bioinformatics2006,7:397.
30. Brock G, Pihur V, Datta S, Datta S:clValid: An R package for cluster validation.Journal of Statical Software2008,25:1-22.
31. Efron B:Bootstrap Methods: Another Look at the Jackknife.The Annals of Statistics1979,7:1-26.
32. Ramoni MF, Sabastiani P, Kohane IS:Cluster analysis of gene expression dynamics.Proceedings of the National Academy of Sciences2002, 14:9121-9126.
33. Saeed AI, Sharov V, White J, Li J, Liang W, Bhagabati N, Braisted J, Klapa M, Currier T, Thiagarajan M, Sturn A, Snuffin M, Rezantsev A, Popov D, Rytsov A, Kostukovich E, Borisovsky I, Liu Z, Vinsavich A, Trush V, Quackenbush J:TM4: a free, open-source system for microarray data management and analysis.Biotechniques2003,34:374-378.
34. Yeung K, Fraley C, Murua A, Raftery AE, Ruzza WL:Model-based clustering and data transformations for gene expression data.Bioinformatics2001, 17:977-987.
35. Zhou C, Wakefield J:A Bayesian Mixture Model for Paritioning Gene Expression Data.Biometrics2006,62:515-525.
36. Martínez N, Camacho FI, Algara P, Rodríguez A, Dopazo A, Ruíz-Ballesteros E, Martín P, Martínez-Climent JA, García-Conde J, Menárguez J, Solano F, Mollejo M, Piris MA:The Molecular Signature of Mantle Cell Lymphoma Reveals Multiple Signals Favoring Cell Survival.Cancer Research2003,63:8226-8232.
37. Pulte D, Lopez RA, Baker ST, Ward M, Ritchie E, Richardson CA, O’Neill DW, Bank A:Ikaros Increases Normal Apoptosis in Adult Erythroid Cells. American Journal of Hematology2006,81:12-18.
38. Clarke CAL, Bennett LN, Clarke PR:Cleavage of Claspin by Caspase-7 during Apoptosis Inhibits the Chk1 Pathway.The Journal of Biological Chemistry2005,42:35337-35345.
39. Rasmussen CE, Williams CKI:Matrix Identities.Gaussian Processes for Machine LearningThe MIT Press, Cambridge, USA; 2006, 201-202.
doi:10.1186/1471-2105-12-399
Cite this article as:Cookeet al.:Bayesian hierarchical clustering for microarray time series data with replicates and outlier measurements.
BMC Bioinformatics201112:399.
Submit your next manuscript to BioMed Central and take full advantage of:
• Convenient online submission
• Thorough peer review
• No space constraints or color figure charges
• Immediate publication on acceptance
• Inclusion in PubMed, CAS, Scopus and Google Scholar
• Research which is freely available for redistribution