“Inequality, Trade Liberalisation and Growth”
Oliver Morrissey, Jennifer Mbabazi and Chris Milner
CSGR Working Paper No. 102/02
July 2002
Inequality, Trade Liberalisation and Growth Oliver Morrissey, Jennifer Mbabazi and Chris Milner1
CREDIT and School of Economics, University of Nottingham CSGR Working Paper No 102/02
July 2002
Abstract
There has been a recent resurgence of interest in the relationship between income inequality and growth. We use the WIDER/UNDP World Income Inequality Database to investigate the effects of inequality and trade liberalisation on growth in a sample of exclusively developing countries. Cross-section (long-run) and panel (short run) techniques are used to test for the effect of inequality on growth controlling for other variables (initial GDP, endowments, investment, human capital and natural barriers to trade). We find consistent evidence for a negative effect of inequality on growth in the long run but no significant effect in the short run. Trade liberalisation appears to have a consistent and significant positive association with growth. These results are quite robust to the inclusion of alternative control variables, and we find no evidence of any interaction affect between inequality and trade liberalisation. We also find consistent evidence that countries relatively endowed with land (and thus dependent on primary commodity exports) and/or that face high natural barriers to trade experience lower growth rates. There is also evidence that, controlling for most other variables, sub-Saharan African countries experience below average growth performance; however, accounting for trade restrictions and natural barriers seems to eliminate this effect. The evidence suggests that inequality is an important factor in explaining low growth in developing countries over the long run.
Keywords: Inequality, cross-country growth, trade liberalisation
Address for correspondence Dr Oliver Morrissey
School of Economics University of Nottingham Nottingham, NG7 2RD, UK
Email: oliver.morrissey@nottingham.ac.uk
1 The authors are respectively Reader, research student and Professor in the School of Economics, University of
1 Introduction
Research on the determinants of growth in developing countries has become concerned with possible linkages between policy reform, growth and inequality. Forbes (2000), in particular, has injected new life into analysis of the effect of inequality on growth. In principle, the relationship between inequality and growth may be in either direction – most analysis considers inequality as a determinant of growth, although growth may influence inequality. Empirically, there is no consistent evidence that growth (or the lack of it) affects within-country inequality on average (Ravallion, 2001). Milanovic (2002) shows that although global inequality rose between 1988 and 1993, this was due almost completely to an increase in inequality between countries, while within-country inequality was largely unaffected. If globalisation affects world inequality it is most likely to be because of differential growth rates between countries. We consider the extent to which initial inequality is a factor explaining growth differences.
Our aim is to explore the inequality-growth relationship for a sample of developing countries only. We use data that has recently been made available in the World Income Inequality Database (WIID, compiled by UNDP and WIDER) to construct a panel of 44 developing countries, including countries from sub-Saharan Africa (SSA). This sample benefits from being somewhat less heterogeneous than studies combining developed and developing countries, and we can be reasonably confident of the validity of pooling the countries in the cross-section regressions (and do test for outliers). However, we have the problem of including many poor performing economies whose growth is difficult to model, in particular SSA countries.
once trade liberalisation actually occurs it is expected to reduce the negative impact of inequality on growth.
Income inequality may have a direct effect in retarding growth. That is, an unequal distribution of income may mean that the majority of the population does not share in the benefits of growth, hence the incentives to them to contribute to growth are muted (e.g. weaker incentives to work harder or be entrepreneurial). This would be an ‘anti trickle down’ view of growth, but is consistent with some of the evidence for East Asia – that ‘shared growth’ encourages dynamism and effort (Morrissey and Nelson, 1998). Trade liberalisation should promote growth as it increases the efficiency of the economy, but the effect on inequality is ambiguous. Workers may shift from declining (import competing) to expanding (exporting) sectors, without any change in the overall level of income inequality. In this case there need not be a direct effect of trade liberalisation on the inequality-growth relationship.
An alternative view is that income inequality is representative of other distortions in the economy, and can be used as a proxy measure for these growth-retarding features of the economy. In an economy where power is concentrated, distortions are widespread and rent-seeking is prevalent, we may expect to observe relatively high levels of inequality (and relatively poor growth performance). In such a case, trade liberalisation is a signal of policy reform that reduces (some) distortions. Consequently, trade liberalisation in this view will alter the nature of the inequality-growth relationship. It need not affect the level of inequality, although one would expect inequality to fall as distortions are reduced and incentives increased.
Section 2 provides a brief overview of the theoretical and empirical literature on the impact of inequality on growth. Section 3 presents a brief discussion of the data and specifications used in the analysis. Section 4 presents the results for the cross-section, or long-run, relationship, and finds evidence that inequality does appear to reduce growth, controling for trade variables (openness, natural endowments and natural barriers). Section 5 extends this analysis with panel estimates to explore the short-run aspects of the relationships. Trade liberalisation is found to have a positive effect on growth, but this effect is dampened if natural barriers are high and/or if inequality is high. Section 6 concludes by relating our evidence to the theories outlined in the second section.
2 A Brief Overview the Literature
Most of the theoretical economics literature posits that inequality has a negative impact on growth. There are four general categories of model that explain how an unequal initial distribution of assets and income can affect growth. For convenience these can be termed political economy, social conflict, credit market and X-inefficiency models.
The social conflict approach observes that an unequal distribution of resources is a source of political tension and social conflict. In such a socio-political environment, property rights are insecure and this discourages accumulation. The higher is the gap between the rich and the poor, the greater is the temptation to engage in rent seeking and this in turn reduces investment and constrains the ability of the government to respond to shocks (Benabou, 1996; Rodrik, 1998). Alesina and Perotti (1996) argue that greater inequality leads to less political stability and consequently sub-optimal investment levels.2 Nafziger and Auvinen (2002) report that high inequality is a determinant of conflict and humanitarian emergencies.
The credit markets channel (Tsiddon, 1992) is underpinned by the fact that investments are lumpy and access to credit depends on the existence of collateral. Consequently, there is a credit constraint stemming from unequal initial distribution of assets, and this hinders growth. In this context, inequality of land holdings represents a constraint on growth in the agriculture sector, typically the major productive sector in poor developing countries. A related argument is that greater income equality encourages human capital accumulation, as there are fewer liquidity constraints and investment in human capital is lumpy (Chiu, 1998).
The fourth approach is based on the argument that high inequality reduces the X-efficiency of workers. X-efficiency refers to a measure of workers’ productivity holding constant all other inputs into the production process including workers’ skills (Leibenstein, 1966, cited in Birdsall et al, 1995). Workers’ productivity is limited by a ‘virtual’ glass ceiling as they do not visualise themselves progressing beyond a certain point and this discourages effort and perpetuates a vicious cycle of low incomes and therefore high inequality. Thus, inequality has a disincentive effect that retards growth.
In all of these theories inequality has a disincentive effect that retards growth. The first three approaches are accumulation-based and long run in nature; they relate inequality to growth in an indirect way, via investment. This fourth theory relates to incentives and labour
2 A number of recent studies provide evidence that political instability reduces growth in SSA
productivity, rather than investment and accumulation. As such, this can be viewed as a direct effect of inequality on growth that should be apparent even over the relatively short run.
Empirical Evidence on Inequality and Growth
The 1990s has seen a growing interest in research on whether inequality retards growth. Most empirical work has relied on the Gini coefficient or income shares as measures of inequality. Mbabazi et al (2001) summarise a range of studies, and the principal findings are:
•= There is general evidence for a negative effect of inequality on economic growth, although this result is not robust in all specifications (Birdsall et al, 1995). Benabou (1996: Table 2) summarises a range of studies and shows that the balance of evidence is for a negative and significant relationship.
•= Land inequality tends to have a more robust (negative) influence on growth than income inequality (Alesina and Rodrik, 1994; Birdsall and Londono, 1997; Deininger and Squire, 1998).
•= There is evidence, at least for developed countries, for a positive, significant and robust relationship between inequality and growth in the medium and short run, that is, higher inequality is associated with higher growth (Forbes, 2000). This is in contrast to the evidence for a negative relationship in the long run.
The differences in the results from studies of the inequality-growth relationship can be largely attributed to four factors – differences in sample coverage, time period, data quality and estimation methods. Forbes (2000) sample includes no sub-Saharan African country and half of the sample comprises OECD countries. About half of the countries in the samples used by Deininger and Squire (1998), Barro (1999), Banerjee and Duflo (2001) are developing. The evidence suggests that the relationship is different for OECD as compared with developing countries. For this reason we use a sample of developing countries only.
Data quality is always a problem for econometric analysis of developing countries, and is especially acute regarding inequality. The Deininger and Squire (1996) database is widely accepted as one of the most reliable sources of data on inequality (and is included in the WIID data source we draw on). Knowles (2001) provides a critical discussion of this data, demonstrating that the use of income as against expenditure based measures biases the results. Nevertheless, as being the most widely comparable data available, we use the WIID data.
Another reason for differences in results could be the estimation methods. Cross-section estimation methods have many weaknesses, documented by, among others, Levine and Renelt (1992). The use of panel estimation methods to control for country and time specific effects has been precluded by the paucity of good quality data. Forbes (2000) stands out in this regard. Banarjee and Duflo (2000) present a sophisticated econometric analysis of the relationship between inequality and growth, allowing for a non-linear relationship and accounting for country-specific differences. They find no evidence of a consistent relationship between the level of inequality and growth; much depends on the data and sample used, and the other control variables included. However, their principal results are that changes in inequality, in any direction, tend to have a negative effect on growth and that inequality changes are less in those countries with higher initial levels of inequality. They find that lagged inequality has a negative impact on growth in those countries where inequality is relatively low (perhaps because it is more likely to change in such cases).
and may provide an impetus for reduced inequality. Thus, we expect to observe effects of inequality and trade liberalisation on growth, and of some interaction between the two.
3 Data and Empirical Specification
The analysis is based on data for 44 developing countries over the period 1970-95 (details on data and sources are provided in the Appendix). Our dependent variable is growth in per capita GDP (GROWTH). The growth literature points to the importance of initial values in explaining subsequent growth, and these are captured by the initial value of real GDP (GDP0). The additional variables are measures of the increases in the stock variables. The increase in the capital stock is captured by the average rate of investment (INV). Secondary school enrolment (SEC, the average over the whole period) is the proxy for investment in human capital.
As our concern is specifically with inequality, the basic specification estimated, similar to that used in most empirical work in this area (Perotti, 1996, Forbes, 2000), is:
GROWTH = β0 + β1GINI + β2GDP0 + β3SEC + β4INV + µ (1)
If initial income (GDP0) captures convergence the expected sign is negative. However, in a cross-country regression it may capture country-specific initial conditions, and the sign could be positive. The coefficient on GINI is expected to be negative. The coefficients on SEC and INV are expected to have positive signs. Note that this measure of human capital is aggregate, and not broken down by gender, nor do we include the purchasing power parity of the investment deflator relative to that in the United States as a proxy for market distortion (but we do use an measure of trade policy distortion). The variables included above are widely accepted as core explanatory variables.
there is an ‘Africa effect’ in our sample. We then include a measure of natural resource endowment (NRE) to capture important structural features of the economy. The underlying hypothesis is that countries with relatively low endowments of natural resources, thus relatively high labour endowments, will need to industrialise to promote export growth and avail of their comparative advantage (Mayer and Wood, 2001). However, countries endowed with natural resources will tend to have export dependence on primary commodities. This can retard growth both because extractive industries have weak linkages with the rest of the economy (or agricultural exports are largely unprocessed) and because primary commodities tend to face deteriorating terms of trade. This may help, in particular, to explain Africa’s poor growth performance (Wood and Mayer, 2001). Countries with higher NRE values are predicted to exhibit slower growth.
Then we include two trade variables. There is a large literature on the relationship between trade policy and growth, and the difficulties of measuring trade stance are well known (see Edwards, 1993, 1998; Greenaway et al, 1998; Milner and Morrissey, 1999; Rodrik, 1992, 1998, 1999). Given the problems of measuring openness we use one of the more widely accepted measures, the proportion of years between 1965 and 1990 that an economy could be considered open (OPEN), from Sachs and Warner (1997). This measure has demonstrated robustness in empirical studies (Harrison, 1996; Edwards, 1998). We also include by the ratio of cif unit import prices to fob prices as a measure of natural barriers to trade (NBT). There is recent evidence that high transactions costs to trade can be a constraint on growth, and in particular can limit the beneficial effects of trade liberalisation (Milner et al, 2000).
commodities (for which transport costs are likely to be a higher share of value). We note that NRE has much higher variance.
4 Cross-section (long-run) Results
Table 1: Cross-section Regressions for Growth: Base Specification
(1.1) (1.2) (1.3)
GINI -0.050**
(-2.41)
-0.040* (-2.00)
-0.039* (-1.91)
GDP0 -0.0005
(-1.56)
-0.0004 (-1.28)
-0.0004* (-1.70)
SEC 0.021
(0.98)
0.006 (0.26)
INV 0.272***
(6.53)
0.262*** (6.44)
0.270*** (7.02)
SSA -1.298**
(-2.53)
-1.387*** (-3.05)
R2 (adj) 0.572 0.602 0.612
N 42 42 42
Notes: Figures in parentheses are t-ratios: *** denotes significant at 1 percent level, ** significant
Table 2: Cross-section Regressions with Openness
(2.1) (2.2) (2.3) (2.4) GINI -0.025*
(-2.01) -0.045** (-2.59) -0.027** (-2.16) -0.048*** (-2.95) GDP0 -0.0004*
(-1.91) -0.0004 (-1.50) -0.0005** (-2.66) -0.0005** (-2.19) SEC 0.014
(0.79) 0.010 (0.41) 0.017 (1.22) 0.014 (0.77) INV 0.247***
(7.31) 0.236*** (5.59) 0.187*** (4.40) 0.160*** (3.17) SSA -1.158**
(-2.70) -1.085** (-2.11) -0.883** (-2.48) -0.707 (-1.54) NRE -0.039***
(-5.00)
-0.039*** (-8.65)
NBT -8.485**
(-2.57)
-11.149*** (-3.48)
OPEN 2.026***
(4.08)
2.292*** (3.48) R2 (adj) 0.722 0.621 0.793 0.709
N 42 42 42 42
Notes: As for Table 1. Further details available on request.
ownership of resources, such as land, is greater than income inequality, and will tend to have a greater (negative) effect on growth when NRE is high.3
The final two columns of Table 2 include a variable for the orientation of the trade regime. The results in regressions (2.3) and (2.4) show that the coefficient on OPEN is positive and significant. Thus, openness is conducive to growth. The inclusion of OPEN adds to the explanatory power of the regression and does not affect the coefficients on other variables, except that the coefficients on INV and SSA are smaller. These results suggest that part of the positive effect of INV is due to openness, while part of the ‘negative SSA effect’ is due to those countries being closed. Note that the SSA dummy remains negative and significant except in regression (2.4), in which the coefficient on NBT is large and highly significant. The SSA countries will all have low values of OPEN, although accounting for this alone does not eliminate the ‘SSA effect’. Similarly, most SSA countries will tend to have high natural barriers, but this alone does not explain the negative effect. The two combined, however, appear to eliminate the significance of the SSA dummy. A possible interpretation is that openness provides less benefit to SSA countries because they face high natural barriers.
This section used cross-section estimation methods, acknowledging the shortcomings highlighted by Levine and Renelt (1992), to explore the effect of inequality on growth in developing countries. The results should not be considered in terms of the magnitude of the inequality effect on growth, rather they should be considered as an indication of the direction of the aggregate long-run effect. While there may be an omitted variable bias, we note that the coefficient estimates and significance levels appear quite robust. Furthermore, a number of control variables are used. Endogeneity of inequality is not a problem as we are using the initial value of the Gini but period growth. Similarly, as the dependent variable is long-term growth it is unlikely that endogeneity of other explanatory variables is a problem.
5 Panel Data (short-run) Estimates
3 For a smaller sample, we ran the regression using a measure of inequality of land ownership; the results were
We now turn to panel estimation methods to investigate the short run effects of inequality on growth, and the relationship of this to trade liberalisation. A panel is constructed of five 5-year time periods running from 1970-74 to 1990-1994. A sub-set of the countries in the cross-section analysis is used (determined by data availability). Investment is Gross Domestic Investment as a percentage of GDP averaged over the five year period (GDIP). The GINI is income inequality at the start of the five-year period, or as near to then as available (from WIID). A period dummy (PDum) is used for 1980-94, during which most of the sample was engaged in structural adjustment (including, for many, trade liberalisation). Starting income is measured as the log of initial GDP (GDP0) in each period. Initial period NRE and NBT values were also calculated. These variables constitute the base specification for the panel.
We are particularly concerned about the effect of trade liberalisation, and include this having controlled for the other variables in the base specification. The indicator of the timing of trade liberalisation used is the Sachs and Warner (1997) index, a dummy variable taking a value of 1 for each year beginning from the year when liberalisation is said to have occurred and 0 before this.4 We augment the Sachs-Warner index (SWaug) to add another five countries
using our judgement of when they liberalised (see Appendix).5 A criticism of dating liberalisation at a particular year is that it will take time for effects to occur, but note that we are concerned only with the period of liberalisation.
4 We also tried the World Bank and Dean indicators used in Greenaway, Morgan and Wright (1998), but the
coefficients were insignificant in almost all specifications. We are grateful to Peter Wright for providing the data.
5 Only results using SWaug are reported as this gives the largest sample. The smaller panel using SW was
Table 3: Panel Regressions with Trade Liberalisation
(3.1) (3.2) (3.3)
GINI 0.0006
(1.361)
0.0007* (1.658)
0.0006 (1.412) GDP0 -0.0211**
(-2.369)
-0.0223*** (-2.630)
-0.0230*** (-2.711)
GDIP 0.0020***
(3.501)
0.0024*** (4.379)
0.0023*** (4.413)
SWaug 0.0199***
(3.416)
0.0219*** (3.644)
NRE 0.0015
(1.282) NBT -0.0885
(-0.918)
-0.0907 (-0.989)
-0.1289 (-1.341) PDum -0.0083*
(-1.791)
-0.1581*** (-3.215)
-0.0129** (-2.379)
R2(adj) 0.401 0.459 0.463
N 145 145 145
Estimator FEM FEM FEM
Notes: As for Table 1. A Lagrange Multiplier test rejected the null hypothesis that the
classical regression model is appropriate against an alternative of fixed or random effects. The Hausman test was used to choose between Random Effects (REM) and Fixed Effects (FEM) models. Variants of were tested with NRE (always insignificant) in place of NBT but other coefficients were largely unaffected.
tended to reduce growth in the 1980s (failure to account for this may be a reason why other studies do not find a positive effect of liberalisation). The insignificance of NRE in the panel may be because it is largely time-invariant and other variables pick up any related country-specific effects. Similarly, NBT does not vary much over time.
Table 4: Panel Regressions with Interactive Terms
(4.1) (4.2) (4.3)
GINI 0.00004
(0.145)
-0.0001 (-0.400)
-0.0001 (0.395)
SECR 0.0053***
(2.962)
0.0004** (2.574)
0.0004** (2.609)
GDP0 -0.0077**
(-2.086)
-0.0077** (-2.500)
-0.0077** (-2.490)
SWaug 0.1781***
(3.479)
0.0181*** (3.539) NBT -0.1407**
(-2.217)
-0.1134** (-2.010)
-0.1127** (-1.996)
PR 0.0025
(0.855)
PT 0.0010
(0.654)
PDum -0.0239***
(-4.952)
-0.0294*** (-5.861)
-0.0294*** (-5.858) R2 (adj) 0.206 0.244 0.243
N 140 140 140
Estimator REM POLS POLS
Notes: As for Table 3. Lagrange Multiplier and Hausman tests were used to choose between
pooled OLS specification (POLS), FEM and REM. Further results available on request.
The coefficient on GINI is consistently negative but insignificant in all regressions. Neither interactive term is significant, i.e. neither PR nor PT add to the explanatory power of SWaug. There is no evidence of any interaction between liberalisation and inequality.
6 Conclusions
This paper uses cross-section and panel econometric techniques to investigate the links between growth, inequality and trade liberalisation for a sample of developing countries. There are three broad conclusions. First, within the sample, there is no evidence that those countries that are initially poorer are also more unequal. Second, inequality appears to have a negative effect on growth in the long run, although we find no evidence for a short run effect. This negative effect persists when we control for factors that promote growth (investment, education and openness), factors that retard growth (natural resource endowments and barriers to trade), and initial GDP (for which there is evidence of convergence). Third, Africa does appear to be different – even allowing for the other explanatory variables, SSA countries have a below average growth performance.
Although some results are sensitive to specification, the pattern of results for panel estimates is similar to that for the cross section. Investment is the ‘driver’ of growth, and there is evidence of convergence in the sample. Trade liberalisation tends to have a positive association with growth. High natural barriers to trade tend to be associated with lower growth, but there is no evidence that the benefits of liberalisation are less when barriers are high. However, we only find evidence for a significant effect of inequality on growth in the long-run; the coefficient on GINI is insignificant in most panel regressions.
The four theories proposed to explain the relationship between inequality and growth in Section 2 can now be evaluated against the evidence in this paper.
not redistribute income to a significant degree. Redistribution is most prevalent in richer economies, for which Forbes (2000) finds that higher inequality is associated with higher growth in the short run (which is not support for these models). There are no consistent changes in inequality in our sample, suggesting no consistent pattern of redistribution. Our evidence is that inequality has a consistent long-run negative effect on growth in developing countries.
Social conflict models can be considered as alternative ‘socio-political economy’ models, in which inequality increases tension and conflict (perhaps because it does not lead to redistribution). Conflict and social tension discourage accumulation and therefore growth. If this type of model can be interpreted as representing elite rent-seeking and corruption as social conflict measured by inequality, then this is supported by the evidence for developing countries. Higher inequality results in lower growth, and the elites behind this effect withstand pressures for redistribution.
Credit market models are based on the observation that the poor are constrained in their ability to access credit, therefore invest less and growth is lower. Our results do not test such hypotheses, even indirectly, although we do find that investment is a driver of growth. Future research could explore whether inequality does indeed constrain the level and/or productivity of investment.
The X- efficiency models are appropriate to catch the direct effect of inequality in reducing incentives for effort, hence slowing dynamism and growth. Such effects should be observable in the short-run, but we find no evidence for a negative short-run relationship between inequality and growth in developing countries.
References
Alesina, A. and Perroti, R. (1996), ‘Income distribution, political instability and investment’,
European Economic Review, 40(6), 1203-1228.
Alesina, A. and Rodrik, D. (1994), ‘Distribution Politics and Income Distribution’, Quarterly Journal
of Economics, 109(May), 465-490
Banarjee, A. and E. Duflo (2000), ‘Inequality and Growth: What can the data say?’, mimeo, Department of Economics, MIT, June 2000.
Barro, R. (1999), ‘Inequality, growth and investment’, National Bureau of Economic Research, NBER
Working Paper 7038.
Benabou R., (1996), ‘Inequality and Growth’, in Ben Bernanke and Julio Rotemberg eds., National
Bureau of Economic Research, Macro Annual 1996, MIT Press: Cambridge, MA, pp. 11-76.
http://papers.nber.org/papers/W5658.pdf.
Bertola, G. (1993), ‘Factor shares and savings in endogenous growth’, American Economic Review, 83(5), 1184-1198.
Birdsall, N. and Londono, (1997), ‘Asset Inequality matters: an assessment of the World Bank’s approach to poverty reduction, American Economic Review, 87(2), 32-37.
Birdsall, N., Ross, D., and Sabot, R. (1995), ‘Inequality and growth reconsidered: lessons from East Asia’, World Bank Economic Review, 9(3), 477-508.
Chiu, H. W. (1998), ‘Income Inequality, Human Capital accumulation and Economic Performance’,
Economic Journal, 108, 44-59.
Clarke, G.R. (1995), ‘More evidence on Income Distribution and Growth’, Journal of Development
Economics, 47(2), 403-427.
Deininger, K. and Squire, L. (1996), ‘A new data set measuring Income Inequality’, The World Bank
Economic Review, 10(3), 565-591.
Deininger, K. and Squire, L. (1998), ‘New ways of looking at old issues: inequality and growth’,
Journal of Development Economics, 57(2), 259-287.
Edwards, S. (1993), ‘Openness, Trade liberalisation and Growth in Developing Countries’, Journal
of Economic Literature, 31(3), 1358-1393.
Edwards, S. (1998), ‘Openness, Productivity and Growth: what do we really know?’, Economic
Journal, 108(447), 383-398.
Forbes, K.J. (2000), ‘A reassessment of the relationship between Inequality and Growth’, American
Economic Review, 90, 869-887.
Greenaway, D., Morgan, W. and Wright, P. (1998), ‘Trade Reform, Adjustment and Growth: what does the evidence tell us?’, Economic Journal, 108, 1547- 1561.
Guillaumont, P., S. Guillaumont Jeanney and J-F. Brun (1999), ‘How Instability Lowers African Growth’, Journal of African Economies, 8:1, 87-107.
Gyimah-Brempong, K. and T. Traynor (1999), ‘Political Instability, Investment and Economic Growth in Sub-Saharan Africa’, Journal of African Economies, 8:1, 52-86.
Harrison, A. (1996), ‘Openness and growth: a time series, cross-country analysis for developing countries’, Journal of Development Economics, 48(2), 419-447.
Knowles, S. (2001), ‘Inequality and Economic Growth: the empirical relationship reconsidered in light of comparable data’, University of Nottingham: CREDIT Research Paper 01/03.
Levine, R. and Renelt, D. (1992), ‘A Sensitivity analysis of cross-country growth regressions’,
American Economic Review, 82, 942-963.
Mayer, J. and Wood, A. (2001), ‘South Asia’s Export Structure in a Comparative Perspective’,
Oxford Development Studies, 29: 1.
Mbabazi, J., O. Morrissey and C. Milner (2001), ‘Are Inequality and Trade Liberalisation Influences on Growth and Poverty?’ WIDER Discussion Paper DP2001/132
Milanovic, B. (2002), ‘True World Income Distribution, 1988 and 1993: First Calculations Based on Household Surveys Alone’, Economic Journal, 112, 51-92.
Milner, C., Morrissey, O. and Rudaheranwa, N. (2000) ‘Policy and non-Policy Barriers to Trade and Implicit Taxation of Exports in Uganda’, Journal of Development Studies 37: 67-90.
Morrissey, O. and Nelson, D. (1998), ‘East Asian Economic Performance: Miracle or just a Pleasant Surprise?’, The World Economy, 21:7, 855-879.
Nafziger, E. and J. Auvinen (2002), ‘Economic Development, Inequality, War and State Violence’,
World Development, 30:2, 153-164.
Partridge, M.D. (1997), ‘Is Inequality Harmful for Growth? Comment’, American Economic Review, 87(5), 1019-1037.
Perotti, R. (1996), ‘Growth, Income Distribution and Democracy: what the data say’, Journal of
Economic Growth’, 1, 149-187.
Persson, T. and Tabellini, G. (1994), ‘Is inequality harmful for growth’, The American Economic
Review, 84(3), 600-621.
Ravallian, M. (2001), ‘Growth, Inequality and Poverty: Looking Beyond the Averages’, paper presented at WIDER Development Conference on Growth and Poverty, Helsinki, 25-26 May 2002. Rodrik, D. (1992), ‘The limits of Trade Policy Reform in Developing Countries’, Journal of
Economic Perspectives, 6(1), 87-105.
Rodrik, D. (1998), ‘Globalisation, Social Conflict and Economic Growth’, World Economy, 21(2), 143-158,
Rodrik, D. (1999), The New Global Economy and Developing Countries: Making Openness Work, Washington DC: ODC Policy Essay No. 24.
Sachs, J.D and Warner, A. M. (1997), ‘Sources of Slow Growth in African Economies’, Journal of
African Economies, 6(3), 335-376.
Tsiddon, D. (1992), ‘A Moral Hazard Trap to Growth’, International Economic Review, 33, 299-321. Wood, A. and Mayer, J. (2001), ‘Africa’s Export Structure in a Comparative Perspective’ Cambridge
Appendix: List of Variables and Data Sources
GDP0 = GDP per capita in 1970
GROWTH = average real per capita growth rate over 1970-1995 period
INV = average investment to GDP ratio over 1970 – 1995 period, or for sub-periods in panel estimates
SEC = secondary school enrolment rate in 1970. We also tried using percentage of primary school complete in total population (LPC) and percentage in primary school complete in population greater than 15 years (LPC15).
SECR = secondary school enrolment rate at the start of each period in the panel. GINI = Gini coefficient of income inequality
LandGini = Gini Land concentration Index NRE = Total Land per worker
NBT = CIF/FOB factor
OPEN = Proportion of the years between 1965 and 1990 that the economy is considered to be open by the criteria set by Sachs and Warner (1997).
SSA = dummy variable with the value of unity for countries in Sub-Saharan Africa and zero for all others.
SW = Sachs and Warner index of trade liberalisation. SWaug = Augmented SW index (see Table A1).
[image:24.595.102.499.629.721.2]Sources are World Development Indicators 1997 and 2000 (CD-ROM), Barro–Lee data set, World Income Inequality Database (WIID), Sachs and Warner (1997), IFAD (2001) for LandGini, International Financial Statistics Yearbook 1995 (CIF/FOB factor)
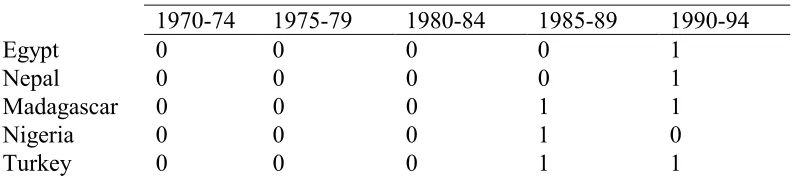
Table A1: Additional countries for Augmented Sachs-Warner Index
1970-74 1975-79 1980-84 1985-89 1990-94
Egypt 0 0 0 0 1
Nepal 0 0 0 0 1
Madagascar 0 0 0 1 1
Nigeria 0 0 0 1 0