UNIVERISTY OF TWENTE.
2015
Improving warehouse control at Royal Vezet B.V.
A simulation study on dynamic warehouse processes
i Author
J. (Jan) Lugtig University
University of Twente Master Program
Industrial Engineering & Management Specialization
Production Logistics & Management
Graduation Committee
Dr. P.C. Schuur Ir. X
First supervisor Company supervisor
University of Twente Vezet B.V.
Ir. H. Kroon Ir. Y
Second supervisor Company supervisor
ii
“Change is the law of life.
And those who look only to the past or the present are certain to miss the future.”
iii
Management summary
For many years, Vezet has faced growth in turnover and production volume. The production facility in Warmenhuizen is recently expanded, new machines are bought and new products types are introduced, but the warehouse operations have not fully participated in this growth. So, Vezet encounter more often problems with storing products in the warehouse. The managers of Vezet decided that it is time to review the warehousing performances and to research the future requirements at warehouse level. In order to perform this research, we formulated the following research question:
“What improvements does Vezet B.V. require at the outbound processes (in terms of storage capacity and investments) to meet the current and future requirements in a way that the service level remains ensured?”
We identified multiple topics which were relevant for warehousing, and concluded that the volume utilization and location utilization were the most important measures for the Vezet warehouses. In the EA-warehouse (managed by Dailycool), the main problem is related to the location utilization, while in the EAA-warehouse, the main problems are related to the volume utilization of individual locations. We created a model that is able to analyze the warehouse processes. This model helps us to acquire understanding about the warehouse operations.
In the EAA-warehouse, we have to deal with two events that require immediate attention. The introduction of new products and the switch of X products to the LVC, require changes in the current lay-out of the warehouse. Also, additional storage space for the LVC-products is required, which is urgently recommended to be located close to the alley at the COOP storage area. This is the only suitable location that can be used for storing these rollies. By the end of 2015, the LVC destination will be replaced by a new distribution center, the SFC. We concluded that these changes lead to storage problems, and that the best solution is to directly send these products to the SFC.
The production capacity of Vezet will also be expanded at the end of 2015, at the expense of the storage area of COOP. This intended expansion cannot occur before the switch from LVC to the SFC, because it leads to the outsourcing of the COOP activities due to space problems. This is not desired by the management. After the switch to the SFC, the COOP activities can be transferred to the current EAA-warehouse, because inventory of SFC-products is held in the SFC and not at Vezet. In the EA-warehouse, we found patterns in the location utilization that enlarges the current problems. One important reason for these problems is that production and distribution in the warehouse are currently not aligned. Therefore, we suggest that the order pickers in the EA-warehouse start at the same time as the production employees. This increases personnel costs, but ensures that the capacity of the warehouse does not have to be expanded until 20XX.
iv
utilization rates and the number of problems. In the table, we see that the frequency of problems is already every five days. By the improvements we suggested, the frequency of problems will decrease shortly. However for the remaining years more problems must to be expected.
xx
Table 0-1: Simulation results EA-warehouse
In 20XX, an expansion of X percent of the current warehouse area is required. However, we recommend Vezet to be prepared for the future (2025) and expand the warehouse building by xx percent, which equals X square meters.
v
Glossary
BT Battery truck
DC Distribution Center
EA-warehouse Eindproduct,Artikelen warehouse (warehouse of Dailycool)
EAA-warehouse Eindproduct,Artikelen,Assemblage warehouse (warehouse of Expedition)
FeFo First-Expired First-out
JIT Just-In-Time
KPI Key Performance Indicator
LVC National Fresh Center (Dutch: Landelijke Vers Centrale)
MPC Manufacturing Planning and Control
RDC Regional Distribution Center (Dutch: Regionaal Distributie Centrale) Rolly Half sized Euro pallet on wheels
SFC Shared Fresh Center
SKU Stock Keeping Unit
TSL Temporary Shipping Location
vi
Table of contents
1. Research design ... 1
1.1. Company description ... 1
1.2. Project motivation ... 7
1.3. Research objectives... 8
1.4. Research questions ... 8
1.5. Problem approach ... 10
2. Warehouse characteristics ... 13
2.1. A generic framework for warehouse planning and control ... 13
2.2. Application of the framework ... 14
2.3. Technological planning ... 15
2.4. Resource capacity planning ... 15
2.5. Materials planning ... 17
2.6. Conclusions ... 18
3. Data analysis ... 19
3.1. Inventory pattern ... 19
3.2. Warehouse capacity ... 23
3.3. Measuring warehouse overall performances ... 24
3.4. Summary... 25
4. Performance analysis ... 27
4.1. Real life data analysis ... 27
4.2. The EA-warehouse real life data model ... 31
4.3. The Expedition real life data model ... 33
4.4. Summary... 34
5. Tactical analysis ... 35
vii
5.2. Switch 16 products from RDC to LVC ... 35
5.3. Switch to a new distribution center ... 36
5.4. Expansion of production capacity ... 36
5.5. Solution approach tactical analysis ... 36
5.6. Summary... 37
6. Strategic analysis ... 38
6.1. Simulation model of the EA-warehouse ... 38
6.2. Growth scenarios ... 39
6.3. Future requirements at the EA-warehouse ... 40
6.4. Summary... 40
7. Conclusions and recommendations ... 42
Bibliography ... 46
Appendix A New lay-out factory due to RDC-LVC changes ... 48
Appendix B Production rate EA-warehouse ... 49
Appendix C Distribution identification production ... 50
1.
Research design
To complete the study Industrial Engineering and Management – Production and Logistics Management at the University of Twente, students have to perform an assignment at a company. This master thesis provides an overview of the assignment done at Vezet B.V. in Warmenhuizen by the author. Section 1.1 describes the company profile including key figures, history and the departments involved in this research. In the following sections, the research proposal is presented, starting in section 1.2, which explains the project motivation. In section 1.3, the problem statements are explained, followed by the research objectives in section 1.4. Finally, the research questions and approach are presented in sections 1.5 and 1.6.
1.1.
Company description
Royal Vezet B.V. (hereinafter referred to as Vezet) is the leading specialist in processing freshly chopped, ready to cook vegetables and fruits in the Netherlands. Each week an average of XX million kilograms of raw materials like onions, carrots and cauliflower is turned into products like ‘Nasi en Bami groente’, ‘Chinese Roerbakmix’ and ‘Hutspot’. Besides these items, Vezet also produces fruit salads, fresh pizzas, meals and large salads.
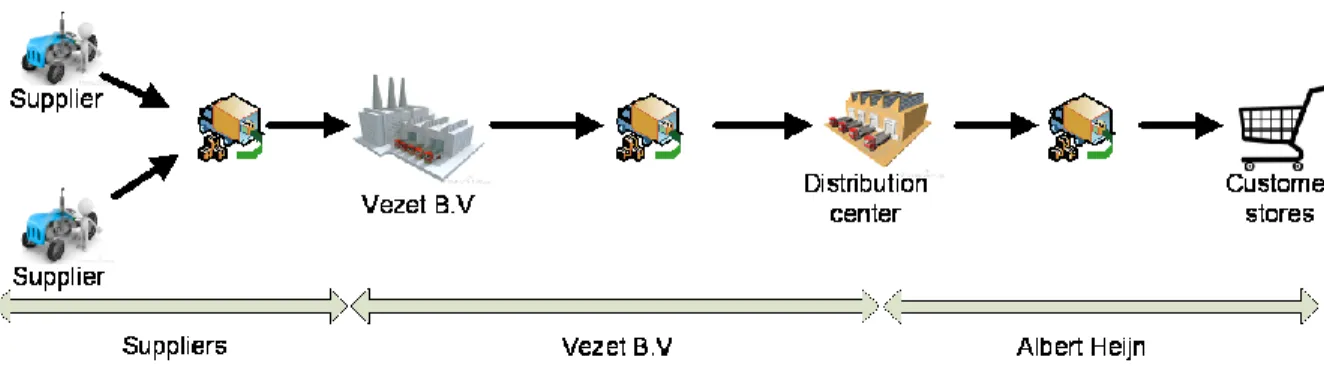
Vezet was founded in 1914 by three sauerkraut producing companies as ‘Verenigde Zuurkoolbedrijven’ (VZ). In 1973, Vezet started producing for Albert Heijn, the Dutch retail supermarket. Albert Heijn is owned by the Dutch supermarket operator Royal Ahold N.V. and has the largest number of supermarket stores in the Netherlands. At that moment, the diversity in products was low, but volumes were rising. This was extended by the introduction of ready-to-cook lettuce in 1989 and stir-fry vegetables in 1994. Due to the introduction of new products like large salads in 2005, fruit salads in 2008 and fresh pizzas in 2012, as well as increasing volumes, the plant in Warmenhuizen required expansion, the latest was realized in 2013. Vezet became a co-maker in Supply Chain of Albert Heijn, which means that Vezet is responsible for the processes until the distribution centers of Albert Heijn, whereas Albert Heijn provides full information about sales and forecasts. Together, they deliver freshly chopped vegetables to consumers at high service levels and minimum costs. In 2013, more than X million units were sold to Albert Heijn. At this moment, the sales to Albert Heijn represent about X % of the total revenue of Vezet. The other sales consist of products for X COOP distribution centers (DCs) in Denmark, and small fruit snacks for Lekkerland and DeliXL. All activities combined resulted in a turnover of X million euro in 2013.
Production process
Consumers demand freshly cut vegetables and fruits to be as fresh as possible and with the highest quality, which has clear implications for the supply chain of Vezet. In figure 1.1, we present a general impression of the supply chain of fresh-cut vegetables and fruits at Vezet. From this figure, we see that the decoupling point of Vezet is in the distribution centre of Albert Heijn. This is a consequence of the agreements that Vezet and Albert Heijn have made. For a detailed version of the supply chain map, we refer to appendix D. In the remainder of this section, we describe the internal processes at the production facility in Warmenhuizen. We use an indication number for each process step, which corresponds with the same number in the lay-out of the plant (see figure 1.2).
The raw materials are stored at a raw-materials warehouse (see 3), from which they can easily be retrieved when needed for production.
Figure 1-1: General impression of the supply chain for fresh-cut vegetables, including decoupling points.
When needed for production, the raw materials are taken from the raw materials inventory and transported to the preprocessing lines (see 4). At these lines, the products are washed, peeled and/or cut into smaller pieces. These products are temporarily stored in a warehouse in the factory (see 5). As soon as those semi-finished products are required for the next production step, they will be transported to the production lines.
Figure 1-2: Vezet lay-out (December 2014)
Finished goods inventory
At the production lines, the products are sorted, mixed, weighted and finally put into packages. The packages are put into plastic crates and placed on a load carrier, i.e., a pallet or rolly. The number of crates stacked on a load carrier may vary, due to demand, dimensions of the crates or end-of-production-run. The finished products are then transported to the finished goods warehouse, which is either at Dailycool (9) or at Expedition (10 and 11).
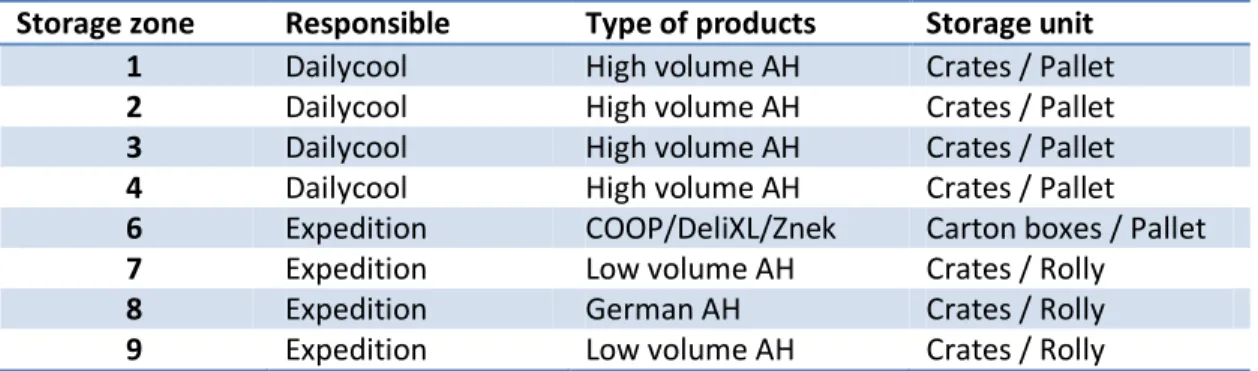
In order to group products, the finished goods warehouses are divided into storage zones that contain a number of stack places. Eight zones can be identified, each has its own characteristics (see table 1-1). The location numbers are used by the software system and currently do not have specific meaning (e.g., zone 5 is currently not used). Dailycool is responsible for the zones 1 - 4, which contain high volume Albert Heijn products, stacked on pallets. These products need to be transported to the Regional Distribution centers (RDCs) of Albert Heijn. At the Expedition warehouse, four storage zones can be identified. Zone 7 and 9 contain special, low volume Albert Heijn products destined for the National Fresh Center (LVC) of Albert Heijn, zone 6 contains products for the COOP distribution centers in Denmark, and the last zone (8) consists of products for Albert Heijn supermarkets in Germany. Anno December 2014, the following zones are used:
Storage zone Responsible Type of products Storage unit
1 Dailycool High volume AH Crates / Pallet
2 Dailycool High volume AH Crates / Pallet
3 Dailycool High volume AH Crates / Pallet
4 Dailycool High volume AH Crates / Pallet
6 Expedition COOP/DeliXL/Znek Carton boxes / Pallet
7 Expedition Low volume AH Crates / Rolly
8 Expedition German AH Crates / Rolly
9 Expedition Low volume AH Crates / Rolly
Table 1-1: Storage zone characteristics Dailycool
For the storage of high volume finished goods, Vezet uses the services of an in-house 3PL provider: Dailycool. This company is part of ‘Schot Groep’ and operates mainly for Vezet (X %), but also transports fresh products for other companies in order to spread costs and increase revenues. These extra transports only occur when Vezet does not need services of Dailycool. The work of Dailycool can be divided into four parts:
1) Storage and picking of the finished products in the in-house warehouse 2) Planning of the docks and trucks
3) Transportation of the finished products to the distribution centers of AH 4) Transportation of empty crates from the distribution centers to Vezet
When the finished goods storage of Dailycool (also called EA-warehouse) was built, it was designed as a possible production location, which means that this location is not really suitable for storage facilities. This can be seen by, for example: differences in heights of the location, number of pillars at inconvenient places and fire sprinklers that limit the stacking of pallets. Especially during rush hours, this results into a lack of stacking places. This is an undesirable situation, and can eventually lead to dangerous situations. In figure 1-3, we see a part of the storage location of Dailycool. The pallets are stacked on top of each other, and no racks are used, because it is assumed that this current way of working ensures easy retrieval and high productivity at low costs.
The detailed lay-out of Dailycool is pictured in figure 1-4. There are three locations from which ingoing products can origin, two of these locations are: Cooking Convenience and Pizza- & Fruit Convenience (see figure 1-2). The third location can be found at the docks/exit. It is, due to lay-out problems, not possible to transport the products of Meal Convenience internally, so these products are transported to the nearest dock at Meal Convenience, put into a truck and then transported to the warehouse of Dailycool.
A product, stored in the Dailycool warehouse, can always be found in the same zone, but within a zone, the products are stored randomly. There are certain restrictions for storing the products. A location can at most hold one kind of product, which means that ‘Soepgroenten’ can never be placed at the same location as ‘Nasi en Bami groenten’. Moreover, a location cannot hold one type of product with different production dates. This means that the ‘Maaltijdsalade Geitenkaas’ produced today cannot be placed at the same location as the ‘Maaltijdsalade Geitenkaas’ produced yesterday. However, these products can be placed nearby each other, as long as this will not lead to order pick errors. These restrictions are implemented to assure that products are picked FEFO (First-Expired First-out) and to prevent mistakes. As soon as a storage location becomes empty, it can be used by another product.
Figure 1-4: Dailycool lay-out (December 2014) Expedition
At the other finished goods operator, the Expedition department (see figure 1.5), we find a high variety of low volume products that are destined for the National Fresh Centre (LVC) of Albert Heijn in Nieuwegein. These products are stacked on rollies and therefore require a different storage method. It would have made more sense to store all products on the same storage unit (either pallet or rolly), but this is not possible because of crossdocking restrictions set by Albert Heijn. It is more convient to use rollies on small stores like AH-to-go shops, while large supermarkets can be supplied with pallets. In the storage facility of Expedition, also called EAA-warehouse, we see for example: AH-to-go products, meal salads and stews. Expedition has, in December 2014, two locations in the factory. The main location is the storage location of Albert Heijn products, in zone 7 and 9, which is pictured in Figure 1-6. The total available area at these locations is, including aisles, X square meters. Products can enter from two directions: Cooking Convenience or Meal & Fruit Convenience. These products are stacked on rollies and manually transported from its production location to their storage location.
Contrary to Dailycool, we see that dedicated storage is used at Expedition. This means that every product within Expedition has a fixed location. Expedition uses this way of storing, because it is less sensitive to errors and a high throughput can be accomplished (compared to random storage). A rolly is taken to its location within the zone and has to wait until the products are needed for
distribution. As soon as a product is required for distribution, it can be picked. The rolly can now be transported to one of the two temporary shipping locations (TSL A or B). Rollies can be placed at the Temporary Shipping Locations (TSLs) and wait until a truck is available at the docks. This is necessary, because there are no sufficient docks at this side of the factory, i.e., only two docks can be used. These docks are used for inbound flows (i.e., clean empty crates), transportation of products from meal convenience to Dailycool and the outbound flow of Expedition.
The TSLs can be seen as an extended storage location, because when a product is picked, it remains at the TSL until the truck is available. This will enable the order picker to handle multiple distribution orders and pick rollies before the actual distribution time, leading to low inventory levels in the zones 7 and 9. The cycle times at the TSL vary between 30 minutes to 6 hours.
Figure 1-6: Expedition lay-out (December 2014)
The above figure corresponds with point 11 in figure 1-2 and represents a part of the Expedition activities. In figure 1-6, we can identify two separate areas (on the left the TSLs and on the right zone 7 & 9). The one on the right is used for the storage of the products, while the location on the left is a temporary extension of the storage location. This is originally meant as an alley used for transportation through the plant. Currently, the lane is used for both storage and transportation, causing dangerous situations.
The lay-out of this EAA-warehouse reveals that this location was not intended to be used for storing finished products. We can see in- and outgoing processes crossing, causing inefficient situations. Expedition was sent to this side of the plant, because of the increasing need for storage locations, and the inability to create enough space at the other side of the plant.
Figure 1-7: Lay-out zone 6 & 8 (December 2014)
1.2.
Project motivation
Vezet has faced an increase in yearly production volume and revenues. The most important segment for Vezet, Cooking Convenience´ grew X %, while the whole market grew 63% in that same period. The two other segments have faced approximately the same growth rates. The company invested millions of Euros to increase production capacity, by buying new production lines and hiring extra personnel. Due to the focus on increasing and optimizing production lines, the logistic processes were undervalued for years. When looking at the warehouse activities at Vezet, we see examples of inefficient and sometimes dangerous situations. It may happen that products are temporarily lost, accidents occur or even wrong products are sent to the customer. We notice products stored at odd places in the factory, crossing in- and outbound flows and many reach truck movements. Both Dailycool and Expedition employees are currently complaining about the capacity of the storage locations and indicate that the problems have become more severe in the last years. We heard statements like: “It is hard to do our job in the right way”, “Our warehouse is too small”, “We require a new warehouse” and “Sooner or later, a major accident will happen”.
We see that the rush hours are the most problematic, because the inventory position is very high at these moments. In this case, new products cannot be added to the inventory, because there is no storage location available. Currently, we do not know the frequency, the impact and the main causes of these rush hours. Vezet needs to acknowledge the current warehouse problems and implement solutions that solve these problems.
Increasing the production volume, the product range and number of production lines leads to even more warehouse problems. In order to facilitate the future growth and developments, we need to know the warehouse requirements for the next 5 - 10 years. Vezet needs understanding about these requirements and needs suggestions about the directions the stakeholders (Vezet, Dailycool and Expedition) have to follow.
1.3.
Research objectives
Over X different types of products are produced every day and more than X consumer units are produced each week. In order to measure the performances, Vezet uses Key Performance Indicators (KPIs). The most important one is the ‘service level’, which means that at least X % of the demand of Albert Heijn stores must be satisfied by Vezet. The extent to which the service levels are met determines financial bonus/malus consequences. For every research conducted at Vezet this service level is set as a restriction, meaning that the research may not lead to a decrease of the service level. This research focuses on the requirements of outbound processes at Vezet. Especially during rush hours, we see problems at the storage locations, but are not able to acknowledge the size and nature of the problems. Management requires more information, an analysis of these problems and sustainable solutions, before any action can be taken. This research assignment has three objectives: 1) Identify the size and nature of the problems for the current and future outbound processes. 2) Find possible options to improve the current outbound processes.
3) Find possible options to meet the future requirements for the outbound processes.
To achieve the objective, a research question is formulated along with sub-questions, in order to structure and divide the research into workable parts. These questions are presented in the next section, followed by the research approach that clarifies how and when the research will be conducted.
1.4.
Research questions
From the previous sections the following research question can be deduced:
“What improvements does Vezet B.V. require at the outbound processes (in terms of storage capacity and investments) to meet the current and future requirements in a way that the service level remains ensured?”
The research question is divided into five smaller sub-questions. These sub-questions are explained in the following section and will be used to answer the research question in Chapter 7 ‘Conclusions’. Sub-question 1: ‘What patterns in the outbound processes can be distinguished in the current situation at Expedition and Dailycool?’
Sub-question 2: ‘What is the magnitude of the operational warehouse problems and how can support be created for these problems at management and production level?
Knowledge about the warehouse processes at Vezet is not enough to identify the size of the storage problems. We have to apply these processes to the real capacity restrictions, like location sizes and number of locations. We cannot analyze these requirements at warehouse level due to complexity, stochasticity and a large number of other variables. There are three possibilities to analyze this type of problems, for example: 1) real-life case studies 2) mathematical calculations and 3) simulation programs. We have chosen to use a simulation program for this research, because it is an understandable, accurate way of analysis. Because of the high variability in the processes, we will use real data points as input. This enables us to test whether the simulation model is accurate, but also creates support from the employees. The model should show problems that are recognized by the employees. Because of the high variation in the processes, it is necessary to have sufficient support from the employees.
An accurate simulation model allows us to identify the frequency and the size of the problems. But since the number of real data points is limited, we need to create a general model that does not use real data points, but distribution functions. This enables us to review longer periods and identify structural issues. The results from this second model are compared with the first results in order to make sure that this model is valid. Then, the model and its performances will be shown to the management of Vezet to create support and understanding of the discovered problems.
Sub-question 3: ‘Which factors can be distinguished to describe the future of warehousing processes at Expedition and Dailycool?’
Strategic warehouse problems cannot be solved within one year (e.g., designing a new warehouse is time-consuming). Therefore, a strategic warehouse plan for the next 5-10 years is needed. In order to make a strategic plan, it is necessary to identify the causes of growth and decline. These causes are described in scientific literature, which will be used as a baseline for making growth scenarios for Vezet. Unfortunately, strategic growth factors are not extensively described in the warehouse articles (Rouwenhorst et al., 2000). Hence, an extension is required to articles about strategic production, because growth scenarios in production will also affect storage facilities.
Within Vezet, the financial and commercial departments have already established expectations and scenarios for the next years. In order to understand these expectations, interviews need to be organized. The findings from these interviews are compared with literature, which results in a number of growth scenarios. The likelihood and realization of these scenarios will be discussed with the managers of the two departments.
Sub-question 4: ‘Which problems arise from the growth scenarios and what are the consequences of these problems?’
The growth scenarios established in the previous sub-question are implemented in the simulation model. The general simulation model made in sub-question 2 is used to deal with, for example increasing production volumes and product ranges. This will provide understanding of utilization rates and how often capacity issues occur in the future scenario’s. These problems are expressed in terms of requirements needed to solve these problems, like storage capacity needed for a single product and total capacity needed.
The problems found in sub-question 4 require solutions. These solutions are deduced from scientific literature, and combined with ideas from employees who encountered these problems. This leads to a number of solutions, which need to be analyzed for feasibility and desirability. Testing on feasibility is done by using the simulation model from the previous questions. In order to know the desirability of the solution, advantages and disadvantages must be identified and an implementation plan must be created. Solutions are selected by the most important KPIs of Vezet, investment costs and space requirements. Finally, these solutions are presented to the management of Vezet and Dailycool.
1.5.
Problem approach
Since 2010, Vezet has faced difficulties with logistic processes and adapted a lot of solutions to improve the logistic operations. These solutions were not sustainable, because as soon as production required additional space for the introduction of a new machine, this space was taken from the storage locations. So, the warehouse operators faced an increase in production volume, but were restricted to use less square meters. This research creates and investigates structural solutions for the logistic and warehouse processes.
To clarify the steps to be taken in this research, we present the research structure in figure 1-8. A challenge of this research is data collection, because data about physical inventory levels is not available. That is why the physical inventory levels are deduced from production and pick data. The complication is that this information is deleted after 3 months, because it is not relevant anymore for Vezet. So, there is only a limited amount of real data that can be used in the simulation model. To identify patterns and abnormalities within the production and pick data, we use scientific literature.
In chapter 2, a framework is created from literature to structure this research. This framework provides understanding of the most described decisions taken in warehouse planning and control at operational, tactical and strategic level. This can also be used to describe alternatives for problems found at these levels.
There are three requirements set to the simulation model that is created for answering sub-question 2. Firstly, the model must be a realistic visualization of the situation, i.e., the model will account for influences like seasonal trends and shelf life of the finished goods. Secondly, the model needs to be understandable for every person involved. This means that everyone must be able to see similarities between the model and reality, with minimum explanation of the model. And thirdly, the model needs to measure process flows in a correct way, which means that the results from the simulation must be accurate and useful for the storage location managers. The simulation model will be created in the program ‘Plant Simulation’. This is done because the program is able to fulfill the requirements set for the simulation.
The problem is complex, due to the large amount of data, involvement of two independently operating organizations and many stakeholders. Therefore, it is necessary to collect data and information in a clear and independent way. To get to know the organization, we start this research with two weeks at the factory (i.e., at the storage facilities of Expedition and Dailycool). This leads to an understanding of the warehousing processes for research perspective, and acceptation and understanding of the need for research amongst the employees.
Scope
facilities (e.g., raw materials and work-in-process), are handled in other parts of the factory and thus are not within the scope of this research.
As mentioned in section 1.1, Dailycool is an in-house 3PL-provider that has four functions. This research is limited to the warehouse function of Dailycool because this directly affects the production location in Warmenhuizen. Vezet has the responsibility to provide sufficient space to Dailycool to perform their operations, while Dailycool is responsible for the execution of the other functions.
To be able to make a strategic plan, a reasonable horizon must be chosen. A frequently used horizon for strategic decisions is 10 years (Baker & Canessa, 2009). This planning horizon is also used in this research, because some of the alternatives, presented in chapter 6, require multiple years of preparation before implementation (e.g., building a new warehouse).
The logistic costs that are made inside a warehouse are to a large extent already determined during the design phase (Rouwenhorst et al., 2000). Therefore, and due to time constrains of this research, only changes at strategic and tactical level are considered in the simulation model. We assume that the current ways of picking and stacking are continued in the forecasted horizon.
Deliverables
Vezet has focused on increasing productivity for years and has not been able to put sufficient effort in the organization of the logistical processes, which has led to inefficient processes and sometimes dangerous situations. For example, high handling times due to storage locations of Expedition at multiple locations in the factory and dangerous situations can occur due to crossing flows of in- and outbound products. Vezet has tried to come up with solutions and improvements for these logistical processes, but these were mostly temporary and not sustainable.
This research provides Vezet and Dailycool an understanding of the outbound processes, warehouse operations and their relation. Managers of Vezet will be able to look into specific events by using the analytical tools from this research, e.g., production and pick graphs and statistics from a certain period. This information will support managers when facing difficult decisions like the warehouse design.
Secondly, from the analysis of the current production, storage and order picking process, we derive the inventory position at the storage locations. Combined with the operational simulation model, we derive the storage requirements for the current situation. These requirements are used to formulate improvements for the current warehouse processes.
Research structure
Figure 1-8: Research structure
Problem description (CH 1)
Literature review (CH2, SQ 1)
Description of current situation
(Ch 3, SQ 1)
Analysis of current situation (Ch 4, SQ 2)
Research on growth factors
(Ch 5, SQ 3)
Research on alternatives (CH 7, SQ 5) Analysis of future
requirement (Ch 6, SQ 4)
Conclusions and recommandations
(Ch 8)
Warehouse issues at Vezet and Dailycool
Performance of warehouses Operational simulation model Scientific literature Interviews and data collection
Create strategic growth scenarios for the next 10 years
Strategic simulation model Interviews and literature Describe alternatives Implement alternatives in
simulation
Evaluate alternatives for future situation
Improvements for current situation Identify main problems
Choose alternative
2.
Warehouse characteristics
The problems described in chapter 1, have a qualitative rather than a quantitative nature which makes it hard for the management deal with these problems. So in order to understand these possible problems, we need obtain information about how to analyze warehouse performances. This will be done by giving an analysis of scientific literature. The analysis is used to deduce KPIs that enable us to identify the performances of the Vezet warehouses.
In section 2.1, a general framework is introduced that is used to structure the research. The precise application of this framework in this research is explained in section 2.2. In the sections 2.3 – 2.5, we fill the framework with applications generated by a wide range of warehouse literature. We summarize the findings from this chapter, in section 2.6.
2.1.
A generic framework for warehouse planning and control
A useful tool for structuring operations is a framework, focused on production and management decisions. The classical Manufacturing Planning and Control Frameworks have a specific orientation toward production, technological or material planning, but are inadequate in practice (Hans et al., 2012). Therefore the framework of Zijm (2000) is used, which is designed for integrated Manufacturing Planning and Control (MPC) in highly complex organizations. For a state-of-the-art overview in the literature of MPC, we refer to the paper of Hans (2012). The entire Manufacturing Planning and Control framework would be too broad and complex for this research, that is why this framework is applied to a specific area within the Manufacturing Planning and Control; warehouse operations.
Within the processes of managing operations, three decision stages can be distinguished: strategic, tactical and operational (Rouwenhorst et al., 2000). For instance, the choice of using different types of storage systems can be seen as strategic. A strategic decision is made for a number of years (more than 2 years) and cannot easily be changed, while a tactical decision is made for 1- 2 years. For example, a tactical decision is the number of the pick zones. Finally, the short-term decisions, on operational level, must be made, like the assignment of the docks. As explained in Rouwenhorst (2000), decisions taken at operational level affect the organization at a different level than decisions at strategic level.
Managerial areas
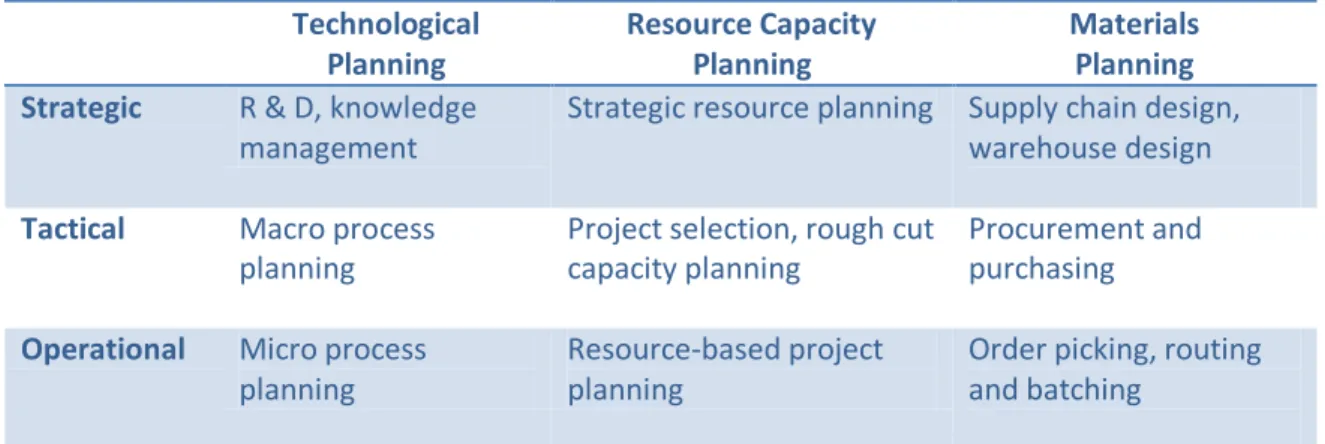
As shown in table 2-1, three managerial areas can be distinguished: Technological, Resource Capacity and Materials (for details about the choice for these areas, we refer to Zijm (2000), Hans et al. (2003), and Hans et al. (2012)).
The technological planning can be performed in different ways, but it is most often performed by the management and supply planners. Technological planning involves decisions making regarding protocols and reporting. These planning tools enable the stakeholders to review the current processes and define desirable processes.
The resource capacity and materials planning both analyze the resources used in the processes, but there is a difference between these. Resource capacity planning addresses the dimensions, planning, monitoring and control of renewable resources (i.e., resources that can be used multiple times like personnel, barcode scanners, reach trucks, docks, stacking places).
Hierarchical Levels
At each of the four hierarchical levels different decisions are made, which are mostly influenced by the available time. Rouwenhorst et al. (2000) describe the strategic level as long term decisions made at a horizon of approximately five years. They pose questions on a number of processes, like do we need a separate reserve area or what type of storage system needs to be used? These strategic questions are related to a level in which it is not easy to change a decision after some time, because high investments are involved. Secondly, on tactical level decisions are made for the next two years. These decisions are, of course, bound by decisions made in the strategic level. It involves defining the number of pick zones or the selection of picking equipment. The remaining categories are the offline and online operational levels, both involve short term decisions related to the execution of the warehouse processes. The difference between these two types of decision making, is that within offline decision making, the decisions are made in advance while online decisions are made reactive, on unforeseen events.
Technological Planning Resource Capacity Planning Materials Planning Strategic R & D, knowledge
management
Strategic resource planning Supply chain design, warehouse design
Tactical Macro process
planning
Project selection, rough cut capacity planning
Procurement and purchasing
Operational Micro process planning
Resource-based project planning
Order picking, routing and batching
Table 2-1: Framework for Manufacturing Planning and Control (Zijm (2000), and Hans (2012))
2.2.
Application of the framework
Since more and more companies are looking for more profit, cutting costs and improving efficiency within their organizations, logistic operations have gained extra attention. In order to measure the performances of the logistic operations, a performance evaluation model can be used. Gu et al. (2010) argue that a good performance evaluation model can help the designer to quickly evaluate many (design) alternatives and narrow down the design space during the early design stage. A performance evaluation model includes analytical models, simulation models and benchmarking. But before a performance model can be used, we need to identify the factors that we want to evaluate.
2.3.
Technological planning
The first managerial level Zijm (2000) defines is technological planning. This is described as the planning and execution of processes. Firms hold inventories because production and procurement processes cannot instantaneously match product demand. When a company faces a stock-out, two adverse consequences can be considered: immediate forgone profit and long-run loss of revenue arising from the shift of customers to more reliable sources of supply (Blazenko & Vandezande, 2003). Within a warehouse, there are four warehouse processes that can be reviewed: receiving, storing, order picking and shipping activities (Rouwenhorst, 2000). Each process has its own characteristics and developments.
Strategic
When looking at the strategic decisions to be made for the warehouse processes, we see a lot of new developments, automation and research topics. It is hard for a warehouse manager to cover all new warehouse trends, because of the amount of information. That is why design of warehouse’s processes is very important (Cakmak, et al., 2012). By knowing the desired position of the warehouse managers, directions can be formulated. This can result in trade-offs like internal or external warehouse operations, building a new warehouse or implementing new features.
Tactical
At the tactical phase, we assume that there is a warehouse available, but the organization of the processes is not designed. At each process, decisions need to be made about the execution of the warehouse operations. An decision is for example, the start and finish time of the operations, which includes the time window for order picking, and the opening hours of the receiving area. Also the flow through the warehouses must be elaborated, i.e., where is the receiving area positioned, and which stacking methods are most suitable for the operations (Park & Kim, 2010).
Operational
An example of checking the performances of the processes within a warehouse is safety (de Koster et al. 2011). Safety has gained a lot of attention in the recent years and is seen as additional factor in existing methods. Look for example at Toyota which uses the 5-S model for continues improvement and lean manufacturing. That same model has evolved into the 5S +1S model, in which the addition of 1S, represents Safety. An operational factor like safety can easily be translated into KPIs that measure the performances of the organization on a specific part. There are a lot of possible KPIs that can be formulated to measure Safety. De Koster et al. (2011) give directions for measuring Safety by providing two Key Performance Indicators (KPIs): the number of accidents during a certain period and the second the severity of accidents related to financial consequences.
2.4.
Resource capacity planning
Strategic
To run operations and processes in a warehouse, we need to know the characteristics of the warehouse. Therefore, we need to define the warehouse design. Lots of articles have been written about warehouses designs. Gu et al. (2010) structure the warehouse design into five major decisions:
1) Determining the overall warehouse structure
2) Sizing and dimensioning the warehouse and its departments 3) Determining the detailed lay-out within each department 4) Selecting warehouse equipment
5) Selecting operational strategies.
The costs of warehouse operations are largely determined during the design phase (Rouwenhorst et al., 2000). Therefore, full information is needed about the expected inventory levels, operation methods and level of automation (like automated storage and retrieval systems). Every decision taken, influences and restricts the next decision, so decisions need to be taken well-founded and with care.
Tactical
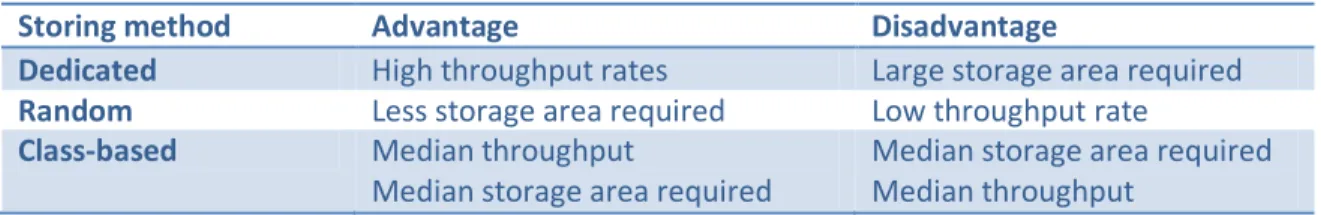
After making the definitive design of the warehouse and its departments, it is necessary to dimension the warehouse equipment. This involves for example the number of employees (e.g., order pickers), the number of the storage locations and their capacity. Also, we need to make decisions about the storing methods, order pick strategies and ways of batching. At Vezet, we see two different types of storing methods. Each strategy has its own advantages and disadvantages, as can be seen in table 2-2 (Chan and Chan, 2011).
A dedicated order picking method results in high throughput rates, because the SKUs are always positioned at the same place, it can easily be found by the employee. The disadvantage is that when a product is not present in the warehouse, it still has a location (that cannot be used by another product). Therefore, the required storage area is large.
A more efficient way of making use of storage areas is random storage. This means that a location can be used by every type of product and as soon as the product is not in stock anymore, the location can be used by another product. The consequence of this process is that an order picker is not sure where the product is located, and has to search for it. This will take time and leads to lower throughput rates.
The combination of the two pick strategies is class-based storage. A product is divided into a strategically chosen class along with other products. This class (or these products actually) has its own fixed location in the warehouse. Within the class, random storage is used. So for example, we know that a product is always positioned at zone 3, but we do not know the exact location of the product. This ensures that the throughput is higher than at random storage, but lower than dedicated storage. The same applies to the storage area required.
Storing method Advantage Disadvantage
Dedicated High throughput rates Large storage area required
Random Less storage area required Low throughput rate
Class-based Median throughput
Median storage area required
Median storage area required Median throughput
Operational
The choices made in the tactical decision stage have consequence for the operational performances. One of the most important factors in the performance of a warehouse is the service level or product availability, because it is for many companies important to avoid losing their customers, profits and market share (Blazenko & Vandezande, 2003). Warehouses need to be a reliable partner, against reasonable costs. That is why the service level is important to know. One way to measure the service level is measuring the number of missing or erroneous deliveries to a customer. It is also important to know what the impact of these deliveries is, because the (financial) consequences for missing an order can differ per customer.
To measure the performances of the resources deployed, we measure the utilization rate (Cormier, 1992). There are lots of different ways to measure the utilization rates. The choice of the right way to measure the utilization rate is dependent on the resource, company preferences and historical measurements. Gu (2010) makes a suggestion that can be used to measure the utilization of a storage location. The first measure is to divide the number of products placed at a storage location by the total amount of products that the storage location can hold. The second measure is storage utilization which measures the number of locations (partly or fully) occupied.
2.5.
Materials planning
Material planning involves resources that can only be used once. At Vezet, we see the products received and picked as this type of resource. We are allowed to make this assumption because once the products have left the warehouse they do no return to the warehouse. In this section, we describe the consequences of handling these materials at the three hierarchal levels.
Strategic
At strategic level, we need to analyze the market requirements for the materials (Dotoli et al., 2015). This means that a warehouse manager has to ask himself what can the warehouse offer to the market and what the market offers the warehouse. Therefore, we need to keep track of developing markets, expected growth or decline, new possibilities. The market trends need to be translated in product volumes, so the warehouse manager can calculate the required storage area, investment costs and possibilities for expansion.
Tactical
To prepare the warehouse for the operational processes, we need to define the tactical material planning, which means that we have to formulate our expectations for the near future. Are we seeing new developments like new product introductions, or products leaving the inventory or an increase in demand/production (Guerriero, 2013). By identifying the future needs of the warehouse, the manager becomes able to make early adaptations.
Operational
2.6.
Conclusions
In this chapter, we saw the Manufacturing Planning and Control framework of Zijm (2000) translated into a Warehouse Planning and Control framework (see Table 2.3). The framework explains how and why decisions influence each other. This is important in order to understand the current situation of a warehouse, but also to shape its future requirements.
We will use this framework as a roadmap for this research. In order to measure the performances of the warehouse processes, we need to look into the operational level and check whether or not possibilities for improvements are seen. The importance of each operational factor depends on the company, which can be seen by the huge amount of Key Performance Indicators formulated. There is no single way to check the performance of a warehouse (Gu et al., 2010).
3.
Data analysis
Since Vezet has no detailed information about the inventory flows, we measure and visualize the inventory patterns in the warehouses, in section 3.1. This enables us to recognize recurring patterns and deviations with the inventory flows. In section 3.2, the capacity of the warehouses is added to our analysis. This is used, in section 3.3, to identify performances and challenges within the warehouses on the four indicators found in chapter 2, safety, utilization, service level and productivity. In section 3.4, the findings are summarized in a problem cluster which provides an overview of the most important problems within the warehouse processes at Vezet.
3.1.
Inventory pattern
In this section, the physical inventory pattern at Dailycool and Expedition are analyzed. Anno October 2014, Vezet had no information and insight in the process flows at the warehouses. Therefore, we create a method that can be used to visualize the inventory position. This method is explained in section 3.1.1., and can be, if needed, used in future research or to replicate this research. In section 3.1.2., we present and discuss the physical inventory flow at Dailycool. The same analysis is made for Expedition, which is presented in section 3.1.3.
3.1.1. Method
For our analysis of the inventory flows at Vezet, we used a number of data sources. In this section we explain the data source we used. All data is provided by the system ‘X’, a program which enables the user to collect a wide range of data from the ERP-system. There are different data structures available and a selection of the most suitable data had to be made. The data used in this research is reported in: SMOVRAP2, PICKSTAT and TELLST. These names seem rather odd, but they are just derived from software languages. In the next paragraph, these systems are described shortly, as well as the steps taken to come to the graphs of the inventory flows.
The data collected from SMOVRAP2 provides understanding of the moment at which a product has reached the end of the production line and is moved to the warehouse. At this point, the number and type of crates produced is counted, and the barcode of the product is scanned. This data is imported into the computer system and standard information about the products is added (e.g., storage zone). Not every data point in SMOVRAP2 is relevant for this research, so the tags, ‘Imvnulcorr’ and ‘Voorrep’, had to be removed. The PICKSTAT command can be used to collect information about the picking process. Each order picker has a barcode scanner, which is used to pick the product. When a product is picked, the number of items, the time and information about the shipping process is stored in the system. These two information systems can be used to calculate the number of products in inventory. In order to calculate the marginal difference in inventory at a certain point in time, the number of products from PICKSTAT, should be subtracted from the number of products from SMOVRAP2. Combining these marginal differences with the physical inventory at the beginning of the measurement, results in the number of products held in inventory at a certain moment in time. We use this method to check the inventory position every half hour, in order to create smooth graphs. We took the starting inventory position at the beginning of each week from TELLST. This also gives the opportunity to check the real inventory position with the calculated inventory position from the information systems.
details must be identified. To prevent the system from an information overflow, most detailed data is deleted after three month. Consequently, it is not possible to review the inventory levels for prior periods. Other data are stored for a couple of years (e.g., general data about production volumes and accident reports).
Another challenge is that a product can be switched to another picking zone when situations change (e.g., introduction of new products). This leads to changes in the system which corrupts the data for this research. Therefore manual changes in storage zone were required.
The third challenge involves externally produced items, like sauerkraut, which are transported to Vezet and placed in the EA-warehouse. These items can be seen in the PICKSTAT data, but are not produced at Vezet, so these are not visible in the SMOVRAP2 system and impossible to analyze. We use graphs to visualize patterns within the data points. This requires a choice of unit, because graphs can be expressed in individual items (CE), storage units (crates) or storage units (pallets or rollies). In this research we express all data in crates, because data from the system is also expressed in crates, and commonly used within the plant, which is convenient for data validation. Besides, the number of crates stacked on a pallet or rolly may vary, because these are not required to be fully stacked. However, we need to account for the pallets and rollies which are used within the warehouses of Vezet. These storage units determine the space issue, because for storing one crate, we require one storage unit (e.g., pallet). For now, we neglect this complication.
We have chosen to set certain intervals for these graphs, in order to reduce the number of data points. For all graphs we chose an interval of 30 minutes is. This is, because choosing a smaller interval will lead to too many data points and unstable patterns. Choosing a larger interval blurs the details of the graph, because it will be unclear when events, like machine cleaning or break-downs, happen.
3.1.2. Physical inventory level at Dailycool
The physical inventory level at the EA-warehouse, the warehouse of Dailycool, depends on the crates that are received from production. These are the crates that need to be stored in the warehouse. When looking at the production data from the period November 2014 – April 2015, we see the following data in table 3-1.
Production day Average volume (crates) Minimum volume (crates) Maximum volume (crates)
Monday x x x
Tuesday x x x
Wednesday x x x
Thursday x x x
Friday x x x
Saturday x x x
Sunday x x x
Table 3-1: Crates received from production for the EA-warehouse during November 2014 – April 2015
Figure 3-1 shows the inventory position of the EA-warehouse during the day. We see the same pattern on each day, expect for Saturday. From 7:00 till 9:00 hours, crates are produced, but no crates are picked, so the number of crates in inventory rises. At 9:00 hours, many crates are picked and transported to the docks of Dailycool, which leads to a massive drop in the inventory. The same can be noticed (in smaller proportions) at lunch break. Then, the physical inventory stabilizes and increases until 20:00 hours, after which the employees start picking again.
Figure 3-1: Physical inventory level at Expedition in week 47, 2014 (from Monday 17-11 till Sunday 23-11)
We, again, see a different pattern on Saturday. This highest point in graph is on the line of 19 November and is caused by a number of reasons. Firstly, the inventory position at the beginning of the day was already high (around X crates). Secondly, the number of crates picked was not big enough to compensate the high inventory level and thirdly, the production volumes remain constant, causing the inventory to grow.
One may notice that the inventory position in this week is fluctuating between X and X crates during a short period. This makes it even harder to identify problems, we see that on average X crates are in inventory, but we have a maximum at X crates. At this moment, we are not able to identify whether the warehouse has problems or not, because it is possible that the capacity problem already exists at this point. Therefore we cannot simply look at the average values, but have to keep the outliers in mind and need to know the utilization of the storage locations.
A second thing that can be noticed is that the daily production volume is not fully stored at the EA-warehouse. On average X crates are on stock, while more than X crates are made. So we can assume that the average time a product spends in inventory is half a day.
3.1.3. Physical inventory level at Expedition
Production
day Volume (crates)
Minimum volume (crates)
Maximum volume (crates)
Monday x x x
Tuesday x x x
Wednesday x x x
Thursday x x x
Friday x x x
Saturday x x x
Sunday x x x
Table 3-2: Crates received from production for the EAA-warehouse
In figure 3-2, we calculated the physical inventory position for week 47 in 2014 at the Expedition department (zone 6, 7 and 9). Two lines (Friday 21 and Saturday 22 November) are very high compared to the other lines. This is caused by not performing order picking operations on Friday for the COOP supermarkets in Denmark. COOP does not want to be supplied on Saturday evening, because the stores are closed on Sunday. However, due production capacity restrictions, a part of the COOP order is already produced on Friday. So, there is an inflow of products in the warehouse, while there is no outflow (pick actions), causing inventory levels in the warehouse to increase. A regular pick day at Expedition starts at 7:00 hours and ends at 1:00 hours, which can also be seen in the graphs. When neglecting the lines on Friday and Saturday, we see the same pattern every day. On a regular day, the number of crates held in inventory drops, and rises again. Most often, the highest inventory level can be found between 17:00 and 19:00 hours, because of breaks of the employees and distribution orders that require more time to pick (e.g., multiple product types on one pallet). Furthermore, the lowest inventory level can be seen between 8:00 and 10:00 hours, because within this interval, order pickers are picking as many products as possible in order to lower the inventory level. This results in a low physical inventory level at the storage zones and high inventory levels at the temporary shipping locations (see figure 1-6). These temporary shipping locations are only cleared when a truck is available, which causes these products to stay at this location for a couple of hours, which leads to numerous dangerous situations.
Figure 3-2: Physical inventory at Expedition in week 47, 2014 (from Monday 17-11 till Sunday 23-11)
check whether there is still space at the storage location to store crates. So, the next step is to determine the capacity.
3.2.
Warehouse capacity
To calculate the performances and to identify problems at the warehouses, we need to know the utilization rates. This requires identifying the number of crates present in the warehouse and the capacity of the warehouse. However, the maximum theoretical capacity in the warehouse differs because of the different types of crates used. An alternative is to express the capacity in number of pallets, but also this number fluctuates. Both fluctuations are caused by the stack heights of the crates on a pallet. At Vezet, four different types of crates are used: CBL 7 cm, CBL 8 cm, CBL, 11 cm and CBL 17 cm. For example, we can put five pallets with CBL 7 cm on a location, while only three pallets with CBL 17 cm can be put on that location. So, it makes more sense to use the number of crates as gauge. There are four different types of crates within the warehouses, and two types of load carriers, resulting in eight stack heights (see table 4-1). The warehouse operators do not have influence on the choice for a crates size or load carrier. These decisions are set default as end item characteristics by Albert Heijn, in agreement with the commercial department of Vezet.
# crates stacked on a pallet
# crates stacked on a rolly
CBL 7 cm 60 44
CBL 8 cm 120 88
CBL 11 cm 75 30
CBL 17 cm 50 20
Table 3-3: Number of crates per full load carrier 3.2.1. Dailycool
To calculate the theoretical capacity of the Dailycool warehouse, we distinguish six types of locations. Each type has its own dimensions which determines the number of crates that can be stacked on that location type. Every location has a fixed width of 1.2 meters that matches the width of one pallet. When taking the average number of crates per type multiplied with the number of locations, the maximum theoretical capacity of the warehouse can be calculated. To this end, we need to know the distribution of crate types. Currently, we do not know this distribution, because it changes every moment. Therefore, we estimate the maximum theoretical capacity by the number of CBL 11 cm crates (common used crate type). This equals approximately X crates.
Location type Depth (meters) Height (meters)
Number of locations
# crates CBL 7
# crates CBL 8
# crates CBL 11
# crates CBL 17
Type 1 x x x x x x x
Type 2 x x x x x x x
Type 3 x x x x x x x
Type 4 x x x x x x x
Type 5 x x x x x x x
Type 6 x x x x x x x
Table 3-4: characteristics of the storage locations at Dailycool
3.2.2. Expedition
Each location at Expedition has a fixed width of 0.7 meters, which corresponds with the width of a rolly, and a variable depth. The depth is dependent on the position of the location. Rollies cannot be stacked on top of each other, so the number of rollies on a location is calculated by the depth divided by the length of a rolly (0.8 meter). Expedition uses dedicated storage, which means that each product has its own location. We know for every product: the position of the storage location, the maximum number of rollies for that location and the number of crates stacked on a rolly. So, it is easier to calculate the capacity of this department. As stated in section 3.1, we estimate the capacity of Expedition on X crates. This holds for the situation of December 2014.
Location type Depth (meters) Height (meters) Number of rollies Number of locations
Type 1 x x x x
Type 2 x x x x
Type 3 x x x x
Type 4 x x x x
Type 5 x x x x
Table 3-5: characteristics of the storage locations at Expedition
Besides zone 7 & 9, Expedition has three Temporary Shipping Locations (TSLs) that contain picked products that are ready to be transported to the truck. The operations performed at the TSLs cannot be analyzed, because there is no information available. We can deduce the moment that a product is transported to the TSL, but we have no information about when these products from the TSL are loaded into the truck. These locations are also storage locations and need to be taken into account in our research. So, we measured the number of rollies present at several moments in time and calculated an average. It turned out that on average X TSL was occupied, which equals X rollies. On an average rolly, 23 crates are stacked, so the number of crates stacked on average on the TSLs is X.
3.3.
Measuring warehouse overall performances
To measure the performances of the warehouses, we need to retrieve information about their processes. Because of the in-house location of both warehouses, it is not easy to assign a clear cause and effect. Lots of activities take place close to the production line, so communication is easy and errors are rapidly detected. Both, Dailycool and Expedition have a kind of control function. They perform the final check on quality and quantity of the products. In this section, we will look into the factors that were found in chapter 2 and check how the two warehouse operators perform.
3.3.2. Service Level
3.3.3. Utilization
3.3.4. Productivity
3.4.
Summary
we also need to keep in mind the volume utilization. Also, ‘productivity’ need to be kept in mind, but we do not see urgent problems at this point. For ‘safety’ and ‘service level’ we have no indication for problems, so we will not focus on these topics. In chapter 4, we will analyze performance at the utilization in more detail.