i
A CONSTRUCTIVE TOOL TO PREDICT TIMETABLE
FEASIBILITY UNDER USER DEFINED CONSTRAINTS.
MASTER THESIS INDUSTRIAL ENGINEERING & MANAGEMENT
12-02-2016 Author: Stef van den Bedem BSc
s0192880 Supervisors: dr. P.C. Schuur
ir. H. Kroon
R.W. Puyt MSc MMC R.A. Kouthoofd MSc
ii
SUMMARY
This thesis forms the completion of the master Industrial Engineering & Management at the University of Twente with a specialisation in Production & Logistic Management. The thesis describes the development of a tool to predict the feasibility of timetables under varying constraints. This tool is created for the management of the Business Economics programme at the Amsterdam University of Applied Sciences (AUAS).
APPLICATION
The tool can be used to predict whether or not feasible timetables can be used under pre-specified constraints. These constraints consist of limited resources like lecture rooms and teaching staff and scheduling rules like “lecturers may not work more than ten hours per day”.
By scheduling a set of events (lectures, tutorials, etc.) repeatedly in a decreasing number of rooms, we can identify the point at which the pool of rooms becomes too small to include all events in a timetable. With this information we can predict whether or not a feasible timetable can be found under the given constraints or how much space is needed to ensure that a feasible timetable can be created.
Questions that can be addressed include:
- Would introducing new policies create timetabling difficulties, given the current resources?
- Which scheduling constraints can be used simultaneously and which combinations have negative influence on timetable feasibility?
- What are the minimum resource levels given the current set of events and policies?
- What the impact of policies on timetabling?
MOTIVATION
The AUAS is a budget driven organisation with as one of its goals preparing students for a professional career in a wide range of fields. I.e. it tries to offer the best education possible within a set budget.
The AUAS is split in various faculties that each coordinate the research and education in their own field. The faculties have organised the education in a number of programmes. Each faculty has also an operational branch. The programme management decides what to teach, when to teach, how to teach and by whom courses are taught. The space used for teaching on the other hand is managed by the operations bureau. Which leaves the timetabling department with the task to fit all the events given by the educational branch in the set of rooms supplied by the operational branch.
iii However, a lot of related questions are difficult to answer, like: What is the absolute minimum space required for feasible and acceptable timetables? Or: Would forcing staff members to be available for teaching during all lecture hours make timetabling really easier? Answering such questions by trial and error would ask a lot of the timetabling department and consensus among all involved parties on the answers is hard to reach. To make informed choices that are widely supported, they must be supported with some kind of data. Which is the reason to develop a tool to assess the impact of policies on timetables and space usage.
MODEL BEHIND THE TOOL
Our tool is based on a model of Beyrouthy et al. (2006). They found that school buildings’ utilisation can be used to predict whether or not a feasible timetable can be found for a given set of events in a given set of rooms. Utilisation of lecture rooms is defined as the fraction of seat-hours that is used, where seat-hours are a multiplication of a number of seats and time. The number of seat-hours needed for an event is the number of attendees multiplied with the duration of the event. The total number of seat-hours is the combined number of seats in all rooms multiplied with the time that they are available for scheduling.
= ˗ℎ ˗ℎ
Our tool schedules a set of events under different utilisations to find the utilisation above which no feasible timetable is found. The utilisation changes if either the set of events is altered or the number of rooms is changed. We use the same set of events and try to schedule it multiple times, each time in a smaller set of rooms. Scheduling is automated, in a way that the timetable complies with predefined constraints and events are excluded if they do not fit in the timetable without violating constraints. This can cause a difference between the set of events we are requested to schedule and the set of events that made it into the timetable.
We distinguish two types of utilisation: Requested utilisation, which is calculated with the seat-hours of all events in the set and achieved utilisation, which only uses the seat-hours needed for events that are included in the timetable. The denominator in the fractions below is in both cases the same but changes with the set of rooms.
= ˗ℎ ˗ℎ
ℎ = ˗ℎ ℎ˗ℎ
iv
At a certain requested utilisation, the constraints or total room capacity make it impossible to schedule all events. Above that utilisation it is almost always impossible to get a feasible timetable whereas it is almost always possible to do so with a lower requested utilisation. That point is called the critical utilisation and can be identified in a graph. Figure 1 shows an impression of an output graph of the tool. Each dot represents the achieved utilisation after solving the timetabling problem with a particular set of rooms. The critical utilisation is the point at which the graph starts to bend away from the diagonal. In an ideal and fictive situation, all events can be scheduled until the total room capacity is used. The red series in the graph shows results of a test experiment with data from the AUAS. In this realistic scenario, the critical utilisation is much lower and harder to pinpoint. We find in this case that UC ≈ 55%.
WORKING OF THE TOOL
The most important part of the tool is automated timetabling. We looked at timetabling competitions for heuristics that perform well. A Simulated Annealing heuristic by Bai, Blazewicz, Burke, Kendall, and McCollum (2012) finished high on the rankings of multiple competitions. Simulated Annealing is a type of heuristic that is used to find near optimum solutions to discrete optimisation problems. These problems have a large but finite number of solutions, each with its own solution value. The heuristic improves the solution in an iterative process by trying small changes. It either continues from the candidate solution or the current solution depending on a probability that depends on how much worse or better the candidate solution is. The best solution found so far improves over a long number of iterations.
We use a penalty score to determine how good a solution is. A small penalty is put on not using seats in a room during lecture hours while larger penalties are put on constraint violations. Allocating events to a room and timeslot reduces the total penalty score but introducing new constraint violations increases the score much more. Over time as many events as possible will be scheduled by the heuristic while events that cause constraint violations are removed from the timetable. Varying penalty scores per constraint will enable the user to prioritise certain constraints over others. The heuristic will schedule as
FIGURE 1 UTILISATION PLOT WITH INDICATIONS OF CRITICAL UTILISATIONS
0% 20% 40% 60% 80% 100%
0% 20% 40% 60% 80% 100% 120% 140%
Ac
hi
ev
ed
u
til
isa
tio
n
Requested utilisation
Ideal outcome
Realistic outcome
v much events as possible while removing events that cause constraint violations from the timetable. Varying penalty scores per constraint will enable the user to prioritise certain constraints over others.
Simulated Annealing needs a starting solution. To create this we gather the information that describes the timetabling problem: What events to schedule, who teaches events, what classes attend them, etc. It is easy to use historic data but it is also possible to create a problem instance from scratch or replace part of the data. Figure 2 shows what input data is needed and for what purpose it is used.
We mentioned that we keep the set of events the same but that we change the set of rooms multiple times. These are created beforehand. As this project is aimed at a specific building of the AUAS, the Fraijlemaborg, the mix of room types and sizes is kept as close as possible to the existing situation. With the set of events, we can calculate how many rooms each set must contain to get an even spread of requested utilisations among the sets of rooms. This spread ensures a clear graph at the end of the process.
Each set of rooms and set of events combination needs its own initial solution. We created them with a simple constructive heuristic: add random events to the timetable in a suitable room during the first timeslot that the room is unused and the classes or lecturers that attend an event have no other events scheduled already. These initial solutions are reused for experiments with different constraints.
After creating the sets of rooms and initial solutions, the user chooses what scenarios are to be compared. By setting the right penalty score per violation for each scenario, the resulting timetables will comply with the right constraints. The output enables the user to compare the achieved and critical utilisations of the scenarios.
INPUT
We tested the tool with data from the academic year 2014-2015. This gave us the opportunity to work with a realistic set of events. The required data is pieced together from multiple sources. The timetable and staff availabilities are exported from their respective software applications and pasted into the model while lecture hours and room characteristics must be looked up and entered by hand.
A variety of constraints has been identified. Most ensure that events are scheduled at suitable locations and staff and students are available to attend. In addition, some scheduling rules have been included that dictate when events can be scheduled. E.g. classes have a minimum number of events per day, or all events are scheduled between certain hours. These rules are based on preferences expressed by students and staff during exploratory interviews.
vi
vii
OUTPUT
CUSTOMER
PROCESS
Solve scheduling problems with
Simulated Annealing Create initial
solutions
Plot of achieved utilisations or
frequencies
viii
RESULTS
The goal of this project was to develop a tool to assess the impact of policies (timetabling rules) on timetables and space usage. We have created and tested a tool to do so. However, the exact critical utilisation is difficult to determine, as may be noticed in Figure 2. It is important to compare the ability of timetablers through historic timetables with the output of the model, using the same constraints. This will help to match the visually determined critical utilisation to the point that the scheduling department cannot produce feasible timetables anymore.
During the test scenarios that we have run, we found one particular interesting policy that could be implemented: the introduction of morning and afternoon classes. Classes are split in two groups and all events are scheduled in the predetermined day part. This has no negative impact on the critical utilisation while it limits the length of the workday for students, gives students security on when they are expected to attend, far in advance, and provides acceptance for using the first and last few lecture hours on every day.
FURTHER RESEARCH
The outcomes of the tool can be improved by improving the initial solutions to the timetabling process, tailoring them to the constraints that will be applied. Extending the computation time could also result in more accurate results.
An experiment that requires significant preparation but can be done with this model is comparing different curriculum set ups. Balancing resource demand over the academic year across all programmes housed in the Fraijlemaborg could reduce the peak demand for space and staff. Testing multiple curricula requires a new set of events, with staff and class matches and staff availabilities etc. for each instance. This could be an interesting direction to explore.
ix
CONTENT
x
xi 6.3 Improper use ... 6-79 6.4 Accuracy of the model ... 6-80 6.5 Summary... 6-80 7 Conclusion ... 7-81 8 Recommendations and further research ... 8-84 8.1 Variable class size ... 8-84 8.2 Spreading resource demand ... 8-84 8.3 Individualisation... 8-84 8.4 Constructive heuristic ... 8-85 9 Bibliography ... 9-86
Appendix 1 Glossary ... 90
Appendix 2 Organogram AUAS ... 93
Appendix 3 Overview of interviews ... 95
Appendix 4 Overview heuristic ... 96
Appendix 5 Timetables for examples penalty calculation ... 106
1-1
1
PROBLEM BACKGROUND AND APPROACH
1.1
INTRODUCTION
This research project the completion of the master Industrial Engineering & Management at the University of Twente with a specialisation in Production & Logistic Management. It is carried out at the School of Economics and Management (SEM) of the Amsterdam University of Applied Sciences (AUAS). We will look into the educational logistics of the SEM and try to identify its link to other parts of the educational process.
The AUAS states its mission as follows (Executive Board, 2015):
It follows that one of the core products of the AUAS is education. Which must be provided to the students within available means and resources. The AUAS also states as one of its ambitions that its students finish their education within the prescribed time (Executive Board, 2015).Which depends on a satisfied, inspired and motivated student body.
The use of resources, personnel and student satisfaction come together in the timetables. The timetables are the result of a trade-off between costs and several resources and can have an impact on the motivation of students to participate in the educational activities on offer. Policies (like no lectures before 11:00 on Monday morning) can increase student motivation and satisfaction but the extra strain on the available resources (empty rooms on Monday, shortages on Tuesday) has been hard to predict or quantify. The goal of this project is to create a tool that enables the school management to do just that: Create a tool that provides insight in the impact of school policy on timetabling and the underlying resources (space and teaching staff).
1.1.1 PROJECT ENVIRONMENT
The AUAS offers 80 bachelor programmes through its seven schools. The school of Economics and Management is divided into four clusters, each with several educational programmes. Two of them have been relocated to one location: the Fraijlemaborg (FMB), these are highlighted in Figure 1.1-1. (Full picture in Appendix 2.)
One of these clusters, Finance & Accounting (FA), initiated this project. It is the largest user of the building and benefits the most from using the Fraijlemaborg as effectively as possible. Collaboration between departments and bodies within the AUAS is becoming one of the policy priorities but the organisation is still compartmentalized and territorial in some areas. The project is done for FA and will be focussed on the programme Business Economics. Outcomes can be produced for other clusters and programmes afterward by using the same methods and tailoring them to specific needs, if necessary.
Cooperation of staff departments is quite important as they are a major source of information. Timetabling is done centralised for all programmes that use the Fraijlemaborg. The scheduling department has a lot of expertise in the field of planning
The AUAS is an educational institute that, with a wide range of professional education programmes, trains a large variety of students that develop their talents to the maximum of their ability in order to practice their profession independently and at a high level.
1-2
and has large amounts of historic data on the programmes of FA and the International Business School (IBS).
1.1.2 CORE PROBLEM
The provision of education to students is limited by the availability of time, lecture rooms and teaching staff. Some of these are set centrally by the AUAS like the lecture times while others are decided on and unlikely to be changed like the location of the lectures.
All educational activities of FA and the cluster IBS take place at the Fraijlemaborg and this location will be used for the foreseeable future. Therefore we consider the FMB a given
Executive
Board DepartmentsStaff
Business Economics Programme Int. Business and Man. Studies Programme Tax law and
Economics Programme Trade Management Asia Programme Accountancy Programme International Business Languages Programme Financial Services Management Programme Cluster Finance & Accounting Cluster Management & Organisation International Business School School of Economics and Management School of Social Work and Law School of Education School of Sports and Nutrition Resource Management Programme Administration Programme
1-3 for this project. Small modifications to the building can be made but the space is limited to this building and its structure cannot be altered. Another thing that cannot be altered is the content of the programmes or the lecture hours.
Assuming that if students’ preferences with regard to their timetable are known, their satisfaction with a timetable and participation in activities can be predicted.
Decisions are made on facilities and human resources, but timetables, where these aspects meet and can be quantified, are not directly included. This is the core problem that is to be solved in the project.
1.1.3 POTENTIAL CAUSES
There may be various issues contributing to the core problem but three of them have been identified as potential main causes. The first of one is the scheduling process. The class schedules are currently made by hand. This process delivers feasible timetables but people throughout the organisation have the feeling that the quality of the schedules can be improved. Such feelings are caused by observations like vacant lecture rooms during highly sought-after time slots. However, assumed underlying problems have not been substantiated yet.
Student dissatisfaction is also noticed through survey results but the reasons behind it are not recorded. To increase the number of satisfied students, one must know what makes them satisfied. To help them finish their degree in time, they have to attend lectures and to do so one has to know what keeps them motivated to attend. As this is not clear, it is impossible to optimise decisions on expected student satisfaction.
The focus within the scheduling department seems to be producing feasible timetables in time. These timetables are currently drafted by hand and automation is put of due to complexity of configuring a software application. This follows from the large amount of timetabling rules and exceptions which must be complete during the input stage to prevent situations that are logical from a technical point of view but obvious errors to the people that use the timetables.
In addition to this situation, problems are caused by the fragmentation of information. Due to the size of the organisation, most information is scattered across lots of departments. This makes it difficult to integrate all constraints and preferences into the timetables. Another complicating factor is the use of multiple copies of the same information by different parties and changes over time, making it hard to assure that the correct version is used.
Besides the availability of information, using the available information correctly is another issue. Creating a timetable is in this case a rather large problem: around 140 lecturers and 80 classes of studentsmust be matched in 98 lecture rooms during a limited number of lecture hours. The lack of a complete scheduling heuristic or algorithm that weighs all constraints and preferences in a structured way makes it difficult to deliver high-quality timetables consistently.
1-4
The potential causes identified so far are: - Unknown student preferences. - Complexity of the scheduling process - Scheduling lies outside management scope.
1.2
RESEARCH APPROACH
This section outlines the objective and research problem of the project, followed by the steps that are taken to solve the research problem and reach the objective. Thereafter follow two paragraphs on data collection and the implementation of the solution upon the completion of the project.
1.2.1 OBJECTIVE
The objective of this project is to create a tool that enables the school management to assess the impact of school policies on the timetables and space usage. The tool will create timetables under different policies and restrictions which can be compared on aspects like student satisfaction and resource utilisation.
In order to do so, we will write a report that maps out the scheduling process and its points of interest. Existing assumptions will be examined and either supported by data or rejected and consensus on what makes a good timetable must be reached with all parties. Furthermore an algorithm will be written. The algorithm is able to construct a timetable based on the constraints and preferences used as input.
The algorithm will be implemented in a piece of software of which the format will be determined later. This will help validate the algorithm and speed up the scheduling process. The increased speed could help in practice but it is intended to enable programme managers to assess potential problems and opportunities in advance. E.g., the effect of a grow or decline in the number of classes, less flexibility due to hiring lecturers that can teach only one subject or concentrating most lectures in the middle of the day can be examined quickly.
1.2.2 QUESTION FORMULATION
The main research question is supported by five sub questions. Answering the sub questions one by one will help to find a solution to the main question that is shown below. How can timetables and space-use be improved by designing a scheduling tool?
I. Which of the policies in place influence the timetables?
II. What makes a good timetable according to students, teaching staff, scheduling department and school management?
III. What are current bottlenecks in the availability of resources?
1-5
1.2.3 ACTIVITIES
The goal is to create a tool that will schedule classes based on input parameters, making the scheduling algorithm the back bone of the tool. Its output will be based on timetables, the actual content of the output (e.g. room utilisation, timetable quality, staffing requirements) will follow from the analysis.
The solution to the problem can be found by going through roughly three phases: analysis of the project environment, design of the management tool and its implementation. Each consists of several activities which are listed below.
Analysis
- Analyse the scheduling process
- Map out school policies that influence timetables - Stakeholder analysis
- Determine the user preferences - Review historic data (timetables)
- Literature review on scheduling and timetables Design
- Compare, select and combine scheduling algorithms and heuristics - Make a concept algorithm
- Verify the algorithm
- Determine the output of the tool
- Review the available data and choose a fitting software format - Program the algorithm
- Validate the programmed algorithm Implementation
- Test the tool with future users (education coordinators of FA) - Make the report suitable for the support of decision-making
1.2.4 DATA COLLECTION
In order to create the management tool, a wide variety of data is needed. This can be broken down into three parts: resources, policies and goals.
Data on resources is roughly everything that is needed to make a timetable: the number of rooms, lecturers, students, classes and lecture hours per day. But also which lecturer teaches which courses and so on. This data has been used to create timetables and should still be available. The information will be extracted from various systems of the AUAS and supplied by several departments. Difficulties can arise if older data is lost or if departments do not cooperate.
1-6
anybody knows how they came to be. Finding the right person or the right document can be hard in a large organisation like the AUAS, especially as most people are only concerned with the application to their tasks and not the creation of such policies.
The last part is concerns the goals and wishes of people within the organisation: Why do people work at or attend the SEM, what are their needs, what are their wishes, how would they compromise on various things. We will include not only managers but also students, lecturers and other employees that are influenced by timetables. The timetables are the interface between policies on resource use and the educational process. This brings up three major parties: policy makers, users and the scheduling department, see Figure 1.2-1. These three parties approach the timetable from their own perspective and the extraction of information from these parties will differ accordingly.
FIGURE 1.2-1 THREE MAJOR PARTIES RELATED TO EDUCATIONAL TIMETABLES.
As each party will have a different relation to the subject, semi-structured interviews will be used to capture all facets of the subject. Surveys can capture a problem but is not suitable to go into detail on possible solutions or the cause.
To ensure that we get the key insights and maybe some surprising additions, we invited opinionated and experienced people: All students are part of the participation council of the BE programme, as is one of the lecturers. One lecturer is member of the central participation council of the AUAS and the other lecturers all have coordinating tasks. The timetabling department is represented by their team coordinator. (We interviewed much more people from the educational branch as their goals can be more subjective and less documented than operational goals.) We try to determine what a good timetable is by interviewing five students, five lecturers, the programme manager of BE and the timetabling coordinator of the SEM. An overview of these interviewees and specialists that are interviewed throughout the project are listed in Appendix 3.
The interviews will be complemented with other sources of information. The general opinions, goals and motivations of the school management are documented in policy documents and scheduling procedures can be found in operating manuals of the timetabling department.
1.2.5 IMPLEMENTATION
2-8
2
MANAGEMENT FRAMEWORK AND STAKEHOLDER
ANALYSIS
In this chapter we will sketch a picture of the policies, stakeholders and goals related to timetables and the timetabling process. Section 0 focuses on the management structure of the school and is followed by a stakeholder analysis in section 2.2 and a quick overview of the influence of external factors in section 2.3. The goals and preferences of the stakeholders are presented in section 2.4 The results of the sections above will result in the answers to research sub questions I. and II. in section 2.5 and 2.6 respectively.
2.1
MANAGEMENT AND POLICY
As mentioned before, a lot of things meet in the timetables. In this section we present a management framework to get a quick overview of which planning decisions are made and how these decisions interact.
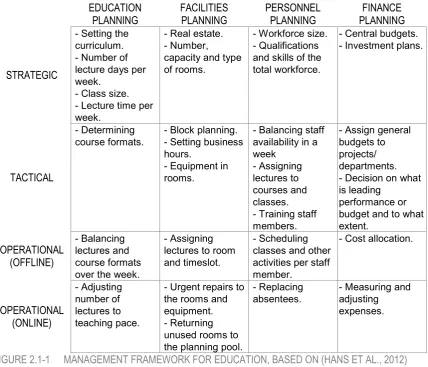
2.1.1 MANAGEMENT FRAMEWORK
A management framework can be useful to get a picture of all planning processes in the school. Hans, Houdenhoven, and Hulshof (2012) suggested such a framework for the healthcare sector. It shows what planning decisions are made on several hierarchical levels and in different managerial areas throughout the organisation. In their case this was useful to bring clinical staff and administrators together and help them understand which processes are influenced by each other and which planning processes should be improved. Such a division and conflict of interests between the primary and secondary process is also be recognized in the schools of the AUAS (P&O, 2013).
The framework organises all planning decisions in a matrix of hierarchical management levels and managerial areas. To fit the framework to the situation at the AUAS some adjustments must be made. The managerial areas, levels and adjustments are explained below.
Management levels
We discern four management levels: strategic, tactical, offline operational, online operational. Strategic level has the longest planning horizon and concerns the design and dimensioning of resources and processes. There is maximum flexibility and limited data. The tactical level lies between the strategic and operational levels. It is limited by the decisions made on the strategic level but more things are known and certain. The focus lies on the organisation and execution of processes on an aggregated level.
2-9 Managerial areas
The four areas distinguished by Hans et al. (2012) are medical, resource capacity, materials and financial planning. In our case the first area is easily translated into educational planning and financial planning is also applicable at universities. However we hardly have any consumable resources but two very important and distinct categories renewable resources: facilities and teaching staff. Therefore resource capacity and materials planning are replaced by facilities and personnel planning. The planning choices in these four categories are placed in the matrix in Figure 2.1-1. We derived the planning choices from various policy documents and interviews with staff members. Their area is based on the subject of the decision and their level on the definitions given above.
EDUCATION
PLANNING FACILITIES PLANNING PERSONNEL PLANNING PLANNING FINANCE
STRATEGIC
- Setting the curriculum. - Number of lecture days per week.
- Class size. - Lecture time per week.
- Real estate. - Number, capacity and type of rooms.
- Workforce size. - Qualifications and skills of the total workforce.
- Central budgets. - Investment plans.
TACTICAL
- Determining
course formats. - Block planning. - Setting business hours.
- Equipment in rooms.
- Balancing staff availability in a week
- Assigning lectures to courses and classes. - Training staff members.
- Assign general budgets to projects/ departments. - Decision on what is leading
performance or budget and to what extent. OPERATIONAL (OFFLINE) - Balancing lectures and course formats over the week.
- Assigning lectures to room and timeslot.
- Scheduling classes and other activities per staff member.
- Cost allocation.
OPERATIONAL (ONLINE) - Adjusting number of lectures to teaching pace.
- Urgent repairs to the rooms and equipment. - Returning unused rooms to the planning pool.
- Replacing
[image:21.595.97.526.237.604.2]absentees. - Measuring and adjusting expenses.
FIGURE 2.1-1 MANAGEMENT FRAMEWORK FOR EDUCATION, BASED ON (HANS ET AL., 2012) 2.1.2 MISSING PLANNING FUNCTIONS
Some planning functions may be missing or could be improved. This is often the case but implementing or improving them may yield great benefits.
In order to keep timetables studiable, the workload for students is to be spread across the week. The timetabling coordinator tries to do this but he has the feeling that his information on or perception of the difficulty of courses is incomplete. A dialogue between the teaching staff and timetabling department will help to mix difficult and less demanding lectures better.
2-10
simultaneously for all programmes of FA and IBS, bottlenecks can be identified and tackled on a tactical level or structurally solved on a strategic level by adjusting the facilities capacity or altering the demand by adjusting and/or aligning the curricula.
2.1.3 CONFLICT OF INTEREST
A key issue is the conflict of interest between the education and operations branches of the school. The first wants to provide students with the best education possible while the latter wants to minimise costs. While teaching staff and educational planning are the responsibility of the programme manager, the facilities and timetabling are controlled by the schools operational manager.
The curriculum is the backbone of the primary process, the educational programme. It dictates which courses are taught in which periods and gives the input for the timetabling process. This process is limited by the availability of rooms that fit the course format and the availability of teaching staff. An ambition of the AUAS is to offer studiable education: a programme that enables motivated students to finish their programme nominally (Executive Board, 2014b, 2014c) and from that perspective the limitations on the timetabling process should be minimized.
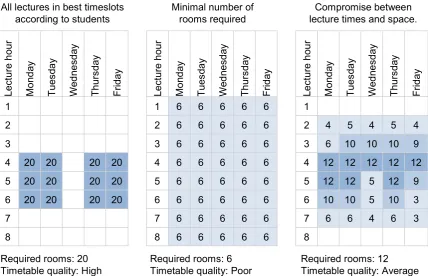
There is a theoretical optimum and to achieve corresponding perfect timetables, all lectures of all classes should be given in the best timeslots. Lecture rooms are rented per month and not by the hour; therefore the minimum rented space is equal to the peak in use. This peak can be lowered by spreading the lectures evenly over all available timeslots. Figure 2.2-1 illustrates a simplified trade-off between perfect studiability and minimization of rented floor space.
The spread of lectures can be limited by staff availability and preferred working hours. The operation bureau could improve the studiability of the timetables or reduce the housing costs if the availability of the staff is maximized. In the quality standards for timetabling, the Executive Board (2014c) poses that teaching staff preferences are to be made ancillary to studiability of the timetables.
Changes in facility capacities are directly related to the availability of personnel and decisions on these changes should be made in conjunction. However it is important to first balance the curriculum such that the number of lectures and lecture formats is as constant over time as possible and to determine a target for studiability. Such a target will prevent capacity reductions, of facilities and personnel, to the point that the primary process becomes compromised.
2.2
STAKEHOLDER ANALYSIS
There are a lot of parties involved in the educational process, almost of all of which deal with timetabling. By mapping them out we get to know which forces are at play and how these stakeholders should be taken into account.
2.2.1 STAKEHOLDER ANALYSIS IN LITERATURE
2-11 “any group or individual who van affect or is affected by the achievement of the organization’s objective” (Freeman, 1984)
Three decades later, a lot has been written on the stakeholder theory, it has been expanded, and refined by numerous contributors. The topic has grown tremendously but they also led to numerous definitions and views and there is even no consensus on what a stakeholder is (Miles, 2012). Clear evidence that using the stakeholder theory increases an organisations performance also lacks (Donaldson & Preston, 1995). All in all, basing a firm’s policy entirely on stakeholder theory is not without controversy. However, this does not mean that it cannot be very useful.
In this project we are not running for profit firm but a budget driven organisation with good education as its product. At first glance, its objective and all powers at work seem vague. By using a stakeholder management framework, all stakeholders can be identified and classified in order to manage the organisation efficiently and effectively. Such a framework is proposed by Mitchell, Agle, and Wood (1997) who based their work on the wide variety of views on stakeholder theory and management available at the time. In this framework each stakeholder has some stake or claim on an organisation: an interest that they want to have served. Managers within the organisation can address these issues. However, due to time and resource constraints, not all claims can be attended to. Therefore matters that are important, salient, to managers will be addressed first. The salience of (groups of) stakeholders can be determined by categorizing them on the basis of three
12 Number of courses taught at a timeslot. All lectures in best timeslots
according to students Minimal number of rooms required lecture times and space. Compromise between
Le ct ur e ho ur M on da y Tu es da y W ed ne sd ay Th ur sd ay Fr id ay Le ct ur e ho ur M on da y Tu es da y W ed ne sd ay Th ur sd ay Fr id ay Le ct ur e ho ur M on da y Tu es da y W ed ne sd ay Th ur sd ay Fr id ay
1 1 6 6 6 6 6 1
2 2 6 6 6 6 6 2 4 5 4 5 4
3 3 6 6 6 6 6 3 6 10 10 10 9
4 20 20 20 20 4 6 6 6 6 6 4 12 12 12 12 12 5 20 20 20 20 5 6 6 6 6 6 5 12 12 5 12 9 6 20 20 20 20 6 6 6 6 6 6 6 10 10 5 10 3
7 7 6 6 6 6 6 7 6 6 4 6 3
8 8 6 6 6 6 6 8
Required rooms: 20
[image:23.595.93.522.255.531.2]Timetable quality: High Required rooms: 6 Timetable quality: Poor Required rooms: 12 Timetable quality: Average
2-12
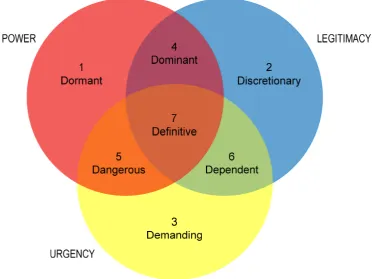
attributes. The definitions of these three attributes: power, legitimacy and urgency can be found in Table 2.2-1.
Figure 2.2-2 shows the stakeholder types that follow from the possible combinations of attributes. These types can be divided into three categories: latent, expectant and definitive stakeholders, all of which will be explained below.
TABLE 2.2-1 KEY CONCEPTS IN STAKEHOLDER IDENTIFICATION BY MITCHELL ET AL. (1997)
Construct Definition
Stakeholder Any group or individual who van affect or is affected by the achievement of the organisation’s objectives.
Power
A relationship among social actors in which one social actor, A, can get another actor, B, to do something that B would not have done otherwise.
Bases Coercive (Force/Threat) Utilitarian (Material/Incentives) Normative (Symbolic/Prestige/Esteem)
Legitimacy A generalised perception or assumption that the actions of an entity are desirable, proper, or appropriate within some socially constructed system of norms, values and beliefs.
Urgency
The degree to which stakeholder claims call for immediate attention.
Bases Criticality (The importance of the claim or the relationship with the stakeholder.)
Time sensitivity (The degree to which managerial delay in attending to the claim or relationship is unacceptable to the stakeholder.)
Salience The degree to which managers give priority to competing stakeholder claims.
Latent stakeholders
The outer ring in Figure 2.2-2 consists of latent stakeholders. These only have one of the attributes and are therefore deemed unimportant or are even disregarded by managers. The stakeholders in categories 1, 2 and 3 are often passive.
Dormant stakeholders have power but no legitimate or urgent claim are not important yet. However managers should be aware of them as they can acquire urgency or legitimacy over time.
Discretionary stakeholders lack power and urgency but as their claim is legitimate, addressing their claims is positive. Doing so is based on goodwill as managers will not experience pressure to do so due to the lack of power or urgency.
2-13
FIGURE 2.2-2 STAKEHOLDER TYPES AND THE THREE MAIN CHARACTERISTICS (MITCHELL ET AL., 1997)
Expectant Stakeholders
The stakeholders in categories closer to the centre, 4, 5 and 6, combine two attributes. This makes them more active and moderately salient to managers. They are recognized and dealt with by management.
Dominant stakeholders pair legitimacy with power. Their legitimate claims should be addressed and their power makes sure that managers must buckle in the long term. Dominant parties can therefore easily attract management attention.
Dangerous stakeholders may have illegitimate claims but are willing to exercise their power to fulfil their claims. Managers need to identify them to mitigate any danger to their organisation or other individuals and entities involved. An example of dangerous stakeholders is a group of employees that sabotages their production to extort exorbitant wages.
Dependent stakeholders have urgent and legitimate claims which ought to be addressed by management. However due to the lack of power, these claims will only become highly salient if they are backed by managers or other stakeholders with power.
Definitive
2-14
The three categories mentioned above help managers to find which stakeholders should be served first. However, the attributes of a stakeholder can change over time and their salience will change with it. Some of these changes can be predictable. Furthermore not all stakeholders are conscious of the attributes they have (e.g. students are unaware of the financial effect of dropping out if they are dissatisfied with their education). If the stakeholders and their attributes are mapped out and updated, managers can include stakeholders in their decision processes they may overlook otherwise or will become highly salient in the near future. We will make such an overview of the school in the next section.
2.2.2 STAKEHOLDERS OF THE TIMETABLING PROCESS
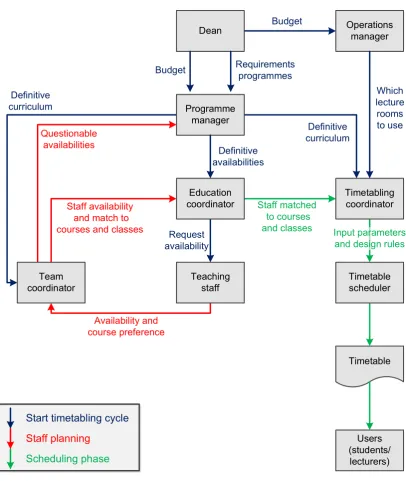
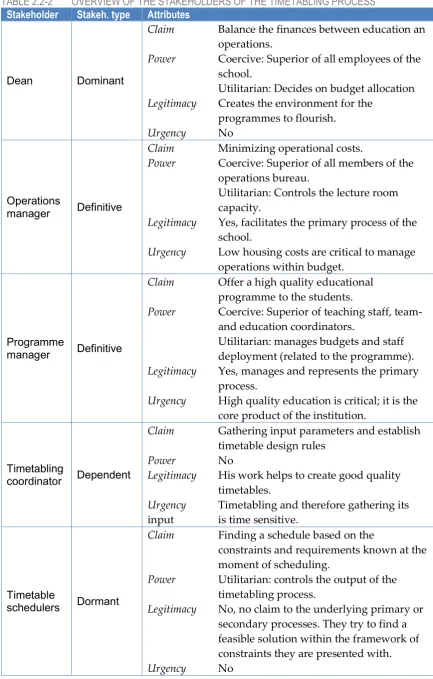
We start off identifying potential stakeholders by mapping the timetabling process, see Figure 2.2-3. However not all stakeholders are covered (e.g. students who do have a claim on the timetables but are not involved in making them). In Table 2.2-2 an overview of all stakeholders. These include all parties with one or more of the attributes mentioned in section 2.2.1.
Definitive stakeholders
We identified three definitive stakeholders: the programme and operations manager and the students. The first two represent the two managerial areas with a conflict of interest that were mentioned in the section 2.1.3 while the students are not directly included anywhere in the process.
The key to solving any problems related to timetabling is giving both managers a joint goal and explicitly include the interest of students.
Expectant stakeholders
The majority of the expectant stakeholders are Dependent stakeholders: the timetabling, education and team coordinators. Their lack of power slows the gathering of input information and therefore the start of the timetabling process. Backing of a stakeholder with power (the dean or one of the managers) could help to get people to act on requests of the coordinators. Especially the backing of the timetabling coordinator by the programme coordinator could change his salience and the whole timetabling process dramatically.
The last expectant stakeholder is the dean of the SEM. If problems surrounding timetabling become critical to the performance of the whole school or if a dependent stakeholder gets his attention, the dean will instantly become a definitive stakeholder. The involvement of the dean in matters at an operational and tactical level can be monitored to predict if or when he shifts the power balance.
Latent stakeholders
2-15 quality education or minimization of costs) they become dominant stakeholders and become more salient.
Staff availability and match to courses and classes
Staff matched to courses and classes
Availability and course preference
Timetable
Definitive curriculum
Questionable availabilities
Definitive curriculum
Input parameters and design rules
Users (students/ lecturers) Operations
manager
Which lecture
rooms to use Budget
Dean
Programme manager
Budget
Definitive availabilities
Request availability
Requirements programmes
Team
coordinator Teachingstaff Timetablescheduler
Timetabling coordinator Education
coordinator
Start timetabling cycle
Staff planning
[image:27.595.107.514.108.590.2]Scheduling phase
2-16
TABLE 2.2-2 OVERVIEW OF THE STAKEHOLDERS OF THE TIMETABLING PROCESS
Stakeholder Stakeh. type Attributes
Dean Dominant
Claim Balance the finances between education an operations.
Power Coercive: Superior of all employees of the school.
Utilitarian: Decides on budget allocation Legitimacy Creates the environment for the
programmes to flourish. Urgency No
Operations
manager Definitive
Claim Minimizing operational costs.
Power Coercive: Superior of all members of the operations bureau.
Utilitarian: Controls the lecture room capacity.
Legitimacy Yes, facilitates the primary process of the school.
Urgency Low housing costs are critical to manage operations within budget.
Programme
manager Definitive
Claim Offer a high quality educational programme to the students.
Power Coercive: Superior of teaching staff, team- and education coordinators.
Utilitarian: manages budgets and staff deployment (related to the programme). Legitimacy Yes, manages and represents the primary
process.
Urgency High quality education is critical; it is the core product of the institution.
Timetabling
coordinator Dependent
Claim Gathering input parameters and establish timetable design rules
Power No
Legitimacy His work helps to create good quality timetables.
Urgency Timetabling and therefore gathering its input is time sensitive.
Timetable
schedulers Dormant
Claim Finding a schedule based on the
constraints and requirements known at the moment of scheduling.
Power Utilitarian: controls the output of the timetabling process.
2-17 Stakeholder Stakeh. type Attributes
Education
coordinator Dependent
Claim Gathering staff availability and information on course content. Power No
Legitimacy Work contributes to good and workable timetables
Urgency Timetables cannot be made without the gathered information.
Team
coordinator Dependent
Claim Balancing staff availability and assigning staff to classes and courses.
Power No
Legitimacy Good staffing helps improving the education and timetable.
Urgency Getting the staffing right is critical to the quality of the primary process and the quality of the timetables.
Teaching
staff Dormant
Claim Pleasant working hours, lecturing preferred courses and a reasonable workload.
Power Utilitarian: Resignation reduces teaching capacity of the school.
Legitimacy No, just individual preferences. Urgency No
Students Definitive
Claim Studiable and pleasant timetable. Power Utilitarian: Can reduce revenues by
dropping out.
Normative: Determines whether targets are met by the school through the NSE.
Legitimacy Expecting a studiable timetable that helps them perform well is desirable.
Urgency Their performance and opinions are critical to the institutional goal: providing society with highly educated professionals.
2.3
EXTERNAL ENVIRONMENT
We have limited ourselves to the school while identifying stakeholders, everything outside the school is in that sense the external environment. This environment will influence certain decisions, mainly by the dean and operations managers. Their budgets are dictated by the government and their autonomy with regard to housing is limited by policies and availability at a central level of the AUAS.
2.3.1 ROLE OF FACILITY SERVICES
2-18
Management. We covered space availability, costs and the determination of space demand.
Facility Services manages the real estate and housing needs of the AUAS and provides accomodation at various locations in Amsterdam. For example on the newly built Amstel Campus or in case of FA at the Fraijlemaborg. Some accomodations are owned by the AUAS while others are rented (with longterm contracts). They try to fit all departments in accomodation of suitable size and facilities such that the available buildings are used fully and rental accomodations are kept to a minimum. All schools come to an agreement with Facility Services on which accomodation to use. Schools are not free to pass on an offer and rent space from external parties.
The housing costs are based on a AUAS wide price per square meter. Following the interview with staff from Facility Services, Jeroen Roosen looked into the formation of that central price. It was found that the costs of certain central services are divided between the departments with Activity-Based Costing since 2012. Costs of the services are allocated to activities and these activities are given units of account. E.g. rent and depreciation are related to space use and space use is measured with square meters of functional floor space. The costs in the example and others that have floor space as unit of account are all added up and charged to the schools and departments pro rata with their space usage. These AUAS-wide prices are based on solidarity. Costs (and prices) are optimised on university level. Which drove the costs up for departments, programmes and faculties that had below average costs before 2012 as local cost optimisation that increase the total costs is prohibited.
Space demand is determined with a space standard, a certain area per student. This standard was determined in 2008 after research by Van Aarle De Laat. The original documentation was not available anymore but Jeroen Roosen did find out that it was based on the space use and student numbers in 2008: It was estimated that, with some efficiency gains 1.3m2 per student would be enough for all regular lecture rooms (0.9m2) and office space (0.4m2). This original standard is also used for budgetting purposes. Faculties are free to deviate from the standard as they see fit. (E.g. if a programme offers a below average number of contact hours to its students.)
2.3.2 IMPLICATIONS OF THE SPACE STANDARD
As mentioned briefly: the vast majority of funds are provided by or set (tuition fees) by the government and split between the faculties. Making the AUAS as well as the SEM a budget driven organisation. The funds available dictate what resources can be used instead of basing resource levels solely on demand. This combined with a rule of thumb/standard of unclear origin can provoke the thought that the operational branch does not determine the space capacity based on what is needed to provide a good educational programme.
2-19
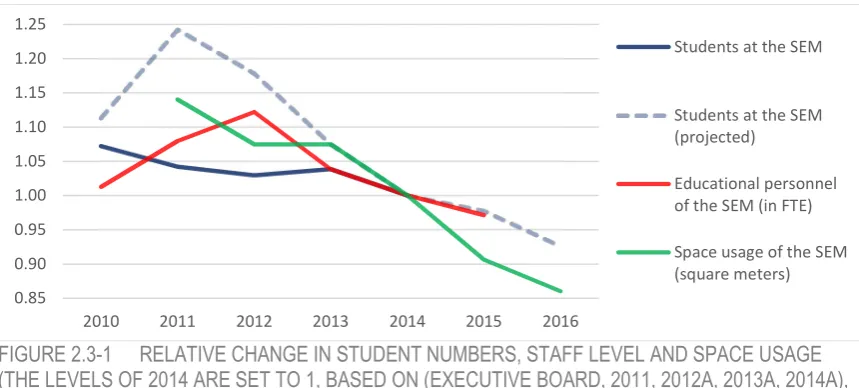
FIGURE 2.3-1 RELATIVE CHANGE IN STUDENT NUMBERS, STAFF LEVEL AND SPACE USAGE (THE LEVELS OF 2014 ARE SET TO 1, BASED ON (EXECUTIVE BOARD, 2011, 2012A, 2013A, 2014A), AND MANAGEMENT REPORTS).
The staff levels seem to follow the projected student numbers albeit with some delay and the student/lecturer ratio seems stable since 2013. The other main resource level, space, seems to decrease twice as fast as the number of students. It dropped from 1.421 m2 per student in 2011 to 1.298 m2 per student in 2014 and is projected to decrease even further: below the standard. This implicates that the space standard is not the bare minimum which leaves the question: What is? While that question remains unanswered, the resource levels and quality of education can creep slowly to unacceptable levels. The result of this project is a tool that can quantify what space usage is needed to accommodate a predetermined acceptable educational process. This should help to identify hidden, structural problems. Problems which then can be solved or dealt with in a trustful and transparent environment.
2.4
STUDENT AND STAFF PREFERENCES
Through several interviews the preferences of students and staff members have been determined. An overview of who were interviewed can be found in Appendix 3. The outcomes are presented below per group.
2.4.1 PROGRAMME MANAGER AND TEAM COORDINATORS
At the centre of the educational branch are the programme manager and team coordinators. Their primary goal is to provide students the best education possible. The starting point is the curriculum which is built up in three lines: knowledge, skills and formation. Courses are sequential in those lines and those lines cover the entire length of the programme. Most courses include multiple formats (lectures, computer tutorials, project guidance etc.) which require different resources (types of rooms). The demand for resources is and will not be perfectly balanced over the year as this would deteriorate the quality of the programme.
Another important goal is to encourage interaction between students and lecturers. This is facilitated by matching classes and lecturers for a longer period of time. Students will be taught by the same lecturers in several periods. E.g. their second year statistics module is ideally taught by the same lecturer as their first year statistics module. This makes the teaching staff more approachable and more closely involved.
0.85 0.90 0.95 1.00 1.05 1.10 1.15 1.20 1.25
2010 2011 2012 2013 2014 2015 2016
Students at the SEM
Students at the SEM (projected)
Educational personnel of the SEM (in FTE)
2-20
This leaves student participation in the courses. An average student ought to spend 42 hours per week on his education to finish his or her programme nominally. To encourage this their lectures (around 16 hours) are to be spread over four days to keep them engaged with their studies and give them one day a week to work on their coursework and assignments. However spreading the work to keep student focused on their studies is not the only factor, their attentiveness during lectures is also important. Therefore, for example, the first and last lecture hours should be avoided.
In addition to these education related matters, there is one more general wish. There is a feeling that the programmes are not equally assigned highly sought after and unwanted timeslots and lecture rooms.
All in all, the curriculum is set and there is no intention to alter it to spread resource demand evenly and there are some preferences regarding the timetable. These are spreading the lectures over 4 days per week for every class, avoiding early and late lectures and dividing the positively and negatively rated timeslots and rooms equally among the programmes that use them.
2.4.2 STUDENTS
The students seem to want a day programme that is worthwhile to attend. A major issue for students is travelling time. One way commutes between 40 and 90 minutes are normal. This makes it very tempting to skip a 100 minute lecture that could seemingly be read at home too. Therefore four lecture hours is mentioned as the minimum number of lectures hours per day and lectures a preferred between 10:00 and 16:00
In order to be home at a decent time or to have the freedom to choose to work on assignments, it is important to concentrate the lectures close together. However, free periods are not necessarily a problem. Students use them to work on assignments or projects. In this case consecutive free periods are preferred: rather two and four hour lectures with a two hour period in between and three two hour lectures separated by two single hour free periods.
Once more, it is important to make it worthwhile to attend a lecture. Courses that are difficult or related to the field of study are deemed more important and are less likely to be skipped. These can be scheduled on their own, while courses that are deemed less interesting or important are better scheduled adjoined to others.
Probably due to the low number of scheduled hours a week, combinations of hard classes were not widely mentioned as a problem. A tough day was more often described as a long (eight hour) day with hardly any breaks.
In summary, the students’ preferences with regard to their timetable are: lecture times between 10:00 and 16:00, no multiple single free hours on a day, lectures clustered and no long days without breaks. In order to keep them from skipping class, courses that are perceived to be less important should not be scheduled apart from other lectures.
2.4.3 TEACHING STAFF
Most lecturers have some personal preferences with regard to their courses and working times. However they stress that it are preferences and not demands and should not be leading in scheduling.
2-21
2.4.4 TIMETABLING TEAM
The timetabling team is focused on scheduling all classes in accordance to the given constraints. Where the constraints are: the lecture rooms to be used, the staff availability and the lecturer-class matches. While doing so they try to accommodate wishes like avoiding the first and last lecture hours.
From an operational perspective, the maximum number of rooms/floor space should be minimized to reduce housing costs. This is a constant pressure. To do so and still find feasible solutions to the timetabling problem, staff availability should be maximized while the number of other staff related constraints is to be minimized. This wish is the core of the conflict by education and operations. The educational branch feels that it has reasonable demands and that the support staff, the schedulers, should help them by providing the best timetable that fits within their constraints whereas the schedulers feel that their job is made needlessly difficult by most parties involved.
The team links information together into a timetable. In order to do so they require complete and correct information on time to start scheduling. The focus is on necessary information. However they think they can refine timetables if they get inessential information like which courses and course formats are to be scheduled far apart and which can be scheduled consecutively without problems.
2.5
SUMMARY OF POLICIES
The sections below will answer research sub question I. per managerial area of the framework in section 2.1.1. This question is:
I. Which of the policies in place influence the timetables?
Most policies mentioned below are formally documented, however, some exist as tacit knowledge in the organisation.
2.5.1 EDUCATION
There are few formal policy documents on how the educational program is to be organised. Ideas and didactic concepts are discussed in teams and incorporated in curricula, courses etc.
Curriculum
Curricula are set for multiple years and contain the outline of the programme: What is taught, at which stage of the programme. They can be revised but programme managers tend to avoid that as it will requires a lot from the educational organisation besides the regular teaching activities.
Performance Agreements with the Government
The AUAS makes performance agreements with the Ministry of Education, Culture and Science. Part of these agreement is a minimal number of contact hours between lecturer and student (Executive Board, 2012b, 2013b). The minimum lecture time per week that a programme should offer is dictated by these agreements.
Informal policy
2-22
documentation. These decisions affect all managerial levels from the number and size of classes, via course formats to balancing the workload of students over the week during timetabling.
2.5.2 FACILITIES
Lecture rooms are the main facilities needed for timetabling. The area of teaching spaced is to be based on AUAS wide guidelines (Facility Services, 2013). However the operations manager of the school may deviate from these guidelines. The bridge between operations and education in the form of a service level agreement (as advised by Van Beek (2012)) is not yet in place.
2.5.3 PERSONNEL
Personnel planning with regard to teaching staff is the responsibility of programme managers. They have freedom on the composition of the workforce but are restricted in its size.
Budget of the AUAS
The AUAS reserves a certain amount of money to pay teaching staff of each school (Executive Board, 2014a). This budget limits the size of the workforce.
Performance Agreements with the Government
The Executive Board (2012b) has agreed that a certain percentage of the teaching staff has a master’s degree. This limits the candidates a programme manager can hire.
Collective Labour agreement
Collective labour agreements limits the number of working hours that can be assigned to employees. These set the boundaries, in combination with task assignments, to the deployment of staff members.
Task assignment Standard
The standard assigns a time load to all tasks of a lecturer. This helps to objectively spread the workload over the staff and influences the task assignment that influences the deployment of staff members.
Informal policy
Assigning courses and classes to lecturers (who does what) are done by team coordinators in conjunction with the lecturers involved.
2.6
SUMMARY OF PREFERENCES
This section answers the second research sub question:
II. What makes a good timetable according to students, teaching staff, scheduling department and school management?
In separate interviews, the students came in broad lines to the same ideas. Staff members differed more in the solutions they proposed but all aimed at the same goal: high attendance and attentiveness.
2-23 Once there they want to make use of their time so they do not want to cut off project meetings because the next lecture starts and have another free period afterwards. The decision on attending a lecture is also often made for a separately planned first or last lecture of the day.
[image:35.595.92.521.283.686.2]Staff members concentrate on getting students to work on their studies for 40 hours a week (time on task), the absorption and processing of the learning material. I.e. getting students to attend and make use of the lectures offered to them.
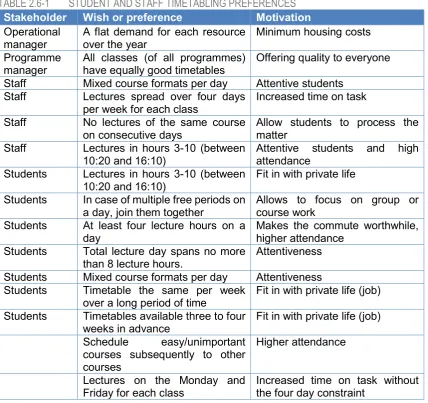
Table 2.6-1 contains the wishes and preferences of the schools staff and the students. It will be the basis of the scoring of timetables in the following chapters. The last two rules were not directly mentioned but can help to solve conflicts between students and staff: Scheduling three days of lectures per week of which Monday and Friday are given, makes each of them worthwhile to travel for while avoiding the loss of an entire day of studying as students get the feeling that it is weekend already.
TABLE 2.6-1 STUDENT AND STAFF TIMETABLING PREFERENCES
Stakeholder Wish or preference Motivation
Operational
manager A flat demand for each resource over the year Minimum housing costs Programme
manager All classes (of all programmes) have equally good timetables Offering quality to everyone Staff Mixed course formats per day Attentive students
Staff Lectures spread over four days
per week for each class Increased time on task Staff No lectures of the same course
on consecutive days Allow students to process the matter Staff Lectures in hours 3-10 (between
10:20 and 16:10) Attentive students and high attendance Students Lectures in hours 3-10 (between
10:20 and 16:10) Fit in with private life Students In case of multiple free periods on
a day, join them together Allows to focus on group or course work Students At least four lecture hours on a
day Makes the commute worthwhile, higher attendance Students Total lecture day spans no more
than 8 lecture hours. Attentiveness Students Mixed course formats per day Attentiveness Students Timetable the same per week
over a long period of time Fit in with private life (job) Students Timetables available three to four
weeks in advance Fit in with private life (job) Schedule easy/unimportant
courses subsequently to other courses
Higher attendance
Lectures on the Monday and
3-24
3
UNDERLYING MODEL
This chapter explains on which model the tool is based in section 3.1 and the working of the timetabling heuristic that we used in sections 3.2 and 3.3. We show what input data we used for the tool in the final section, 3.4,.
3.1
DETERMINING THE USAGE OF EDUCATIONAL SPACE
The objective of this project is to create a tool that enables the school management to assess the impact of school policies on the timetables. Policies determine demand and resource capacity. E.g. policies like “all lectures must be taught between 12:00 and 14:00”, “only fifteen lecture rooms may be used” or “at least 50 accountancy lecturers must be employed” create an extreme peak demand for lecture rooms, a very low space capacity and a high teaching capacity respectively. The demand for space and staff follows from the educational events (all lectures, tutorials, etc. in the curriculum) that are to be scheduled. While the resources teaching staff and lecture rooms are determined by things like the number of employees and their days of and the amount of floor space rented. In order to see how demand and resource levels interact, we vary them and evaluate which combinations make it impossible to create a feasible timetable. In timetabling the main resources are space and teaching staff. It is often accepted that space remains unused sometimes while staff is almost always utilised fully. This makes educational space the closing entry:How much space is needed given the classes, curricula, business hours and staff levels?
In order to determine the required space, we must determine when the available space is used to its full potential.
3.1.1 DEFINITION OF SPACE UTILISATION
Lecture rooms (educational space) offer a place to teach a course to a group of students. They basically consist of a quiet environment with seating arrangements and some means of communicating the course content. But the usage of a school building can be measured in various ways, e.g. is it fully used if all rooms are used all the time of only if all seats in all rooms are used each lecture hour? Furthermore, on an even lower level what is the unit of measure of the capacity of a lecture rooms, its floor area, its volume or the number of seats in it.
To start with the latter, Beyrouthy et al. (2006) use a unit of measure that can be used to measure both the capacity of a room and the demand generated by an event: the seat-hour. It is a multiplication between the number of seats or students with a period of time. E.g. a room with 30 seats in a school that operates 5 days a week, 8 lecture hours per day has a capacity of 1200 seat-hours (per week) while a two hour lecture for a class of 25 students creates a demand of 52 seat-hours. They also use roomslots as a unit of measure: The number of timeslots a room is available or used. E.g. if we have again, 5 days a week, 8 timeslots per day and have scheduled a two hour lecture, then there are 80 roomslots in total of which 2 are used.
3-25 Beyrouthy et al. (2006) also identified three important measures of space usage on an aggregate level: utilisation, frequency and occupation. They are all ratios of what is used for educational events like lectures and what is available in the school building.
, = ˗ℎ ˗ℎ
, =
, = ˗ℎ ˗ℎ ℎ ℎ
: = ∗
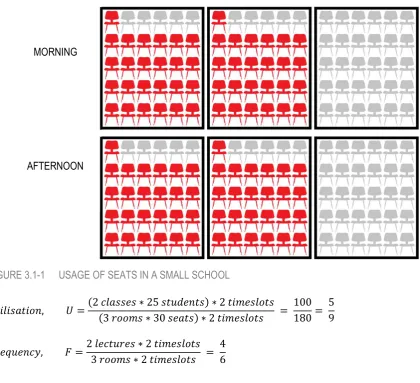
Consider the following example:
We have a school with 3 classrooms with a capacity of 30 seats.
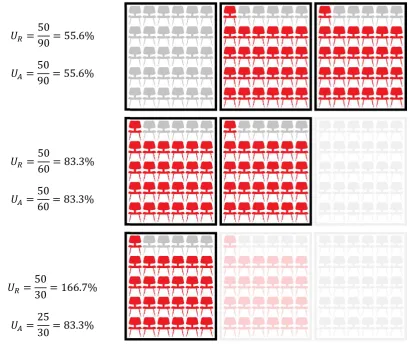
[image:37.595.102.523.381.764.2]That school is open 1 day a week, and that day has 2 timeslots: morning and afternoon. There are 2 classes with 25 students which attend lectures in both the morning and the afternoon. Figure 3.1-1 depicts the usage of seats in the school. During both timeslots, one room has 30 unused seats in it while two rooms contains 25 used seats and 5 unused seats.
FIGURE 3.1-1 USAGE OF SEATS IN A SMALL SCHOOL
, =(2 (3 ∗ 25 ∗ 30 ) ∗ 2 ) ∗ 2 = 100180 = 59
, =2 3 ∗ 2 ∗ 2 = 46
MORNING
3-26
, =(2 (2 ∗ 25 ∗ 30 ) ∗ 2 ) ∗ 2 = 100120 = 56
= ∗ =46 ∗ 56 = 4 ∗ 56 ∗ 6 = 2036 = 59
The utilisation, frequency and occupancy from the example are calculated above. They all can point to certain problems. A utilisation close to 100% indicates that all is well: rooms are often used and the class sizes are close to the room sizes. A low frequency indicates that there is a surplus of rooms as they are often not used (this can vary per room size or type). The occupancy indicates if the room sizes match the classes sizes well (high occupancy) or not (low occupancy).
In our project, we want to make full use of the resources at hand. Therefore we will focus on utilisation rather than frequency and occupancy. If utilisation is lower than expected under certain circumstances, we can look into the other two measures to determine the causes.
3.1.2 DEFINITION OF CRITICAL UTILISATION
We want to assess the interaction between demand and resource levels. One of the interests is a minimisation of costs, which can be done by minimising resources. Therefore we focus on the minimum resource level needed to meet all demand. With our model we create a scenario which consists of classes of students, the events they will attend, lecturers that teach each event and some restrictions on when or where specific events must be scheduled and determine what the minimum set of rooms is to create a feasible timetable. This is visualised in Figure 3.1-2 as communicating vessels with a liquid in them. If the number of rooms is too low, not all events, the liquid, will fit in the timetable. By trying lots of sets of rooms, we identify the lowest level of rooms that can house all events.
As events vary from time to time and additional space can be acquired and abandonned, we work with a general concept: utilisation. When the staff levels, rooms etc. grow proportionally with the number of enrolled students, the utilisation of the educational space stays constant and timetables will have the same quality. Therefore one could estimate the demand for educational space based on the number of events (which depends on student numbers) and a utilisation.
CLASSES LECTURERS TIMESLOTS ROOMS
[image:38.595.80.510.482.629.2]ACTIVITIES