University of Warwick institutional repository: http://go.warwick.ac.uk/wrap
This paper is made available online in accordance with publisher policies. Please scroll down to view the document itself. Please refer to the repository record for this item and our policy information available from the repository home page for further information.
To see the final version of this paper please visit the publisher’s website. Access to the published version may require a subscription.
Author(s): M.J. Knight, F. Allegretti, 1, E.A. Kröger, M. Polcik, 2, C.L.A. Lamont and D.P. Woodruff
Article Title: The adsorption structure of furan on Pd(1 1 1) Year of publication: 2008
Link to published version:
The adsorption structure of furan on Pd(111)
M. J. Knight1,F. Allegretti1, E. A. Kröger2, M. Polcik2, C. L. A. Lamont3, D. P. Woodruff1,
1
Physics Dept, University of Warwick, Coventry CV4 7AL, UK
2
Fritz-Haber-Institut der Max-Planck-Gesellschaft, Faradayweg 4-6, 14195 Berlin, Germany
3
Dept. of Chemical & Biological Sciences, University of Huddersfield, Queensgate, Huddersfield HD1 3DH, UK
Abstract
The structure of molecular furan, C4H4O, on Pd(111) has been investigated by O K-edge near-edge X-ray absorption fine structure (NEXAFS) and C 1s scanned-energy mode photoelectron diffraction (PhD). NEXAFS shows the molecule to be adsorbed with the molecular plane close to parallel to the surface, a conclusion confirmed by the PhD analysis. Chemical-state specific C 1s PhD data were obtained for the two inequivalent C atoms in the furan, the -C atoms adjacent to the O atom, and the -C atoms bonded only
to C atoms, but only the PhD modulations for the -C emitters were of sufficiently large amplitude for detailed evaluation using multiple scattering calculations. This analysis
shows the -C atoms to be located approximately 0.6 Å off-atop surface Pd atoms with an associated C-Pd bondlength of 2.13±0.03 Å. Two alternative local geometries consistent with the data place the O atom in off-atop or near-hollow locations, and for each of these local structures there are two equally-possible registries relative to the fcc and hcp hollow sites. The results are in good agreement with earlier density functional theory calculations which indicate that the fcc and hcp registries are equally probable, but the PhD results fail to distinguish the two distinct local bonding geometries.
Keywords: surface structure; chemisorption, photoelectron diffraction; NEXAFS; Pd; furan
present address: Karl-Franzens-Universität Graz, Institut für Physik, Bereich für Experimentalphysik, Universitätsplatz 5, 8010 – Graz, Austria
1. Introduction
Furan, C4H4O (fig. 1), is the simplest oxygen-containing aromatic hydrocarbon, and is often used as a model in hydrodeoxygenation studies of such compounds that need to be removed from crude petroleum and liquids derived from coal and biomass [1]. Surface science investigations on well-characterised single crystal surfaces have shown that while the molecule adsorbs and desorbs intact on the clean noble metal surfaces of Cu(110) [2] and Ag(110) [3], on Pd(111) furan adsorbs intact at low temperatures, but around room temperature deoxygenation occurs with the production of CO [4, 5, 6]. Indeed, there is some evidence of partial formation of surface benzene through coupling of a C3H3 surface intermediate, although no benzene is produced in the gas phase as this molecule dissociates on Pd(111) on heating. While these investigations have established the key chemistry of the interaction of furan with Pd(111), the structural information they have yielded is limited. By the application of dipole selection rules in high-resolution electron energy loss spectroscopy (HREELS), Ormerod et al. [4] have proposed that, at least at
high coverage, the intact furan molecule neither lies flat on the surface nor with its molecular plane perpendicular to the surface, but a quantitative value of the molecular tilt angle cannot be obtained from this technique. Subsequently, scanning tunnelling microscopy (STM) studies of this adsorption system have been shown to yield images consistent with an essentially flat-lying geometry [7, 8], at least at low coverages, although these data do not necessarily imply that the molecular plane lies exactly parallel to the metal surface. This work included theoretical simulations of the STM images using extended Hückel theory [7, 9] and, most recently, ab initio density functional theory
(DFT) calculations of the local adsorption geometry [10].
states unfortunately limit our ability to distinguish several specific adsorption sites, but the resulting information nevertheless provides a valuable complement to that of the previous DFT calculations.
2. Experimental details and surface characterisation
The experiments were conducted in an ultra-high vacuum surface science end-station equipped with typical facilities for sample cleaning, heating and cooling. This instrument was installed on the UE56/2-PGM-2 beamline of BESSY II which comprises a 56 mm period undulator followed by a plane grating monochromator [13]. Different electron emission directions can be detected by rotating the sample about its surface normal (to change the azimuthal angle) and about a vertical axis (to change the polar angle). Sample characterisation in situ was achieved by low energy electron diffraction (LEED) and by
X-ray photoelectron spectroscopy (XPS) using both Mg K radiation and the incident
synchrotron radiation (SXPS). Both the wide-scan photoemission spectra for surface characterisation, and the narrow-scan O 1s and C 1s spectra recorded in the PhD measurements, were obtained using an Omicron EA-125HR 125 mm mean radius hemispherical electrostatic analyser. This was equipped with seven-channeltron parallel
detection, and was mounted at a fixed angle of 60 to the incident monochromated synchrotron radiation in the same horizontal plane as that of the polarisation vector of the radiation.
A clean well-ordered Pd(111) surface was prepared from an oriented and polished crystal slice by the usual combination of cycles of 1 keV Ar ion bombardment and brief annealing to 900 K to give a sharp (1x1) LEED pattern and XPS/SXPS spectra devoid of impurities. Note that using the Mg K X-ray source led to an overlap of the C 1s emission
with that of the Pd 3d5/2 peak generated by the weak Mg Ksatellite line, initially giving
heating the sample to ~750 K in a partial pressure of 5x10⁻⁹ mbar of oxygen, the surface then being heated briefly to 900 K in UHV to remove the surface oxygen.
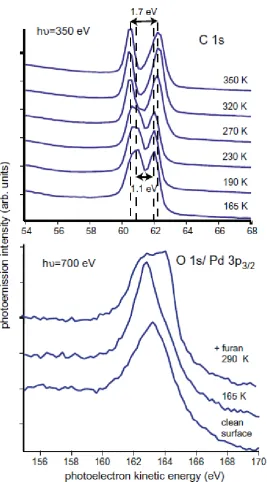
Furan dosing of the surface was conducted at a sample temperature of ~90 K by introducing the vapour into the chamber from an ampoule after three freeze-pump-thaw cycles to improve purity, the absence of contaminants being established by mass spectrometry during the dosing. Typical exposures of 6x10⁻⁶ mbar.s were used, followed by brief heating to 160 K with the objective of desorbing any possible multilayer components. Fig. 2 shows typical SXPS spectra recorded around the C 1s and O 1s emission peaks. The C 1s spectra clearly show two distinct components, the energies of which differ after heating to successively higher temperatures. This temperature dependence is consistent with the results of earlier studies (including conventional laboratory-based XPS [4]) which showed that the intact furan molecule reacts to form coadsorbed CO and C3H3 in the temperature range from ~230-300 K [4, 5]. The C 1s spectra recorded at temperatures of 320 K and higher in Fig. 2 thus show two distinct C 1s photoelectron binding energies (separated by ~1.7 eV) associated with coadsorbed reaction products, the larger binding energy state (lower kinetic energy in Fig. 2) being identified as associated with the CO, while the lower binding energy state is attributed to the C3H3. At low temperatures two peaks separated by ~1.1 eV, which both have different binding energies to those of the reaction products, can be associated with the two inequivalently-located C atoms within the furan molecule. In particular, by comparison with the relative binding energies seen for CO and C3H3 in the spectrum from the dissociation products, it seems reasonable to attribute the higher binding energy state to the C atoms bonded to O (and H) atoms, the so-called -C atoms (fig. 1) while the C
they also remark that it may be due to CO adsorption due to CO being displaced from the chamber walls during the furan exposure. The fact that our low temperature C 1s SXPS spectra seem to show no indication of a high-energy component of the low binding energy state due to coadsorbed C3H3 would appear to favour the latter explanation. By contrast to the detailed information available from the C 1s SXPS, the O 1s spectra are far less informative due to the overlap of the strong Pd 3p3/2 substrate emission peak. The spectra in this energy range (fig. 2) show changes in the relative intensity and photoelectron bindings energies of the unresolved component peaks after heating to 290 K, consistent with the changing O environment from that in molecular furan to that in CO, but also with possible changes in the surface component of the Pd 3p3/2 emission.
The PhD technique [11, 12] exploits the coherent interference of the directly-emitted component of the outgoing photoelectron wavefield from a core level of an adsorbate atom with components of the same wavefield which are elastically backscattered by the nearby substrate atoms. By measuring the photoemission intensity in specific directions as a function of photon energy, the resulting changes in photoelectron energy, and thus photoelectron wavelength, cause specific scattering paths to switch in and out of phase with the directly-emitted component, leading to modulations in the intensity which depend on the relative emitter-scatterer location. These PhD modulation spectra were obtained by recording a sequence of photoelectron energy distribution curves (EDCs) around the O 1s and C 1s peaks at 4 eV steps in photon energy in the photoelectron kinetic energy range of approximately 50 to 250-300 eV for each of a number of different emission directions. The upper end of this energy range was constrained by the overlap of the relatively weak adsorbate photoemission peaks with the intense Pd MNN Auger electron peaks which makes reliable separation difficult, particularly for the weak C 1s signals. Note that the 4 eV steps used here are slightly larger than commonly used in earlier studies, a choice made to reduce the time taken to collect the data after early measurements revealed some radiation-induced dissociation of the molecule. It was therefore important to ensure that each complete PhD spectrum could be recorded with a minimal amount of such damage. Such spectra were recorded in the polar emission angle
(Fig. 3). These data were processed following our general PhD methodology (e.g. [11, 12]) in which the individual EDCs are fitted by the sum of Gaussian peaks, a step and a template background. The integrated areas of each of the individual chemically-shifted component peaks were then plotted as a function of photoelectron energy and each final PhD modulation spectrum was obtained by subtraction of, and normalisation by, a smooth spline function representing the non-diffractive intensity and instrumental factors. These PhD modulation spectra were used in the structure analysis described in the following section.
For the C 1s spectra this standard procedure worked well, the two principal components associated with emission from the -C and -C atoms being easily separated, although it was not possible to separate the very small additional component due to coadsorbed CO
from that due to the furan -C. The NEXAFS data, however, indicate that this
contaminant contributes ~10% to the intensity, and thus unlikely to affect the PhD spectra significantly. For the O 1s data, however, reliable separation of the O 1s and Pd 3p3/2 components proved not to be possible. The overlap of the XPS signals from these two elements is well known, and is clearly a major problem with conventional unmonochromated laboratory sources of X-rays, but using the superior resolution available to us in these experiments we had expected to be able to surmount this difficulty. This proved not to be the case. The problem here is not only that the substrate Pd 3p3/2 component is intense (and shows strong PhD modulations in intensity), but this substrate emission itself is expected to comprise at least two distinct components associated with emission from the surface and subsurface (‘bulk’) atoms (like the Pd 3d3/2 peak [15]). Moreover, previous detailed studies of the Pd 3d spectrum indicate that adsorption may lead to chemical shifts in the surface component(s) [15], so using the clean surface spectra as a means of subtracting the Pd component to extract the O 1s component are also unlikely to be reliable. After exhaustive efforts to effect the separation in a range of different ways we finally concluded that it was not possible to extract meaningful O 1s PhD modulation spectra from the recorded data.
measuring the intensity of the electron emission at the energy corresponding to the O KVV Auger transition (513 eV), and scanning the photon energy through the O K-edge. Spectra were recorded at a range of angles of incidence from normal to grazing; these changes in incidence geometry provide information on the dependence of the intensity of the molecular resonance peaks on the direction of the polarisation vector of the linearly-polarised incident radiation. These data provide the basis for a determination of the molecular orientation.
3. Results and data analysis
3.1 NEXAFS
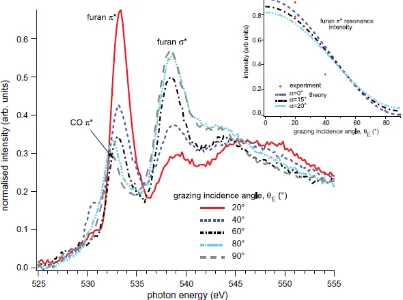
Fig. 4 shows the set of O K-edge NEXAFS spectra recorded from the molecular furan adsorbed on Pd(111). The measurements were made at a series of different incidence
angles; using the usual NEXAFS nomenclature, these angles, E, correspond to the
grazing angle (i.e. E=90º corresponds to normal incidence). Notice that, because of the
geometry of the experiment, using horizontally-polarised radiation, E also corresponds to the angle between the polarisation vector of the radiation and the surface normal. The spectra of Fig. 4 show two particularly clear and intense resonance peaks at nominal (uncalibrated) photon energies of ~533 eV and 538 eV that can be identified, on the basis
of previous studies of furan in the gas phase [16, 17], as associated with * and * O-C final state resonances, respectively. Closer inspection of the lower energy feature, however, shows that at normal incidence, when the peak is small, it occurs at an energy of 532.4 eV, whereas at grazing incidence, when it is large, its energy is 533.4 eV. This shift of 1 eV is attributable to the presence of a small amount of coadsorbed CO, the
lower energy being characteristic of the CO * resonance (this energy being found for NEXAFS recorded from the same surface after heating to dissociate the furan, leaving CO as the only oxygen-containing surface species). The apparent shift in energy of the NEXAFS feature occurs because the CO and furan * resonances have essentially opposite dependence on the polarisation angle. For CO, which we might expect to bond with its molecular axis essentially perpendicular to the surface (as it does on Pd(111) in
normal incidence (E-vector parallel to the surface and thus perpendicular to the molecular
axis), while it is clear from Fig. 4 that the furan * resonance has its maximum intensity at grazing incidence. This maximum should correspond to the E-vector lying
perpendicular to the molecular plane, clearly indicating that the molecular plane is approximately parallel to the surface. The behaviour of the * O-C resonance is also consistent with this picture; in this case, the resonance should have its maximum intensity when the E-vector lies within the molecular plane, and experimentally this is seen to
occur at normal incidence when the E-vector lies parallel to the surface.
This orientational information can be rendered more quantitative by exploiting the well-known and simple formulae describing the polarisation-angle dependence of the two types of final state resonance [19, 20], but in order to do so one must extract the relative intensities of the resonance peaks from the NEXAFS data. This involves fitting the individual spectra to a step representing the edge-jump in the atomic photoionisation cross-section, together with a consistent set of peaks representing the various distinct final states. This procedure involves a number of underlying assumptions. First, one must determine the energy of the atomic edge-jump. Here, we assume that the rising edge of
the * resonance peak coincides with this edge-jump, and we also assume that all intensity in the spectra that lies above this edge plateau can be assigned to a series of Gaussian peaks. For the two intramolecular resonances of interest, this is probably reasonable, but this is less clearly appropriate for the remaining intensity, including, for example, at least two peaks, at photon energies of ~545 eV and ~550 eV, that are clearly identifiable in the spectra. The origin of these features is unclear, but can most probably be attributed to final state scattering from Pd atoms, an effect that does not necessarily give rise to discrete peaks of this kind. Fortunately, most of the somewhat arbitrary aspects of this fitting procedure have little effect on the polarisation-angle dependence of the intensity of the two intramolecular resonance peaks of interest. Nevertheless, it is important to bear these issues in mind when assigning a precision to the resulting
in the inset of Fig. 4. This graph includes the results from the NEXAFS spectra shown in
the main figure together with an additional measurement at E=20°. Evidently the
theoretical line corresponding to a molecular plane tilt angle, , out of the surface of 0° gives the best fit, while additional theoretical curves suggest that the precision in this value is ~15°. Similar treatment of the intensity of the *-resonance seems to favour a
slightly larger value of of approximately 20°, but the separation of this component from other features is certainly less reliable.
3.1 Photoelectron diffraction
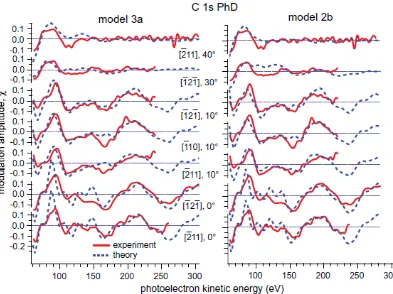
As described in section 2, an extensive set of C 1s PhD spectra were collected in different directions; this comprised a total of 16 such data sets at polar emission angles from 10° to
80°, resulting in separate PhD spectra for the -C and -C emitters in each geometry. In all cases the modulations were weak; most spectra showed modulation amplitudes of less than ±10%. Bearing in mind the low (C2v) symmetry of the furan molecule and its mismatch to that of the substrate (C3v), together with the fact that the interatomic distances within the molecule differ from those in the Pd(111) surface, it is inevitable that the individual C atoms occupy low-symmetry sites on the surface. The PhD spectra therefore comprise an incoherent sum of several symmetrically-equivalent geometries relative to the substrate, and may be expected to show weak modulations. However, very weak modulations present a challenge to both the theoretical description and the experimental reliability, so in our standard methodology for PhD structure determination we regard it as most reliable to concentrate on those spectra that show the strongest modulations, with the caveat that a reasonable range of emission geometries should be included. On this basis our structural analysis is based on a subset of 7 PhD spectra for the -C emitters alone, with polar emission angles in the range from normal emission (where the strongest modulations are seen) to 30°. For these spectra at least some features show a modulation amplitude in excess of 10%. The fact that the strongest modulations
near-180° backscattering from a nearest-neighbour substrate atom. The fact that none of
the -C PhD spectra show even this modest level of modulation amplitude may imply that these atoms are further from high-symmetry sites, or are further from the surface (and thus from the stronger Pd scatterer atoms), or both.
In order to determine the adsorption geometry that is most consistent with the experimental PhD spectra in this low-symmetry adsorption system, a rather exhaustive search of possible sites was explored, using calculations based on a relatively small number of scattering pathways (~600 single scattering, ~200 double scattering and ~100 triple scattering) to reduce the computational time. These calculations are not fully converged, but should reproduce all the main modulation structure. For each site a multiple scattering simulation of the selected experimental PhD spectra was performed and the quality of agreement between theory and experiment judged by the value of an objective reliability- or R-factor, defined as a normalised summation of the squares of the
differences between the experimental and theoretical modulation amplitudes at each point in the spectra [11, 12]. The calculations were performed with computer codes developed by Fritzsche [21, 22, 23] that are based on the expansion of the final state wave-function into a sum over all scattering pathways that the electron can take from the emitter atom to the detector outside the sample.
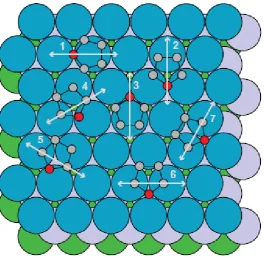
explored in these 'space-scanning' calculations. Notice that structures lying along the displacement lines (2) and (3) correspond to identical locations of the furan molecule relative to the outermost Pd layer, and differ only in the locations relative to the deeper layers. The calculations were therefore also performed on structural models in which both of these locations (equivalent relative to the outermost layer) were assumed to be equally occupied. Similar considerations apply to displacement lines (6) and (7) and to (4) and (5), leading to further double-site-occupation models that were tested. These co-occupation models are similar to the co-co-occupation of ‘fcc’ and hcp’ hollow sites (above third and second layer substrate atoms, respectively) that are known to occur in some adsorption systems including, for example, one phase of CO on Pd(111) [18]. From this wide range of space-scanning calculations, a set of 17 structures corresponding to local minima in the R-factor were identified, and each of these structures was then optimised
by allowing molecular tilting about the -C1--C2 axis while re-optimising the height of the molecule above the surface and adjusting the vibrational amplitudes within physically plausible constraints. Ten of the seventeen possible adsorption geometries then led to R
-factors of 0.22, a value which would generally be regarded as corresponding to good agreement.
Closer inspection of these best-fit structures revealed a rather consistent pattern. In particular, in all cases the two -C emitter atoms occupy sites that are close to atop a nearest-neighbour Pd surface atom. This result is, of course, entirely consistent with our qualitative evaluation of the data which shows the strongest (albeit still quite weak) PhD modulations for near-normal emission directions. Here we should stress, of course, that
as the data we are modelling all involve -C emitter atoms, the structural parameter to which the PhD modulations are most sensitive is the location of these particular atoms relative to the strongly-scattering substrate atoms. In view of this it is not surprising that, of all the lateral displacement lines investigated (fig. 5), only that labelled (1) gave no very low R-factor geometries – moving the molecule along this line of displacement
never places the -C emitter atoms in near-atop sites. With so many different structural solutions falling in a narrow range of low R-factor values, it is clear that other criteria
have applied is to assume that the only symmetry element that can be common to both the molecule and the substrate, namely a mirror plane perpendicular to the surface, is present in the adsorption structure. This assumption is actually implicit in the previously reported DFT calculations [10] for this adsorption system, which only considered geometries with this property. This means that we only need to consider models that lie on the lateral translation lines labelled (1), (2) and (3) in Fig. 5. Note that the actual geometries shown in Fig. 5 on the translation lines (6) and (7) also have the required symmetry, but this is only true in each case for a zero value of the lateral translation; these specific structures are included in the translations sets (2) and (3), respectively. As translations along line (1) give no acceptably low R-factor values, this leaves only structures found on lines (2) and
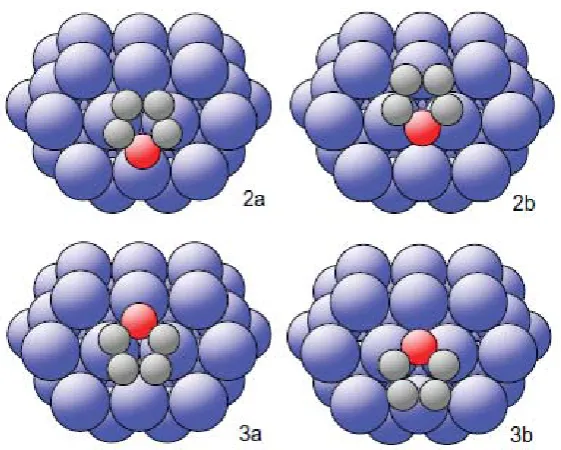
(3). Formally, there are 6 structures of the 17 that fit this constraint, 2 single sites at different displacements along line (2), 2 single sites at different displacements along line (3), and two models involving co-occupation of the pairs of sites that involve equivalent locations relative to fcc and hcp hollows. We label these structural models 2a and 2b, 3a and 3b, and 2a3a and 2b3b, respectively. Each of these models was subjected to re-optimisation using multiple scattering calculations including a substantially larger number of scattering paths, the structural parameters (lateral position, height above the surface, and molecular tilt) and the vibrational amplitudes being modified to obtain the lowest R-factor in each case. Possible adsorbate-induced distortions of the furan molecule
were not considered; the intramolecular scattering (from C and O atoms) is weak, and small variations in the internal geometry are not expected to influence the PhD spectra significantly. Notice that the increase in the number of scattering pathways included in the calculation actually leads to small increases in the lowest R-factor values, but our
confidence in the results of the calculations is increased.
for the two models is similar, consistent with the R-factor values. While all four structures correspond to molecular locations in which the -C emitter atoms are in off-atop sites with almost identical heights and lateral offsets relative to their nearest-neighbour Pd atoms, the structures are closely related in other ways. First, the pairs of structure 2a and 3a, and 2b and 3b, are identical with respect to the outermost layer Pd atoms, and only differ in that in each case one model places the molecule approximately over a fcc hollow site, while the other places the molecule above an hcp site. Not surprisingly, multiple scattering calculations assuming equal occupation of these near-equivalent sites lead to essentially identical values of the structure parameters and R -factors. Furthermore, comparing models 2a and 2b, or 3a and 3b, we see that they differ only in a lateral displacement along a <112> direction, moving the -C emitter atoms from one side of the nearest-neighbour Pd atoms, to the other side. These two positions may be expected to yield closely similar -C emitter C 1s PhD spectra, and the difference in the PhD R-factors does not allow us to make a selection on this basis alone. In order to determine the uniqueness of a solution to a PhD analysis, and to estimate the errors associated with the individual structural parameters (as shown in Table 1) we define a variance in the minimum of the R-factor, Rmin, following an approach developed by
Pendry for LEED [27]. All parameter values giving structures with R-factors less than
Rmin+ Var(Rmin) are regarded as falling within one standard deviation of the ‘best fit’
structure [28]. In the present case the lowest R-factor value is 0.24, but the variance is
0.05, so all the structures of Table 1 are acceptable on the basis of the PhD data analysis alone.
4. General Discussion and Conclusions
almost parallel to the surface, suggesting some involvement of the -electron states of the molecule in the bonding, would reinforce the idea that the location of second layer Pd atoms (and below) is of marginal relevance to the bonding. At each of these two local hollow sites, however, the two different lateral positions of the molecule that are found to be consistent with the PhD data, are more significant. Models 2a and 3a place the O atom of the molecule in an off-atop site (~1.0 Å off-atop), while models 2b and 3b place the O atom close to (less than 0.2 Å from) hollow sites. Clearly this is an important distinction, that might imply significantly different local bonding, and we may ask whether we have any basis for identifying one of these structural models as more probable.
Inspection of the local molecule-substrate bondlengths in Table 1 shows that all four
models involve the same -C-Pd nearest neighbour bondlengths of 2.13±0.03 Å. This is a distance that is certainly consistent with a chemical bond, and is the shortest distance of a surface Pd atom to any atom in the furan molecule. For comparison we note that CO adsorbed on Pd(111) leads to Pd-C bondlengths in the range 2.02-2.10 Å [18, 29, 30] while for C2H2 [31] and C6H6 [30] (coadsorbed with CO) on Pd(111) the comparable bondlengths are 2.02 Å and 2.30 Å, respectively. The optimal values of the
nearest-neighbour Pd bondlengths to the -C atoms are significantly longer, in the range 2.33-2.40 Å, although here the estimated precision is much worse; this is primarily influenced by the molecular tilt angle which is clearly rather imprecise. These longer bondlengths might imply more marginal involvement of the -C atoms in the bonding to the substrate, although they are only slightly larger than those found for benzene on Pd(111), that is also flat-lying and thus essentially -bonded to the surface. It is interesting to note
that all four best-fit structures place the -C atoms in similar sites, off-atop by 0.9-1.0 Å in a local site between the atop and hollow symmetric sites. The similarity of these sites indicates that even had the PhD modulations in the -C 1s emission been sufficient for detailed analysis, the results may well have failed to distinguish the different models. We should also note, however, that the fact that the -C atoms do occupy these
In view of the different O atom sites between the 2a and 2b structures, and between the 3a and 3b structures, we may expect significantly different Pd-O nearest neighbour distances, and this is, indeed, the case. In structures 2a and 3a, with the O atoms in off-atop sites, the Pd-O bondlength is around 2.23 Å, whereas in the 2b and 3b structures, with the O atom close to a hollow site, the bondlength is around 2.42 Å. The only literature value of a Pd-O bondlength in chemisorption systems appears to be for atomic O, and on Pd(111) the value is 1.97 Å [32], but one would certainly expect a larger value for molecular furan. How much larger is difficult to judge, but one might suppose the shorter value associated with the O atom in the off-atop geometry may be more reasonable. Indeed, as the structural results slightly favour a molecular tilt which causes the O atom to move towards the surface, and the -C atoms to be displaced away from the surface, this suggests that the tilt is a consequence of achieving significant local Pd-O bonding, a conclusion that seems to favour the structure with the shorter Pd-O bondlength.
experimental and theoretical values. A similar comparison may be made for the Pd-C
bondlength of the -C atoms: the theoretical values of 2.23, 2.21, 2.28 and 2.17 Å may be compared with the experimental values of 2.36±0.18, 2.33±0.15, 2.40±0.13, and 2.34±0.14 Å. In view of the lower experimental precision, all of these experimental and theoretical values are consistent.
A similar comparison for the Pd-O bondlengths proves more surprising; the theoretical values, in the same order, are 2.43, 2.77, 2.50 and 2.75 Å to be compared with experimental values of 2.22±0.11, 2.43±0.08, 2.25±0.08, and 2.42±0.08 Å. All the theoretical values are 0.2-0.3 Å longer than the experimental values, yet they follow the same trend with longer bondlengths for O in hollow as opposed to off-atop sites. Bearing in mind that the method of deriving these bondlengths is based on entirely different physical principles, this latter aspect of the behaviour is surprising. What is also striking about the Pd-O bondlengths of the DFT calculations, is that the lowest energy structures (models 2b and 3b) are the ones with the longest Pd-O bondlengths with values around 2.75 Å. These calculations actually seem to suggest that the local Pd-O interaction may be repulsive, and this view seems to be confirmed by the finding that, in the DFT minimum-energy structures, the plane defined by the C atoms of the adsorbed furan is almost exactly parallel to the surface, whereas the O atom is buckled out of this plane to occupy a location further from the substrate. Indeed, this effect accounts for the numerical discrepancy between the theoretical and experimental Pd-O bondlengths; our experimental values are derived from the (properly determined) site of the -C atom on the assumption that no such distortion occurs.
In conclusion, our -C 1s PhD study of the adsorption geometry of molecular furan adsorbed on Pd(111) confirms the result of the O K-edge NEXAFS that the molecular plane is close to (within approximately 10° of) parallel to the surface, and identifies four
different equally-possible adsorption sites, all involving the -C atoms in sites
to the four lowest energy adsorption sites found in independent DFT calculations of this
adsorption system in which the -C Pd-C nearest-neighbour bonding distances are in generally good agreement (within 0.00-0.06 Å for the different sites) with the experimental value. These calculations indicate that the hcp and fcc hollow versions of the structures have essentially identical adsorption energies, so co-occupation of the two locally-equivalent sites seem probable. Our results do not, however, allow us to distinguish between the structures with the O atoms in off-atop or near-hollow sites, the DFT calculations favouring the latter structures.
Acknowledgements
Table 1
Optimised structural parameter values and R-factors for the best-fit four single-site
structural models of furan on Pd(111), shown schematically in Fig. 6. z values are
interlayer spacings, d values are nearest-neighbour distances and parameters labelled
off-atop are the lateral displacements parallel to the surface from sites exactly off-atop the
nearest Pd outermost layer atom. is the tilt angle of the molecular plane away from the surface.
parameter model 2a model 2b model 3a model 3b
R-factor 0.27 0.24 0.24 0.25
zPd--C (Å) 2.04±0.03 2.05±0.03 2.05±0.03 2.05±0.03
zPd--C (Å) 2.14±0.20 2.15±0.17 2.14±0.16 2.15±0.15
zPd-O(Å) 1.97±0.13 1.98±0.10 1.99±0.10 1.98±0.10
-C off-atop (Å) 0.63±0.11 0.60±0.07 0.60±0.09 0.59±0.08
-C off-atop (Å) 1.00±0.08 0.90±0.05 1.02±0.08 0.91±0.06 O off-atop (Å) 1.01±0.12 1.40±0.02 1.05±0.10 1.41±0.02
dPd--C (Å) 2.13±0.03 2.13±0.03 2.13±0.03 2.13±0.03
dPd--C (Å) 2.36±0.18 2.33±0.15 2.40±0.13 2.34±0.14
dPd-O (Å) 2.22±0.11 2.43±0.08 2.25±0.08 2.42±0.08
[image:20.595.83.515.286.549.2]Figure Captions
Fig. 4 O K-edge NEXAFS from furan adsorbed at low temperature on Pd(111), at different grazing incidence angles, E. The inset shows the dependence of the intensity of
the furan * resonance extracted from these spectra, as a function of E, compared with
References
1 E. Furimsky, Catal. Rev. Sci. Eng. 25 (1983) 421 2 B. A. Sexton, Surf. Sci. 163 (1985) 99
3 J. L. Solomon, R. J. Madix, J. Stöhr, J. Chem. Phys. 94 (1991) 4012
4 R. M. Ormerod, C. J. Baddeley, C. Hardacre, R. M. Lambert, Surf. Sci. 360 (1996) 1 5 T. E. Caldwell, I. M. Abdelrehim, D. P. Land, J. Am. Chem. Soc. 118 (1996) 907 6 T. E. Caldwell, D. P. Land, J. Phys. Chem. B 103 (1999) 7869
7 D. N. Futaba, S. Chiang, J. Vac. Sci. Technol. A 15 (1997) 1295 8 A. Loui, S. Chiang, Appl. Surf. Sci. 237 (2004) 559
9 V. M. Hallmark, S. Chiang, K.–P. Meinhardt, K. Hafner, Phys. Rev. Lett. 70 (1993) 3740
10 A. Loui, PhD. Thesis, University of California at Davis, 2005 11 D. P. Woodruff, A. M. Bradshaw Rep. Prog. Phys. 57 (1994) 1029 12 D. P. Woodruff, Surf. Sci. Rep. 62 (2007) 1
13 K. J. S. Sawhney, F. Senf, M. Scheer, F. Schäfers, J. Bahrdt, A. Gaupp, W. Gudat, Nucl. Instrum. Methods A 390 (1997) 395
14 T. E. Caldwell, D. P. Land, Polyhedron 16 (1997) 3197
15 A. Sandell, A. Beutler, A. Jaworowski, M. Wiklund, K. Heister, R. Nyholm, J. N. Andersen, Surf. Sci. 415 (1998) 411
16 D. C. Newbury, I. Ishii, A. P.Hitchcock, Can. J. Chem. 64 (1986) 1145
17 D. Duflot, J.–P. Flament, A. Giuliani, J. Heinesch, M.–J. Hubin-Franskin, J. Chem. Phys. 119 (2003) 8946
18 T. Gieel, O. Schaff, C. J. Hirschmugl, V. Fernandez, K.-M. Schindler, A. Theobald, S. Bao, R. Lindsay, W. Berndt, A. M. Bradshaw, C. Baddeley, A. F. Lee, R. M. Lambert, D. P. Woodruff, Surf.Sci. 406 (1998) 90
19 J. Stöhr, R. Jaeger, Phys. Rev. B 26 (1982) 4111
20 J. Stöhr, NEXAFS Spectroscopy, Springer-Verlag, Berlin, 1977.
21 V. Fritzsche, J. Phys.: Condens. Matter 2 (1990) 1413 22 V. Fritzsche, Surf. Sci. 265 (1992) 187
24 F.R. Cordell, J.E.Boggs, J. Mol. Struct. (Theochem) 164 (1988) 175
25 J.S. Kwiatkowski, J. Leszczyński, I. Teca, J. Mol. Struct. 436-437 (1997) 451 26 A. Mellouki, J. Liévin, M. Herman, Chem. Phys. 271 (2001) 239
27 J. B. Pendry, J. Phys.C: Solid State Phys. 13 (1980) 937
28 N. A. Booth, R. Davis, R. Toomes, D. P. Woodruff, C. Hirschmugl, K.-M. Schindler,
O. Schaff, V. Fernandez, A. Theobald, Ph. Hofmann, R. Lindsay, T. Gieel, P. Baumgärtel, A. M. Bradshaw, Surf. Sci. 387 (1997) 152
29 I. Zasada, M. A. Van Hove, Surf. Sci. 457 (2000) L421
30 A. Barbieri, M. A. Van Hove, G. A. Somorjai, Surf. Sci. 306 (1994) 261
31 C. J. Baddeley, A. F. Lee, R. M. Lambert, T. Gieel, O. Schaff, V. Fernandez, K.-M. Schindler, A. Theobald, C. J. Hirschmugl, R. Lindsay, A. M. Bradshaw, D. P. Woodruff, Surf. Sci. 400 (1998) 166