Research Paper
Effects of fuel composition on the economic performance
of biogas-based power generation systems
Hasan Barzegaravval
a,⇑, Seyed Ehsan Hosseini
b, Mazlan Abdul Wahid
a, Aminuddin Saat
a aHigh-Speed Reacting Flow Laboratory, Faculty of Mechanical Engineering, Universiti Teknologi Malaysia, 81310 UTM Skudai, Johor, Malaysia bDepartment of Mechanical Engineering, Arkansas Tech University, 1811N Boulder Ave, Russellville, AR, 72801, USA
h i g h l i g h t s
Exergo-economic analysis of a biogas-based gas turbine with preheater is performed.
Efficiency falls by 0.5% and total cost rate increases by 1% when fuel composition changes.
Different fuel pricing strategies are implemented and results are compared.
Cost of power varies from 0.05 to 0.18$/kWh for different fuel cost and system size.
Economic performance is introduced and evaluated at around 63%.
a r t i c l e
i n f o
Article history: Received 13 March 2017 Revised 15 September 2017 Accepted 21 September 2017 Available online 22 September 2017 Keywords:
Biogas gas turbine Exergy
Economic Fuel composition
a b s t r a c t
Biogas to fuel is an attractive method to reduce global warming potential of methane emission and pro-viding a renewable source of energy. In this study, exergoeconomic assessment of a biogas-based gas tur-bine system with preheater is conducted. In the present work, effects of fuel composition on the exergetic and economic performance of a plant are studied, and comparison between two fuel pricing methods has been carried out. Fuel composition effects have not been studied before and fuel pricing mostly con-ducted in terms of lower heating value (LHV) in previous studies. In this study, percentage of methane content in the fuel is changed. Two definitions for fuel pricing are used, one based on the exergy and the other based on the LHV of the biogas and the results are compared. In addition, the cost factors are defined and the cost of generated power are evaluated. To add more generality to the work, system sizes ranged from 1 to 10 MW is taken into consideration to understand the effect of system size as well. Results reveal that fuel pricing based on the exergy gives more realistic evaluations. Furthermore, when methane content is changed from 0.95 to 0.6, total cost rate of the plant rises around 1% and electricity cost augments. Exergetic efficiency mitigates when methane content reduces. Based on the system size and biogas fuel price, the cost of generated electricity varies from 0.05$/kWh to 0.18$/kWh in this assessment.
Ó2017 Elsevier Ltd. All rights reserved.
1. Introduction
Global warming and energy resources depletion are among main concerns of human beings. Greenhouse gases (GHG) are known responsible for increasing trend of the planets’ temperature globally. Methane (CH4) shows high greenhouse effects, much
higher than carbon dioxide (CO2) and according to International
Panel on Climate Change (IPCC) report [1], its global warming potential is 25 times greater than CO2in mass basis. A significant
source of methane emission is biomass and wastes digested by bacteria’s, especially livestock and agricultural wastes [2,3]. Preventing methane emission from natural sources is crucial in environmental protection and global warming control. One method to reduce the emission impact and eliminate the methane emission is capturing produced methane rich gas mixture, which is called biogas, and utilize it as a source of fuel. Produced gases from anaerobic digestion is a source of CH4. Nevertheless, despite of its
environmental negative effects, this so-called biogas can be a source of green energy. In fact, using biogas as a source of energy has three advantages[4]:
https://doi.org/10.1016/j.applthermaleng.2017.09.109 1359-4311/Ó2017 Elsevier Ltd. All rights reserved.
⇑ Corresponding author.
E-mail address:[email protected](H. Barzegaravval).
Contents lists available atScienceDirect
Applied Thermal Engineering
Biogas is a renewable energy.
Biogas oxidation generate energy and replaces methane with CO2. The latter has much lower greenhouse effect.
Biogas from waste materials, has low net CO2emission since it
produces from natural organic disposals.
Due to aforementioned reasons, biogas utilization for energy generation purposes has attracted attentions. Li, et al.[5], studied the potential of biogas production from livestock wastes and poul-try breeding in rural areas in China and potential of biogas gener-ation and emission reduction were estimated as 20% of natural gas consumption and emission reduces about 220 million tons annu-ally. Uddin et al. [6], investigated the potential of using biogas for power generation in Pakistan and discovered a potential of 35.63 GWh of electricity per day in livestock sector which is enough to overcome the energy crisis in Pakistan. Abdeshahian et al. [7], studied the potential of biogas generation in Malaysia from animal wastes using anaerobic digestion plants and esti-mated that 8.27 TWh electricity per year can be generated. Santos et al.[8]performed economic feasibility study on electricity gener-ation using biogas generated from wastewater treatment facilities in Brazil and concluded that the plan is feasible for cities with pop-ulations greater than 300,000. Rios and Kaltschmitt [9], study showed that average power generation potential of 6.40 TWh could be available in 391 municipalities in Mexico.
1.1. Multigeneration with biogas
To improve the efficiency of various systems, multigeneration energy systems were proposed. Speidel et al. [10] proposed a
new integration system for gasification process coupled with a power generation system. A configuration of sludge fermentation process, solid oxide fuel cell (SOFC) and gas turbine and gasifier was assessed in terms of energy. It was concluded that generated steam by gasification and fermentation, can improve the methane reforming in SOFC and consequently increase the overall plant effi-ciency. Herle et al. [11] investigate a biogas based SOFC small cogeneration system for onsite utilizations. Detailed thermody-namic modeling of fuel cell was implemented and source of biogas was landfill and agricultural waste digestion plant with fixed real composition data. Wongchanapai et al.[12]performed a thermo-dynamic assessment on a solid oxide fuel cell-micro gas turbine combine heat and power (SOFC-MGT CHP) system with detail ther-modynamic modeling of SOFC and parametric study of important parameters was carried out at constant fuel composition (60% CH4 and 40% CO2). Their analysis led to a parametric-optimal
design and minimum system size was achieved when fuel utiliza-tion factor in SOFC was 0.75.
Performance of a cycle can be evaluated by different terms like energy, exergy, economy of the plant and emissions. For biogas multigeneration systems different approaches have been used to study and design the system which are categorized hereafter.
1.2. Economic analysis (based on energy)
Economy of the energy systems are as important as their effi-ciency and environmental performance. Skorek-Osikowska et al.
[13] analyzed an internal combustion engine (IC)-CHP system fueled by biogas (the source was biomass gasifier), technically and economically to evaluate the effect of system size on the heat
Nomenclature _
C cost flow rate ($/s)
Cfactor cost factor (1/s)
_
Ex exergy flow rate (kW) ex exergy (kJ)
_
Exd exergy destruction rate (kW) FP fuel Price ($/GJ)
h enthalpy (kJ)
_
m mass flow rate (kg/s)
M molar mass vector for species in a composition (kg/ kmol)
Mt molar Mass of a composition (kg/kmol)
P pressure (bar) r pressure ratio
R gas constant (kJ/kmol-°K) T temperature (°K)
_
W power or Work (kW)
X carbone dioxide molar concentration in biogas (%) Y molar concentration vector of species in a composition
(%)
Z purchase cost of components ($)
_
Z purchase cost rate of components. ($/s)
Greek letters
a
0 cost factor (change in total cost rate) with fuel pricing inLHV (%)
a
1 cost factor (change in total cost rate) with fuel pricing inTotal Exergy (%)
a
g mass factor (change in mass flow rate of flue gasesin-ters the gas turbine) (%)
a
Z purchase cost factor (change in Total Purchase cost ofcomponents) (%)
b0 ratio of fuel chemical exergy to LHV b1 ratio of fuel total exergy to LHV ratio
g
efficiencyg
eco economic efficiency or performance Subscripts a air CH chemical ex exergetic g flue gases f fuel ph physical Abbreviations AC air Compressor AP air Preheater CC combustion Chamber CHP combined Heat and Power GT gas TurbineIPCC intergovernmental Panel on Climate Change IRR internal Rate of Return
MGT micro Gas Turbine NPV net Present Value
NRCS natural Resources Conservation Service NREL national Renewable Energy Laboratory ORC organic Rankine Cycle
SOFC solid Oxide Fuel Cell TIT turbine Inlet Temperature
and generated power. They concluded that the cost of fuel and green certificates are the most important factors for economic via-bility of the system in terms of net present value (NPV). Kang et al.
[14], analyzed the economy of a CHP plant based on gas turbine using co-firing natural gas and biogas, considering a complete plant includes biogas generator. They concluded that economic of the plant is affected greatly by changes in fuel combination. Pipat-manomai, et al.[15]analyzed an IC-engine power generation sce-nario using pig farm wastes to produce biogas including all processes like hydrogen sulfide (H2S) removal and evaluated
pay-back period as function of electricity cost and governmental sub-sidy plans. Budzianowski and Budzianowska [16] compared pressurized and atmospheric digestion system for biogas produc-tion and biogas upgrading opproduc-tions and cost evaluaproduc-tion of different cases were taken into account. Their results showed that under current policies, pressurized digestion system and conventional CHP systems are more economically attractive. Basrawi et al.[17]
investigated the optimal sizing of a cogeneration plant using eco-nomic and thermodynamic modeling. The source of biogas was a sewage treatment plant in a cold area. They analyzed three sizes of gas turbine including 30, 50 and 200 kW and concluded that NPV of 200 kW case is15% higher than 30 kW case and higher than 50 kW case.
Kang et al.[18]compared CHP and Combined Cycle based on a 5 MW biogas fueled gas turbine, economically. They considered different economic measures and heat demand patterns and selling price. Hourly thermodynamic analysis of systems was conducted with fixed fuel composition and it is concluded that CHP is gener-ally more profitable especigener-ally at high heat demands and prices.
1.3. Off design and optimization
In addition to energy and economy analysis, off design and operation optimization of biogas-based power generation systems were carried out by some researchers. Different approaches for optimization have been proposed like parametric optimization for cycle design[19]or linear programming approach for operation strategy improvement[20]. In addition off design effects on the economy of the plant can be evaluated using methods like partial load[21]to achieve more accurate estimation of energetic and eco-nomic performance of the system.
1.4. Exergetic analysis
Exergy has been proven to be a powerful tool for evaluating the performance of energy systems. Gazda, Stanek[22]assessed a bio-gas fueled combined cooling, heating and power-photovoltaic panel (CCHP-PV) integrated system. Environmental assessment in terms of GHGs emission was carried out and exergetic efficiency of the plant was evaluated. They concluded that exergetic based fuel energy allocation concept is more convenient and useful than energetic method. Farhad, et al.[23]performed exergetic compar-ison on three different system configurations for a SOFC based micro CHP in a residential building with constant fuel composition. Hosseini et al. [24] investigated a gas turbine- organic Rankine cycle (GT-ORC) micro-power generation cycle based on the energy and exergy analyses for various biogas compositions. They carried out a parametric study on various parameters including fuel com-position variations.
In some cases, exergy analysis has been used with economic evaluation of the biogas fueled plants. Performance of the systems are evaluated by exergetic performance and its’ economy is evalu-ated by measures like Internal rate of return (IRR) and produced electricity cost[25,26]. Exergy and economy of the plant can be assessed by exergoeconomic method[27]. This method combines the exergy of flows and cost analysis and provides a value for each
exergy flow. Ozdil and Tantekin[28]analyzed an onsite electricity generation for a wastewater treatment based on exergy economic analysis. A gas engine coupled with gas turbine was used for power generation and the waste heat was recovered and used in waste treatment plant. Their results showed that the cost of fuel in terms of exergy before feeding to the fuel compressor was about 4.88US/ GJ.
1.5. Gas turbine fueled by biogas
Gas turbine is well known prime mover in energy systems including biogas applications. The main challenge for adopting the gas turbine for biogas is the combustion process. Depends on the biogas composition, some modifications are proposed by vari-ous researchers [29,30]. However, in general it has been shown that gas turbines can work with low LHV fuels without any change in design. Nikpey et al.[31,32]experimentally investigated a gas turbine performance fueled by biogas and provided a thermody-namic model to evaluate its off-design operation. Various biogas compositions were tested and it was concluded that a gas turbine with some improvements and tuning can operate over a range of fuel composition.
1.6. Research gap and aims of present study
Based on the best authors’ knowledge, biogas-based power gen-eration systems have been investigated in literatures widely, but in many cases:
The composition of biogas was considered fixed.
Exergy, energy and economy of the plant were modeled separately.
Effects of biogas composition on both systems’ exergetic and economic performance, have not been evaluated.
Comparison between different fuel pricing methods have not been discussed.
There are some researches which cover one of the aforemen-tioned topics but combination of all conditions was not taken into consideration to achieve a general model for biogas-based gas tur-bine system. In this study an exergoeconomic analysis for a biogas-based gas turbine with preheater, with respect to various fuel price and composition is presented. To add generality to the analysis, only the gas turbine has been modeled and it was assumed that biogas is provided through supply line. The effect of various biogas composition and price has been evaluated to cover all possible methods for producing the biogas. Then the price of generated power and total investment are calculated. These data are useful for evaluating the economic measures of the plant.
In summary followings are aims of this study:
To carry exergoeconomic analysis of a biogas fueled system. This analysis provides detailed cost-exergy flows and their cor-relation in the cycle.
To investigate the effect of fuel composition variations on econ-omy and performance of the plant.
To compare different fuel pricing methods to find out the most meaningful and reasonable approach.
1.7. Economic and performance data
Natural resources conservation services (NRCS)[33]along with national renewable energy laboratory (NREL) biogas resource char-acterization report[34]provided a good inside to the biogas pro-duction cost. According to mentioned references, biogas price from anaerobic digestion of livestock manure and wastes varies
from 3 to 28$/GJ depends on the technologies and cases of implementation.
Methane molar or volumetric fraction in biogas is between 0.5 and 0.75 for livestock anaerobic digestion[33]. Since the methane content of biogas is low, in some cases biogas is purified to yield high concentration of methane up to 95 percent near to the same value in natural gas. The product of purification is known as bio methane and the cost of the fuel rises significantly. Economic anal-ysis for a sample case[34]shows that the produced bio methane costs approximately11$/GJ when the cost of feeding stock was
con-sidered 6.95$/GJ. Since both composition and the price may vary widely, a cost analysis of power generation system is necessary to have an inside through the economics of the plant.
2. Methodology
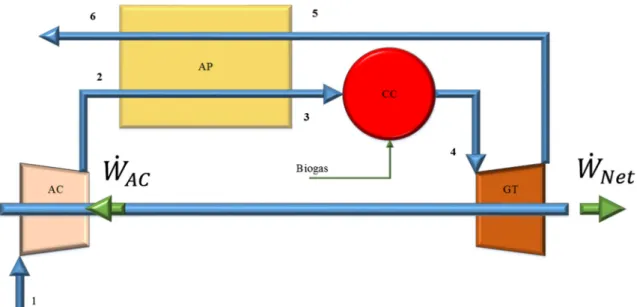
Thermodynamic analysis of a gas turbine cycle at design point is carried out by methodologies presented in literatures[35]. Here a gas turbine with preheater is considered. Diagram of the plant is presented inFig. 1.
Table 1andTable 2summarize equations for modeling gas tur-bine components. In addition, exergy analysis was considered for different components and balance the related equations are pre-sented inTable 3. as well.
2.1. Biogas composition
Since components likes nitrogen are less than 1 percent in trea-ted biogas, for simplicity of analysis methane and carbon dioxide have been considered as the main species of biogas.
Fuel combination has a significant effect on its chemical exergy and heating value. For gases fuel, following formula can be used to evaluate their LHV[36]:
LHV¼LHV!: Y
!
Mt ð17Þ
In whichLHV! is the vector of LHV values for components in the mixture. For chemical exergy of the gas following formulas are used
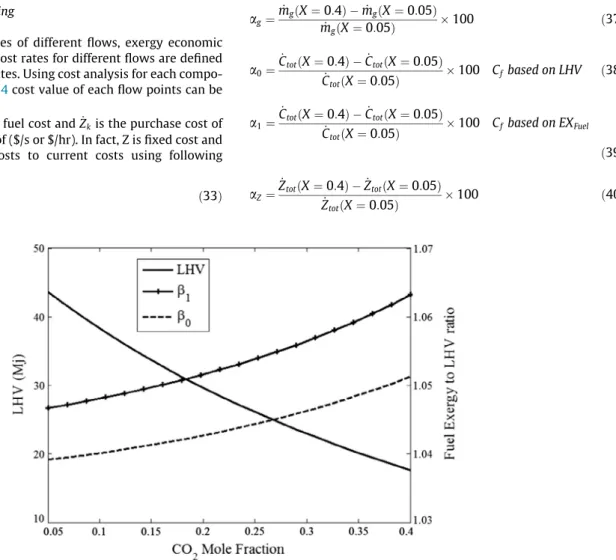
[37]. Physical exergy of the fuel is calculated based on the well-known formula of exergy. We also define the fuel to exergy ratio as follows: exch¼ EXCHþRT0ðY ! :lnY!Þ Mt ð 18Þ EXCH¼EXCH ! :Y! ð19Þ Mt¼M ! :Y! ð20Þ b0¼exch LHV ð21Þ
Fig. 1.Flow diagram of the gas turbine cycle with preheater.
Table 1
Thermodynamic modeling equations for the cycle.
Component Modeling equation
Compressor (AC) Eq. (1&2) W_AC¼ ðh2h1Þm_a ðgAC¼ð h2h1Þis ðh2h1Þr Gas Turbine (GT) Eq. (3&4) W_GT¼ ðh4h5Þm_g gGT¼ððhh44hh55ÞÞris Preheater (AP) Eq. (5) h6h5¼h3h2
Combustor (CC) Eq. (6) m_ah3þm_fðLHVþhfÞgcc¼ ðm_fþm_aÞh4 Net Power Eq. (7&8) W_net¼W_GTW_AC m_g¼m_aþm_f
Table 2
Table of inputs and accessory equations for modeling[35]. Component Inputs and accessory equations Compressor (AC) P1¼1bar T1¼25
C gAC¼:83 rAC¼PP21¼10 Gas Turbine (GT) P4¼:95P3 gGT¼0:87 Preheater (AP) P5¼1:03P6 Combustor (CC) gcc¼0:98 Table 3
Exergy balance equations for components and the system.
Component Exergy equation
Compressor (AC) Ex_ 1þW_AC¼Ex_2þExd_ AC (9)
Preheater (AP) Ex_ 5þEx_ 2¼Ex_ 6þEx_ 3þExd_ AP (10)
Combustor (CC) Ex_ 3þm_fEXFuel¼Ex_ 4þExd_ CC (11)
Gas turbine (GT) Ex_ 4þW_GT¼Ex_ 5þExd_ GT (12)
Power plant (PP) Exd_ total¼Exd_ GTþExd_ CCþExd_ APþExd_ AC
gex¼ W_net _ mfEXFuelor _ Wnet _ mfexch _ Exloss¼Ex_6 (13) (14-16)
EXFuel¼ ðexchþexphÞbiogas ð22Þ
b1¼EXFuel
LHV ð23Þ
Eq.(18)is for calculating chemical exergy of a gaseous fuel mixture. EXCH is the chemical exergy of composition without considering
mixture activity terms and is defined in Eq.(19). EXCHis the vector
of chemical exergy of pure components of the mixture.
Combustion of biogas is simulated considering complete com-bustion assumption which is highly accurate for gas turbines. Com-plete explanation of biogas combustion modeling can be found in ref.[24].
2.2. Exergy economic modeling
To understand the values of different flows, exergy economic analysis is used. Here the cost rates for different flows are defined according to their exergy rates. Using cost analysis for each compo-nent as it is given inTable 4cost value of each flow points can be evaluated.
In this formulaC_f is the fuel cost andZ_kis the purchase cost of
the k component in terms of ($/s or $/hr). In fact, Z is fixed cost and one may convert fixed costs to current costs using following equations:
_
Zk¼ZkCfactor ð33Þ
where,Cfactoris a cost factor which converts a fixed cost value to
cur-rent cost over the component’s life time [39]. In this equation
i= 0.05 is interest rate, n = 20 is number of years which plant is operating, N = 8000 is operating hours per year for the cycle exclud-ing regular overhaul and maintenance (O&M) shutdown hours and
u
¼1:06 is maintenance factor according to[38].Cfactor¼ iðiþ1Þn ðiþ1Þn 1
u
3600N ð34ÞFuel cost is given by following formula:
_
Cf ¼FPLHV
_ mf
106 ð35Þ
In this formula, FP or fuel price is given commonly in terms of ($/GJ) based on LHV of the fuel. In addition, we introduced the FP based on the total exergy of fuel:
_
Cf ¼FPEXFuel
_ mf
106 ð36Þ
Difference between these two definitions is discussed thor-oughly in results and discussion section.
2.3. Mass and cost factors
In this analysis, carbon dioxide mole fraction is varied from 0.05 to 0.4 and its effects on the plant economy and exergetic perfor-mance is evaluated. It is more convenient to define following parameters for presenting results of analysis:
a
g¼ _ mgðX¼0:4Þ m_gðX¼0:05Þ _ mgðX¼0:05Þ 100 ð37Þa
0¼ _ CtotðX¼0:4Þ C_totðX¼0:05Þ _ CtotðX¼0:05Þ 100 Cf based on LHV ð38Þa
1¼ _ CtotðX¼0:4Þ C_totðX¼0:05Þ _CtotðX¼0:05Þ 100 Cfbased on EXFuel ð39Þ
a
Z¼ _ ZtotðX¼0:4Þ Z_totðX¼0:05Þ _ ZtotðX¼0:05Þ 100 ð40Þ Table 4Cost balance equations for plants components[35,38].
Component, Flow point Cost equation Eqs. (24–29)
Point 1, air inlet C_1¼0
Point 2 C_2¼C_WACþZ_AC
Preheater cost balance C_3þC_6¼C_2þC_5þZ_AP
Point 4 C_4¼C_3þC_fþZ_CC
Turbine cost balance C_5þC_WGT¼C_4þZ_GT
Plant C_tot¼C_fþZ_tot
Accessory equations Eqs. (30–32) _ CWGT _ WGT¼ _ CWAC _ WAC _ WGT¼W_netþW_AC _ C6 _ Ex6¼ _ C5 _ Ex5
In these formulas, variations in mass, purchase cost, and the plant total cost due to changes in fuel composition are formulated in non-dimensional parameters. To explain defined variables above, let methane percentage of 95% (X = 0.05), which is almost like the natural gas case, be considered as the base case. Then, we are going to evaluate the percentage of the changes in impor-tant parameters like turbine mass flow rate, plants’ total cost rate, and equipment purchase cost (investment) while methane content is reducing to near 60%. So, we define parameters
a
g;a
0;a
1;anda
zto evaluate this changes in a non-dimensional manner, and in terms of% of changes. Defining this variable provides more gener-ality to the results and the values can be easily implement for any cases as a basic estimation.
2.4. Cost of destruction and cost of exergy loss
In exergy analysis of components and cycles, two basic concepts of exergy loss and exergy destruction are taken into account.
Exergy destruction is due to irreversibility’s inside components or processes. Exergy loss is the exergy of flows which leaves the control volume of the system and are not products. Here, gas flow of air preheater outlet is the system exergy loss. As it was men-tioned before, each exergy flow has its values or its corresponding cost flow. Here the destruction cost and exergy loss for the plant are defined as following equations:
_ CExd¼Exd_ P_ Cin P _ Exin ð41Þ _ Closs¼C_6 ð42Þ
3. Results and discussion
To analysis the biogas based gas turbine cycle, the sole gas tur-bine biogas system was taken into account which means biogas was considered as an input source of energy or exergy to the plant with a specific price.
Biogas feeding pressure should be higher than combustor pres-sure because it is going to be injected into the combustion chamber and burners. This means for low LHV biogas, physical exergy of the fuel is significant and should be taken into account for both exergy and economic analysis. Usually, biogas produced on site and condi-tion of delivering to the gas turbine depends on the biogas produc-tion technology. In general, cost of biogas is estimated in $/GJ and is calculated in terms of fuel energy (LHV). In addition to this com-mon definition we introduce cost of biogas per total exergy of the fuel including biogas physical exergy. InFig. 2chemical and total exergy of the fuel are illustrated as functions of carbon dioxide concentration in the fuel. As methane concentration reduces, LHV reduces as well but chemical and total exergy ratio (exergy/LHV ratio) increase. In addition, calculations show that physical exergy is at least 1 percent of total exergy.
For modeling the gas cycle, the values in Table 2 are used. Power or work output means the net gas turbine output mechan-ical power and it varies from 1 to 10 MW. When fuel composition
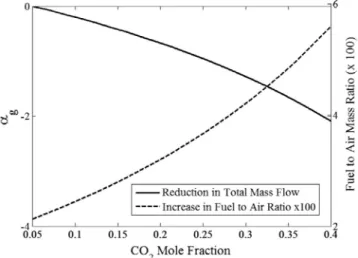
Fig. 3.Fuel to air ratio and mass factor variations. Biogas CO2content increases from 0.05 to 0.4. 0.00 200.00 400.00 600.00 800.00 1000.00 1200.00 1400.00
Compresspr Combustor Gas Turbine Preheater Exergy Loss X=0.05 63.32 1299.47 114.02 102.07 856.80 X=0.4 59.97 1325.54 110.12 102.00 896.31
kW
Exergy Loss and Destruction in Different Components
changes, at fixed turbine inlet temperature (TIT) and output power, the mass flow rate of fuel and air changes. To reach the same tem-perature, the mass flow rate of fuel should increase to achieve the same TIT. In this condition, total mass flow rate of gases through the gas turbine component reduces. There might be a confusing point here since power is kept constant and fuel LHV reduces why does total mass flow rate reduce too? The physical exergy of biogas is in charge for this behavior. As fuel mass flow rate increases, physical exergy of the fuel introduced more and more exergy to the cycle. This means a part of mass flow rate is com-pressed to the same pressure of the air without any air compressor work. So, lower air is required to be compressed for the same amount of output power. In addition, compressor work decreases which means lower value of total gas flow is enough to produce the same amount of power.Fig. 3shows variations in total mass flow rate and fuel to air ratio while methane content in biogas reduces.
Exergetic performance for various components of the cycle is shown in Fig. 4. The amount of exergy loss as well as exergy destruction in different components of the cycle can be seen in this
Fig. Results are in line with previous studies on gas turbine cycle
[25,35]and exergy destruction in combustor is much higher com-pared to the other components. Air compressor has the least value of destruction while gas turbine component is the second largest exergy destructor in the cycle. Exergy loss of the cycle is the amount of flue gases exergy which leaves the boundary of the cycle after exchanging exergy with compressor air in the preheater. Results are for 1 MW power cycle and CO2concentration is varied
from 0.05 (natural gas or bio methane) to 0.4 for biogas. Exergy loss and destruction for high concentration of methane are lower than fuel with 0.6 methane content because of increasing the fuel mass flow rate and exergy to LHV ratio for low concentrations of methane. In preheater, exergy of the exhaust gases increases due to air mass flow rate reduction. When air mass flow rate reduces, lower amount of gases exergy or energy is recovered because tem-perature of air at preheater exit (combustor inlet) is fixed.
Economic and exergetic performance of the cycle are illustrated in Fig. 5. Exergetic efficiency and total cost rate of the plant in terms of ($/hr) is presented here. In this analysis, power output is 1 MW and fuel cost is 10.7$/GJ. The studied cycle was analyzed considering two definitions of fuel cost. The first is cost of fuel which accounted for total exergy and the second is cost of fuel
Fig. 5.gexandC_totfor the plant. This Fig. shows considering fuel physical exergy has significant impact on cost and exergetic performance.
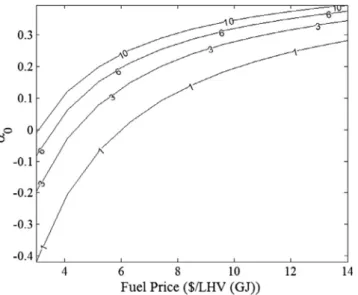
Fig. 6.Cost factora0for different fuel price and net power output.
which accounted for LHV of the biogas. In addition, total and chem-ical exergy of biogas was applied for performance evaluation. When methane concentration reduces, exergy efficiency decreases as well because combustion destruction and exergy loss increases when CO2 concentration rises. Considering total fuel exergy, the
exergy efficiency of the cycle is 0.3 percent lower than exergetic efficiency without considering the physical exergy of the fuel.
In the other hand, cost rate shows a different trend. When methane content falls, fuel flow rate increases, which means higher fuel cost rate. If the fuel cost for unit of fuel exergy (total) is con-sidered the cost would be 8$/hr higher and varies more with fuel composition change.
When the cost per exergy of fuel is considered, in fact the cost of fuel compression process and fuel refining (increase energy density by methane content increment) is taken into account. This means one may pay more for higher quality fuel and higher mass flow rate of high pressurized fuel which is more accurate than fuel pricing in LHV.
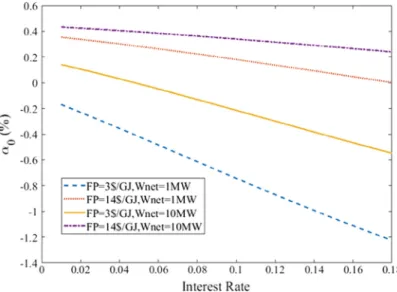
InFig. 6andFig. 7cost factors
a
0anda
1are plotted for differentpower output (system size) and fuel cost. InFig. 6fuel price is con-sidered in terms of fuel LHV and inFig. 7cost of fuel is considered for total exergy of fuel. For low values of fuel
a
0has negative valueswhich means total cost flow rate for lower content of LHV is lower.
As it was mentioned before, for low LHV biogas (low rates of methane concentration), fuel flow rate increases significantly and compressor mass flow rate decrease. This means an amount of free physical exergy is introduced to the system and compressor work which makes the cost value to be reduced. For low fuel costs, this results in negative
a
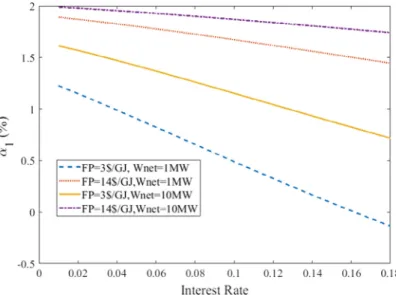
0which means total cost reduces. If the totalexergy of biogas is considered for pricing,
a
1is always positive.This is the more realistic and reasonable result which shows that by the fuel quality reduction for the same cost, plant cost increases. Both
a
0anda
1augment with system size and fuel cost which is aswe expected since fixed and current costs are rising as well. Effect of methane concentration on fixed cost or purchase cost of the plant is demonstrated inFig. 8.
a
gshows how muchinvest-ment cost will decrease due to methane content variations for dif-ferent power outputs. The reason of this cost reduction is that mass flow rate of the system reduces especially in compressor. This results in a smaller system and reduction in components’ size.
Effect of interest rate variations on the cost factors is investi-gated as well. Interest rate variation has no effect on the purchase cost factor. The reason is interest rate is directly correlated in CRF and to the purchase cost so it is eliminated mathematically accord-ing to definition of purchase cost factor.
Variations of
a
0anda
1while interest rate is changing is showninFig. 9andFig. 10respectively. While interest rate increases, total cost rate increases as well since purchase cost or investment rises. This incensement in total cost rate due to purchase cost rising, cause
a
0anda
1to decrease. In fact, while interest rate increases,share of fixed cost (investment) in total cost increasing while cur-rent costs (fuel costs) are constant. In low fuel prices, cost factor is more sensitive to the interest rate because the share of investment cost (purchase cost) in total cost is higher than other cases. Gener-ally, increase in system size and fuel cost reduces the sensitivity of the cost factors to the interest rates, which means in high fuel costs and system sizes, effect of fuel composition on plant total cost is small.
Cost of generated power per kWh is a unique criterion for eval-uating the economic performance of the cycle. It should be noted that costs presented here may differ in various applications since cost analysis inputs and assumptions are not valid for all cases. However, the method presented here is applicable and cost values provides a reasonable estimation for biogas-gas turbine projects. Cost of generated power per kWh for six different cases is shown inFig. 11.
Fig. 8.Purchase cost factor.
For all cases biogas costing based on LHV leads to underestima-tion in generated power cost and the related discrepancy is more significant in higher fuel costs. Another important result is that fuel price is the most dominant cost driver in this case. Cost per unit of kWh of power reduces when system size increases. Cost of power
may vary from 0.05 to 0.18$/kWh when fuel price changes from 3 to 14$/GJ.
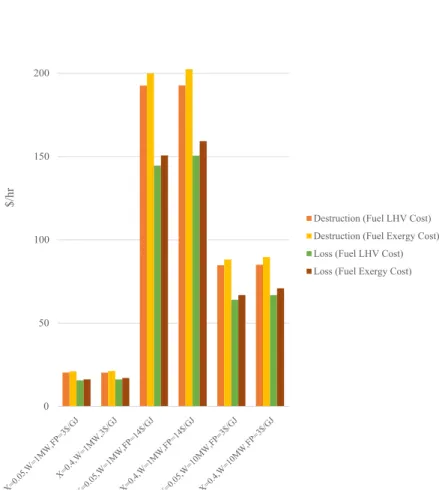
Cost of exergy destruction and losses give more details of eco-nomic performance of the cycle and its components. As presented inFig. 12, destruction and losses are plotted for various cases. In all
Fig. 10.Cost factora1versus interest rate at different fuel price and net power output.
0 0.02 0.04 0.06 0.08 0.1 0.12 0.14 0.16 0.18 0.2 $
Cost of Power Produced per kWh
Fuel LHV COST Fuel Exergy Cost
cases, total destruction cost is higher than loss cost. This is due to the fact that exergy loss is lower than destruction in the cycle under analysis. In addition, cost difference between cost of destruction and energy loss is higher for higher fuel costs and sys-tem size and cost of fuel is the dominant cost driver for destruction and losses too. For both cases exergy based fuel cost leads to higher values than LHV based fuel costs.
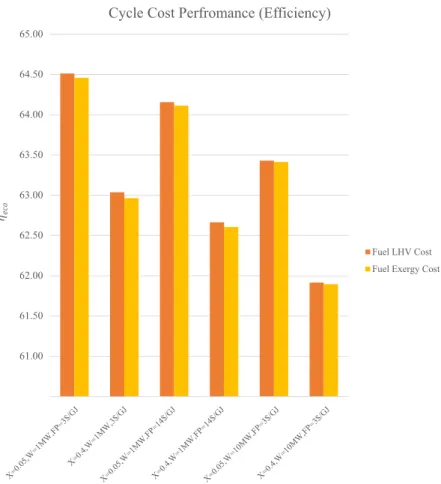
The cycle cost performance is introduced here as an economic measure for the cycle. The cycle economic performance is defined as:
g
eco¼100 1 _ CLoss _ Ctot ! ð43ÞThese parameter shows how much of cost which is introduced to the plant is changed into product and how much money is leav-ing the plant in terms of exergy loss. Since destructions are not leaving the plant, they are not taking into account in this definition. In all cases, performance factor for LHV based fuel price is higher because it introduces a free amount of exergy to the cycle (Fig. 13). For systems with same size and fuel price, economic per-formance of cycles with higher methane content is generally greater than cycles with lower methane content. Moreover, in the bigger system size, the economic performance is lower due to higher value of exergy losses. In fact, lower system size incurs lower value of cost of exergy loss although the cost of power gen-eration per kWh increases.
4. Conclusion
A biogas-based gas turbine power generation system was ana-lyzed using exergo-economic method. Effects of fuel cost, power output (system size) and fuel composition on the exergetic and economic performance of the cycle were studied. Different formula for fuel cost were used and the results were compared. In sum-mary, findings of this study are as follows:
Total mass flow rate of gases decreases by methane content reduction in fuel. However, fuel to air ratio rises from 2% to 6%.
Exergy efficiency of the cycle falls more than 0.5 percent when CO2molar fraction in fuel rises from 0.05 to 0.4.
Physical exergy of the fuel especially in low methane contents of biogas is significantly important and it should be taken into account.
a
0 anda
1 measures show that how different cost definitionslead to different economic outcomes. While
a
0for low costsce-narios shows up to0.5 percent reduction in total cost flow when CO2 content increases from 0.05 to 0.4,
a
1 parametershows that considering total exergy cost always results in pos-itive cost factor which means total cost flow of the plant increases by methane content reduction.
Investment cost of the plant reduced by 4 percent when CO2
content increases from 0.05 to 0.4.
For 1 MW plant, cost of generated power is about 0.05$/kWh and 0.18$/kWh for fuel costs of 3$/GJ and 14$/GJ respectively.
0 50 100 150 200 250 $/hr
Cost of Exergy Destruction and Loss
Destruction (Fuel LHV Cost) Destruction (Fuel Exergy Cost) Loss (Fuel LHV Cost) Loss (Fuel Exergy Cost)
Economic performance factor of the cycle is between 61.5 and 64.5 percent which reduces with system size, fuel cost and CO2content increment in biogas.
In this research fuel composition effects on both performance and economic of the plant is carried out. Total cost and perfor-mance of the plant are significantly affected by the fuel composi-tion variacomposi-tions and these variacomposi-tions should be accounted in the planning and designing phase.
Fuel costing method is another crucial factor that should be considered. Fuel pricing in LHV term specially in low methane con-tents may results in lower cost and higher performance estimation. So, based on results considering fuel pricing method based on exergy is more reasonable and recommended in planning and designing phases.
Method presented here is for design and planning phase. Plant performance maybe affected significantly during operation. So, operation and off design analysis for economic and fuel composi-tion sensitivity will be interesting.
In addition, since multigeneration is a common practice in energy systems, the same method can be implemented for biogas fueled multigeneration systems.
Acknowledgements
The authors would like to thank Ministry of Higher Education Malaysia and Universiti Teknologi Malaysia for supporting this research activity under the Research Grant Schemes of R.J130000.7824.4F749, R.J130000.7824.4F777 and Q.J130000.2524. 17H98.
References
[1] T.F. Stocker, D. Qin, G.-K. Plattner, M.M.B. Tignor, S.K. Allen, J. Boschung, A. Nauels, Y. Xia, V. Bex, P.M. Midgley, Climate Change 2013 the Physical Science Basis: Working Group I Contribution to the Fifth Assessment Report of the Intergovernmental Panel on Climate Change, 2013, doi:10.1017/ CBO9781107415324.
[2] S.E. Hosseini, M.A. Wahid, Utilization of palm solid residue as a source of renewable and sustainable energy in Malaysia, Renew. Sustain. Energy Rev. 40 (2014) 621–632,https://doi.org/10.1016/j.rser.2014.07.214.
[3] S.E. Hosseini, M.A. Wahid, N. Aghili, The scenario of greenhouse gases reduction in Malaysia, Renew. Sustain. Energy Rev. 28 (2013) 400–409, https://doi.org/10.1016/j.rser.2013.08.045.
[4] S.E. Hosseini, M.A. Wahid, Feasibility study of biogas production and utilization as a source of renewable energy in Malaysia, Renew. Sustain. Energy Rev. 19 (2013) 454–462,https://doi.org/10.1016/j.rser.2012.11.008.
[5] F. Li, S. Cheng, H. Yu, D. Yang, Waste from livestock and poultry breeding and its potential assessment of biogas energy in rural China, J. Clean. Prod. 126 (2016) 451–460,https://doi.org/10.1016/j.jclepro.2016.02.104.
[6] W. Uddin, B. Khan, N. Shaukat, M. Majid, G. Mujtaba, A. Mehmood, S.M. Ali, U. Younas, M. Anwar, A.M. Almeshal, Biogas potential for electric power generation in Pakistan: a survey, Renew. Sustain. Energy Rev. 54 (2016) 25– 33,https://doi.org/10.1016/j.rser.2015.09.083.
[7] P. Abdeshahian, J.S. Lim, W.S. Ho, H. Hashim, C.T. Lee, Potential of biogas production from farm animal waste in Malaysia, Renew. Sustain. Energy Rev. 60 (2016) 714–723,https://doi.org/10.1016/j.rser.2016.01.117.
[8] I.F.S. dos Santos, R.M. Barros, G.L. Tiago, Filho, Electricity generation from biogas of anaerobic wastewater treatment plants in Brazil: an assessment of feasibility and potential, J. Clean. Prod. 126 (2016) 504–514,https://doi.org/ 10.1016/j.jclepro.2016.03.072.
[9] M. Rios, M. Kaltschmitt, Electricity generation potential from biogas produced from organic waste in Mexico, Renew. Sustain. Energy Rev. 54 (2016) 384–395, https://doi.org/10.1016/j.rser.2015.10.033.
[10] M. Speidel, G. Kraaij, A. Wörner, A new process concept for highly efficient conversion of sewage sludge by combined fermentation and gasification and power generation in a hybrid system consisting of a SOFC and a gas turbine, Energy Convers. Manage. 98 (2015) 259–267, https://doi.org/10.1016/j. enconman.2015.03.101.
[11] J. Van herle, Y. Membrez, O. Bucheli, Biogas as a fuel source for SOFC co-generators, J. Power Sources 127 (2004) 300–312,https://doi.org/10.1016/j. jpowsour.2003.09.027. 61.00 61.50 62.00 62.50 63.00 63.50 64.00 64.50 65.00
Cycle Cost Perfromance (Efficiency)
Fuel LHV Cost Fuel Exergy Cost
[12] S. Wongchanapai, H. Iwai, M. Saito, H. Yoshida, Performance evaluation of a direct-biogas solid oxide fuel cell-micro gas turbine (SOFC-MGT) hybrid combined heat and power (CHP) system, J. Power Sources 223 (2013) 9–17, https://doi.org/10.1016/j.jpowsour.2012.09.037.
[13] A. Skorek-Osikowska, Ł. Bartela, J. Kotowicz, A. Sobolewski, T. Iluk, L. Remiorz, The influence of the size of the CHP (combined heat and power) system integrated with a biomass fueled gas generator and piston engine on the thermodynamic and economic effectiveness of electricity and heat generation, Energy 67 (2014) 328–340,https://doi.org/10.1016/j.energy.2014.01.015. [14] J.Y. Kang, D.W. Kang, T.S. Kim, K.B. Hur, Economic evaluation of biogas and
natural gas co-firing in gas turbine combined heat and power systems, Appl. Therm. Eng. 70 (2014) 723–731, https://doi.org/10.1016/j. applthermaleng.2014.05.085.
[15] S. Pipatmanomai, S. Kaewluan, T. Vitidsant, Economic assessment of biogas-to-electricity generation system with H2S removal by activated carbon in small pig farm, Appl. Energy 86 (2009) 669–674, https://doi.org/10.1016/j. apenergy.2008.07.007.
[16] W.M. Budzianowski, D.A. Budzianowska, Economic analysis of biomethane and bioelectricity generation from biogas using different support schemes and plant configurations, Energy 88 (2015) 658–666,https://doi.org/10.1016/j. energy.2015.05.104.
[17] F. Basrawi, H. Ibrahim, T. Yamada, Optimal unit sizing of biogas-fuelled micro gas turbine cogeneration systems in a sewage treatment plant, Energy Procedia 75 (2015) 1052–1058,https://doi.org/10.1016/j.egypro.2015.07.468. [18] J.Y. Kang, D.W. Kang, T.S. Kim, K.B. Hur, Comparative economic analysis of gas turbine-based power generation and combined heat and power systems using biogas fuel, Energy 67 (2014) 309–318, https://doi.org/10.1016/j. energy.2014.01.009.
[19] H. Yag˘lı, Y. Koç, A. Koç, A. Görgülü, A. Tandirog˘lu, Parametric optimization and exergetic analysis comparison of subcritical and supercritical organic Rankine cycle (ORC) for biogas fuelled combined heat and power (CHP) engine exhaust gas waste heat, Energy 111 (2016) 923–932, https://doi.org/10.1016/j. energy.2016.05.119.
[20] A. Yechiel, Y. Shevah, Optimization of energy generation using landfill biogas, J. Energy Storage 7 (2016) 93–98,https://doi.org/10.1016/j.est.2016.05.002. [21] C.A. Gibson, M.A. Meybodi, M. Behnia, Investigation of a gas turbine CHP
system under the carbon price in Australia considering natural gas and biogas fuels, Appl. Therm. Eng. 68 (2014) 26–35, https://doi.org/10.1016/j. applthermaleng.2014.04.002.
[22] W. Gazda, W. Stanek, Energy and environmental assessment of integrated biogas trigeneration and photovoltaic plant as more sustainable industrial system, Appl. Energy. 169 (2016) 138–149, https://doi.org/10.1016/j. apenergy.2016.02.037.
[23] S. Farhad, F. Hamdullahpur, Y. Yoo, Performance evaluation of different configurations of biogas-fuelled SOFC micro-CHP systems for residential applications, Int. J. Hydrogen Energy 35 (2010) 3758–3768,https://doi.org/ 10.1016/j.ijhydene.2010.01.052.
[24] S.E. Hosseini, H. Barzegaravval, M.A. Wahid, A. Ganjehkaviri, M.M. Sies, Thermodynamic assessment of integrated biogas-based micro-power
generation system, Energy Convers. Manage. 128 (2016) 104–119,https:// doi.org/10.1016/j.enconman.2016.09.064.
[25] N.S. Siefert, S. Litster, Exergy & economic analysis of biogas fueled solid oxide fuel cell systems, J. Power Sources 272 (2014) 386–397, https://doi.org/ 10.1016/j.jpowsour.2014.08.044.
[26] B. Wu, X. Zhang, D. Shang, D. Bao, S. Zhang, T. Zheng, Energetic-environmental-economic assessment of the biogas system with three utilization pathways: combined heat and power, biomethane and fuel cell, Bioresour. Technol. 214 (2016) 722–728,https://doi.org/10.1016/j.biortech.2016.05.026.
[27] A. Colmenar-Santos, G. Zarzuelo-Puch, D. Borge-Diez, C. García-Diéguez, Thermodynamic and exergoeconomic analysis of energy recovery system of biogas from a wastewater treatment plant and use in a Stirling engine, Renew. Energy 88 (2016) 171–184,https://doi.org/10.1016/j.renene.2015.11.001. [28] N.F. Tumen Ozdil, A. Tantekin, Exergy and exergoeconomic assessments of an
electricity production system in a running wastewater treatment plant, Renew. Energy 97 (2016) 390–398, https://doi.org/10.1016/j. renene.2016.05.039.
[29] K.A. Al-attab, Z.A. Zainal, Performance of a biomass fueled two-stage micro gas turbine (MGT) system with hot air production heat recovery unit, Appl. Therm. Eng. 70 (2014) 61–70,https://doi.org/10.1016/j.applthermaleng.2014.04.030. [30] S.E. Hosseini, M.A. Wahid, Development of biogas combustion in combined
heat and power generation, Renew. Sustain. Energy Rev. 40 (2014) 868–875, https://doi.org/10.1016/j.rser.2014.07.204.
[31] H.N. Somehsaraei, M.M. Majoumerd, P. Breuhaus, M. Assadi, Performance analysis of a biogas-fueled micro gas turbine using a validated thermodynamic model, Appl. Therm. Eng. 66 (2014) 181–190, https://doi.org/10.1016/j. applthermaleng.2014.02.010.
[32] H. Nikpey, M. Assadi, P. Breuhaus, P.T. Mørkved, Experimental evaluation and ANN modeling of a recuperative micro gas turbine burning mixtures of natural gas and biogas, Appl. Energy 117 (2014) 30–41,https://doi.org/10.1016/j. apenergy.2013.11.074.
[33] J. Beddoes, K. Bracmort, R. Burns, W. Lazarus, An Analysis of Energy Production Costs from Anaerobic Digestion Systems on US Livestock Production Facilities, USDA NRCS Tech Note, 2007.
[34]A. Jalalzadeh-Azar, G. Saur, A. Lopez, Biogas Resou. Charact. (2010). [35] H. Barzegar Avval, P. Ahmadi, A.R. Ghaffarizadeh, M.H. Saidi,
Thermo-economic-environmental multiobjective optimization of a gas turbine power plant with preheater using evolutionary algorithm, Int. J. Energy Res. 35 (2011),https://doi.org/10.1002/er.1696.
[36] ISO 6976:2016 - Natural Gas – Calculation of Calorific Values, Density, Relative Density and Wobbe Indices from Composition, n.d.
[37] Y. Zhang, B. Li, H. Li, B. Zhang, Exergy analysis of biomass utilization via steam gasification and partial oxidation, Thermochim. Acta 538 (2012) 21–28, https://doi.org/10.1016/j.tca.2012.03.013.
[38]A. Bejan, G. Tsatsaronis, Thermal Design and Optimization, John Wiley & Sons, 1996.
[39] A. Valero, M.A. Lozano, L. Serra, G. Tsatsaronis, J. Pisa, C. Frangopoulos, M.R. von Spakovsky, CGAM problem: definition and conventional solution, Energy 19 (1994) 279–286,https://doi.org/10.1016/0360-5442(94)90112-0.