Analysis of Wheat Yield Gap and Variability in Ethiopia
Fisseha Zegeye*PhD Candidate, Center for Rural Development, College of Development Studies, Addis Ababa University, Addis Ababa, Ethiopia
Bamlaku Alamirew, PhD
Associate Professor at Center for Rural Development, College of Development Studies, Addis Ababa University, Addis Ababa, Ethiopia
Degefa Tolossa, PhD
Professor of Geography and Development Studies at Center for Rural Development, College of Development Studies, Addis Ababa University, Addis Ababa, Ethiopia
Abstract
Wheat is among important cereal crops to ensuring food and nutrition security in developing countries like Ethiopia. The demand for wheat is projected as significantly increases mainly due to a rapidly population growth in the countries. Globally, wheat yield must grow at least by 1.6%. Whereas, in Ethiopia, the yield must grow from the current level 4.6 million tons to 10 million tons. This paper hence, presents the analysis of wheat yield and the underlying causes of its variability among farmers across major wheat growing areas of the country. Data was used from the farm-household survey conducted in 2014/15 by EIAR in collaboration with CIMMYT. Supplementary secondary data on wheat area, production and consumption, and available wheat varieties were used from CSA and MoARD. Data were analyzed using various techniques (including descriptive, inferential statistics and regression analysis). One way ANOVA was used to analyze the yield variability; whereas Weighted Least Square method was applied to identify the underlying causes for the variability of wheat yield among farmers. The result indicates that the average wheat production level per hectare (2.7 tons/ha) has been on the increase with inter annual variability, but the yield level is very low as compared to that of the research station (6-7 tons/ha) and the estimated average potential (5 tons/ha) in highland areas of the country. The yield gap analysis shows that 61%, 55% and 46% of wheat yield gap existed when the national average yield was compared with that of the actual yield at research station, farmers’ plot and potential yield at highland part of the country, respectively. The empirical analysis found there is statistically significant level of yield variability among wheat growers. The findings of the study revealed that use of improved technologies and production inputs, household assets, support services, and agro-ecologies were the primary factors that cause wheat yield variation in Ethiopia. It is recommended that site-specific wheat production management, technology requirement map, proper institutional support services and sustainable natural resource management following inter and intra-farm/plot variability. Keywords: Wheat, yield gap, yield variability, wheat growing areas, Ethiopia
DOI: 10.7176/JBAH/10-9-05 Publication date:May 31st 2020 1. Introduction
The current world population of 7.3 billion is also expected to reach 8.5 billion by 2030, 9.7 billion in 2050 and 11.2 billion in 2100 (UN, 2015). Estimates show that feeding a world population of 9.1 billion people by 2050 would require raising overall food production by some 70 percent between 2005/07 and 2050 (FAO, 2009). The same source further indicates production in the developing countries would need to almost double. However, the rapid population growth and declining per capita farm sizes together with the recent adverse effects of climate change in developing countries has impacted the overall agriculture and the ability of smallholder farmers to feed themselves and their families let alone to supply the market (Josephson, et al., 2014). If this rapid population growth continues and agricultural productivity rises slowly in developing countries, hence, food and nutrition insecurity, poverty and underemployment will be more pronounced in the coming years (Snodgrass, 2014).
Tackling the challenges and producing more food in developing countries requires not only increasing the amount but also suggests significant increases in the production of several key commodities. The annual cereal production, for instance, would have to grow by almost one billion tones (FAO, 2009). With a world population of 9.1 billion in 2050, of the cereals, wheat demand is expected to increase by 60%. To meet the demand, annual wheat yield increases must grow from the current level of below 1% to at least 1.6% (Initiative:, 2015).
Wheat is one of the main staple crops in the world and the second most important food crop in developing countries after rice (Initiative:, 2015). Wheat is considered as one of the major strategic crops next maize to address food insecurity and the growing food demand in Ethiopia. Based on its role in the population’s caloric intake,
wheat is the second most important food in the country following maize (Gashaw & Bernard, 2017). Literature show that, of the total daily calorie consumption, four major cereals (maize, teff, wheat, and sorghum) account for more than 60%, with maize and wheat representing 20% each (Diao, 2010) (Rashid, 2010).
Despite the importance attached to wheat in addressing food insecurity problems and input for agro-industries, the country is still importing high amount of wheat every year (STAT, 2014). Wheat import has grown significantly over the past decade by an average of 6.6 percent (Samuel, et al., 2017). In 2013/14, Ethiopia imported 1.39 million metric ton, which is about 34 percent of the domestic production and above 160 percent of the marketed wheat in the country (Minot, et al., 2015). A range of factors contributing for wheat demand growth in the future that include population growth, expansion of agro-processors, urbanization, and increasing household income (Samuel, et al., 2017).
To improve the production and productivity of wheat, the Government of Ethiopia has adopted Wheat Sector Development Strategy. The strategy has given high priority for the release of high yielding and disease-resistant improved wheat varieties through building the capacity of wheat breeding program. Research system has been able to make more than 100 high yielding, high quality, rust-resistant bread and durum wheat varieties available along with their production packages suitable for different agro-ecologies (Fentahun, et al., 2017).
In spite of the extensive technology generation and dissemination efforts, yields of major crops are still low suggesting the county has not fully taped the benefits of the investments made on agricultural technology generation and dissemination efforts (Chilot & Dawit, 2016). A study (Chilot, et al., 2013) estimated that 63% of the sample households found to have adopted improved wheat varieties on 52.8% of wheat plots across the country. Adoption estimates of improved wheat varieties based on the 2013 study of tracking wheat varietal adoption using DNA finger printing revealed about 96% of the respondents cultivating improved wheat varieties (Chilot, et al., 2016). The results revealed that the household survey underestimated the economic importance of improved varieties in the wheat sector by about 33 percentage points (Chilot & Dawit, 2016).
Despite high level of adoption of wheat varieties, yield of the majority of wheat producing farmers is 2.7 ton/ha (CSA, 2004/05-2018) by far less than the yield attained at the research stations and on farm, that is 7 ton/ha and 6 ton/ha, respectively (MoARD, 1953-2016). This indicates that the yield of most crops on farmers’ plots is close to thrice and twice lower than that of wheat yield at research stations and on farm, respectively. This is also by far lower than that of the global standards and surpassed by two North African countries, Egypt, and Morocco, with more than 7 million tons each, and 27 other countries (Minot, et al., 2015).
In relation to this, various studies focused on technology adoption on improved seeds and chemical fertilizers while very few considered adoption of interrelated sustainable agricultural practices (SAPs) (Chilot & Dawit, 2016). Some studies were also conducted to estimate the yield gap and assess its determinants in Ethiopia using crop modeling and a small area integrated data approach (Schneider & Anderson, 2010) (Mann & Warner, 2015). The two studies used the maximum farmer yields as a proxy for yield potential and assess the yield gap by calculating the difference between farmers’ actual yields and potential yields. The departure of this research is that comparisons are not made just between farmers’ actual and potential yields. Rather, yields obtained from national average, research station, on farm, highland potential and model farmers are used to assess the yield gap. Hence, this study presents the results of wheat yield gap analysis and the underline causes for yield variability using both national available data and household level survey data.
Against the backdrop of the fore-noted problems, the research sets out to investigate the following: look at the level of wheat yield gap and variability among farmers across major wheat growing areas of the country; explore underlying causes for wheat yield variability, and the possible way to fill the yield gap and smooth the yield variability to meeting the growing wheat demand taking the country’s population growth in to consideration. 2. Materials and Methods
2.1. Data and sources
Data for the study were drawn from both primary and secondary sources. The primary data was obtained from the farm-household survey conducted during 2014/15 by the Ethiopian Institute of Agricultural Research (EIAR) in collaboration with the International Maize and Wheat Improvement Center (CIMMYT). The original data was collected with a purpose of wheat technology adoption analysis and its impacts on smallholder producers. The sampling frame covered seven major wheat-growing agro-ecological zones that account for over 85% of the national wheat area and production distributed in four major administrative regions (Oromia, Amhara, SNNP and Tigray) of Ethiopia. A total of 2017 farm households in seven agro-ecological zones, in 26 zones (provinces), 61 woredas (districts) and 122 kebeles were considered for questionnaire survey. Wheat growers were taken from the data set and their production characteristics were considered for the analysis suiting this paper.
A multi-stage stratified sampling procedure was employed to select villages from each agro-ecology, and households from each kebele /village. First, agro-ecological zones that account for at least 3% of the national wheat area each were selected from all the major wheat growing Regional States of Ethiopia: Amhara, Oromia, Tigray, and Southern Nations Nationalities and Peoples (SNNP). Second, based on proportionate random sampling,
up to 21 villages in each agro-ecology, and 15–18 farm households in each village were randomly selected. The data was collected using a pre-tested structured questionnaire by trained and experienced enumerators who have good knowledge of the farming systems and speak the local language.
Secondary data were gathered from specific studies carried out in Ethiopia, CSA (2004/05-2017/18) mainly on area, production, improved seed, fertilizer, and chemical utilization of wheat growers in major growing regions (Oromia, Amhara, SNNP and Tigray). Other policy documents and available data were obtained from Ethiopian Institute of Agricultural Research (EIAR), Ministry of Agricultural and Livestock Resources (MoALR).
2.2. Data Analysis Methods
2.2.1.Yield gap analysis
The available data on the national average wheat yield were taken from CSA (2017/18), whereas average wheat yield on research station and farmers’ plot were obtained from variety register book of MoALR (2016). Furthermore, the average wheat yield of the surveyed household and the potential wheat yield in highland areas of the country were captured form the EIAR/CIMMYT primary data and Agricultural Transformation Agency Study document, respectively.
The yield gap was calculated using highland, research station yield, on farm yield, and finally the overall yield gap index was calculated.
Highland potential yield gap = Highland potential yield ( ) – National average yield ( ) On research station yield gap= On research potential yield ( ) – National average yield ( ) On farm plot yield gap = On farm potential yield ( ) – National average yield ( )
Model farmers’ yield gap = Model farmers’ yield – National average yield ( )
= − 100
Where, is index for yield gap, is highland potential yield, is national average of wheat yield, respectively.
2.2.2. Yield variability analysis
One way ANOVA method of data analysis was applied to assess the yield variation among wheat growers in Oromia, Amhara, SNNP and Tigray regions.
2.2.3. Determinants of observed yield variation
Ordinary Least Square (OLS) method of data analysis was used to analyze factors that determine the variability of wheat among the growers in the major wheat growing areas. The test statistics were computed using Stata 14.2.
Ordinary Least Square (OLS) method of statistical analysis was used to analyze factors determining wheat yield variation among wheat growing farmers. Mathematically, the linear model fitted by OLS is expressed as:
y = β° + β!x!+ β#x#… β%x%+ ε --- (1)
Where, y is the dependent variable, β° is the intercept, β!, β#,…β% are the coefficients (slop) of independent variable x (x1, x2,…xn); and ε is the deviation of the point from the regression line that is error term.
Prior to entering the variables into regression analysis, the OLS assumptions were tested and checked. Accordingly, normality test of the model indicted that the error term is not normally distributed, such that the P-value for t-tests and F-test will not be valid. So that the log transformation of the dependent variable was used to estimate the coefficients. The linearity test of the model also indicated that the calculated F values are less than the corresponding critical values of F, implying the model is appropriate for the analysis. Following (Gujarati, 2004), multicollinearity problem for explanatory variables was assessed using a technique of Variance Inflation Factor (VIF) and Tolerance Level (TOL) where each continuous explanatory variable is regressed on all the other continuous explanatory variables and coefficient of determination is computed. And the result found that there was no multicollinearity among the independent variables as the value of VIF of a variable is not exceeds 10 and TOL value approaches to one. The heteroscedasticity test is done using Breusch-Pagan/Cook-Weisberg test. Accordingly, the test detected the existence of heteroscedasticity. So, Weighted Least Square (WLS) was applied to convert the regression equation with heteroscedasticity into homoscedasticity.
2.3. Definition of explanatory variables
Table 1 depicts the possible explanation of independent variables. Each variable, description, type of variable, and assumed direction of relationships with the dependent variable are depicted.
Table1: Summary of definition of explanatory variable
Variable Description Type
Expected Sign Production input and out put
WHEATYIELD Wheat yield (kg/ha) C*
SEED Seed use in kg/ha C +
DAP DAP fertilizer use in kg/ha C +
UREA UREA fertilizer use in kg/ha C +
PESTHA Pesticide use in lit/ha C +
HERBHA Herbicide use in lit/ha C +
LABOR Man days used per ha C +
OXEN Oxen days used C +
Soil fertility status (Reference poor)
SOILFERG Dummy: Soil fertility if soil fertility is good in status=1 D* + SOILFERM Dummy: Soil fertility if soil fertility is medium in
status=1
D -
Household characteristics
HHSEX Sex of the HH head (1 = Male, 0 = Female D -
HHEDU Educational level of household head in years C +
MODFR Being model farmer (1 =Yes, 0 = No) D -
HHEXP Wheat growing experience in years C +/-
Resource, institutional support service
EXTN Frequency of extension contact a farmer has with extension agent
C +
DSTMKT Walking distance to village market from residence (min) C - DSTSEED Walking distance to input market from residence (min) C - TLU Livestock holding size in Tropical Livestock Unit (TLU) C +
CREDIT Participation in credit program (1=Yes, 0=No) D +
MEMBINST Participation in formal and informal organization (1=Yes, 0=No)
D +
Regions (Reference=Amhara Region)
Tigray Dummy: Farmers in Tigray region=1 D +/-
SNNP Dummy: Farmers in SNNP region=1 D +/-
Oromia Dummy: Farmers in Oromia region=1 D +/-
Agro-ecology (reference=cool humid mid highlands) Tepid semi-arid mid
highlands
Dummy: Farmer is in Tepid semi-arid mid highlands=1 D +/- Tepid humid and
sub-humid mid highland
Dummy: Farmer is in Tepid humid and sub-humid mid highland=1
D +/-
Tepid moist & sub-moist mid-highland
Dummy: Farmer is in Warm moist and sub-moist lowlands=1
D +/-
Cool moist and sub-moist mid highlands
Dummy: Farmer is in Tepid moist and sub-moist mid-highland=1
D +/-
Warm sub humid lowland
Dummy: Farmer is in Cool moist and sub-moist mid highlands=1
D +/-
Source: Authors’ construction based on data from EIAR/CIMMYT (2014/15) C*=for continuous and D*=for dummy variables
3. Result and Discussion
3.1. Importance of wheat in Ethiopia
Ethiopia is the second largest wheat producing country in Africa behind South Africa (Fentahun, et al., 2017) (Abu, 2013). It is mainly grown in the highlands of Ethiopia, and the two main wheat-producing regions (Oromia and Amhara) account for about 85 percent of the national wheat production (CSA, 2004/05-2018). Wheat is mainly grown in the central and southeastern highlands whereby Arsi, Bale, and parts of Shoa are considered to be the major wheat producing regions of Ethiopia and are also identified as the main wheat-growing belt of East Africa (Abu, 2013) (Bekele, et al., 2000).
Wheat is one of major cereal crops in terms of the area of land allocated, volume produced and the number of farmers engaged in its production (CSA, 2004/05-2018). It ranks fourth in area coverage next to teff, maize and sorghum, Out of the total grain crop area, 80.8% was under cereals and wheat took up 13.3% of the grain crop
area. Moreover, about 4.7 million farmers produce 42.3 million tons of wheat across 1.6 million hectares of land with average productivity of 2.7 t/ha (CSA, 2004/05-2018). So as to assist wheat producing farmers with improved technologies, the wheat research system has been working to generate yield enhancing improved varieties along with their full production packages over the last couple of decades.
3.2. Wheat research system in Ethiopia
The wheat research system in Ethiopia consists of the federal research centers, the regional research centers, and higher learning institutes, who are directly engaged in the wheat technology generation and indirectly support the wheat research system. Kulumsa Agricultural Research center of Ethiopian Institute of Agricultural Research (EIAR) is mandated to coordinate wheat research nationally and serve as Wheat Center of Excellence for East Africa (Ethiopia, Kenya, Uganda, and Tanzania). The Centre was established in 1966 by the government of Ethiopia and the Swedish International Development Agency (SIDA).
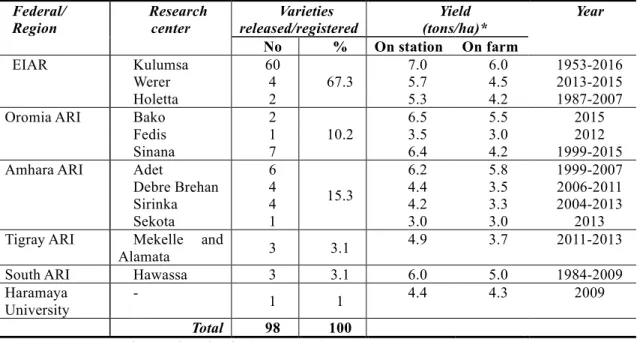
Although Kulumsa agricultural research center is mandated to coordinate the national wheat research program, research centers of regional agricultural research institutes undertake wheat research activities in partnership with Kulumsa agricultural research center and International Wheat Research Centers (CIMMYT, ICARDA, etc.). Federal, Oromia Agricultural Research Institute (OARI), Amhara Regional Agricultural Research Institute (ARARI), Tigray Agricultural Research Institute (TARI), South Agricultural Research Institute (SARI) and Haramaya University (HU) were released and registered bread wheat varieties (Table 2). Of the released varieties, the majority of the varieties (67.3%) were released/registered by Kulumsa Agricultural Research centers.
Table 2: Bread wheat variety development by federal and regional research centers.
Federal/ Region Research center Varieties released/registered Yield (tons/ha)* Year No % On station On farm EIAR Kulumsa 60 67.3 7.0 6.0 1953-2016 Werer 4 5.7 4.5 2013-2015 Holetta 2 5.3 4.2 1987-2007
Oromia ARI Bako 2
10.2
6.5 5.5 2015
Fedis 1 3.5 3.0 2012
Sinana 7 6.4 4.2 1999-2015
Amhara ARI Adet 6
15.3
6.2 5.8 1999-2007
Debre Brehan 4 4.4 3.5 2006-2011
Sirinka 4 4.2 3.3 2004-2013
Sekota 1 3.0 3.0 2013
Tigray ARI Mekelle and
Alamata 3 3.1
4.9 3.7 2011-2013
South ARI Hawassa 3 3.1 6.0 5.0 1984-2009
Haramaya University
-
1 1 4.4 4.3 2009
Total 98 100 Source: MoALR Variety register books (1953-2016)
* The maximum yield achieved among the varieties (tons/ha)
As presented in Table 3, over the last decades, about 138 improved varieties of wheat were generated from the research system. Of these varieties, 71% were Bread wheat. Moreover, more alternative wheat varieties were generated in recent years (1991-2017) (Table 3). Wheat research system achieved maximum yield of 7 tons/ha and 6 tons/ha on research and on farm, respectively. As literature noted that these varieties are high yielding, high quality, and rust resistant varieties available along with their production packages suitable for different agro-ecologies (Fentahun, et al., 2017).
Table 3: Type and number of wheat varieties
Types Imperial period (1930-1974) N/% Derg Regime (1974-1991) N/% EPRDF Regime (1991-2017) N/% Sub Total N/% Yield (tons/ha)* Varieties considered for the paper On station On farm
Bread wheat 14/14.3 13/13.3 71/72.4 98/100 4.4 - 7 3.8 - 6 Hulluka
Durum wheat 2/5 4/10 34/85 40/100 4.4 - 6 3 - 4.2 Toltu
Total 16/11.6 17/12.3 105/76.1 138/100 - - -
Source: MoALR Variety register books (1953-2016)
3.3. Input suppliers for wheat production
Improved seed: In improved seed supply system, the federal and regional wheat research centers are responsible to produce and supply the required amount of initial source seed at pre-basic and basic seed level to federal and regional seed multiplication enterprises (Ethiopian Agricultural Works Organization, Oromia, Amhara, and South Seed Enterprise). The Seed enterprises then multiply and dispatch the basic and certified seeds to end consumers through unions and direct seed marketing.
Seed Enterprises supply certified seed as per the prior demand to their registered distributors (Zewdie, et al., 2016). However, challenges in the system, such as lack of basic seed and reliable demand for some seed variety due to mismatching demand report were reported. Limited availability of wheat seed, variable seed quality, and farmers are cash-constrained and are sometimes unable to purchase inputs even if they would be profitable are constraint to the purchase of improved seed (Minot, et al., 2015). Farmers claimed low seed quality supply (i.e., poor cleaning, low germination rate, and mixed seeds) and ineffective and inefficient coordination to ensure that the varieties distributed are matching to farmer’s demand (Zewdie, et al., 2016). Overall, as the same source indicated that Ethiopia still does not have sufficient seed multiplication facilities, and therefore farmers still use low quality seeds (Zewdie, et al., 2016).
Fertilizers: Wheat is the second-most intensively fertilized cereal crop after maize. The application rate among wheat plots that are fertilized is 138 kg/ha, having increased from 108 kg/ha ten years before (Minot, et al., 2015). Another source indicated that in 2015, about 68 percent of wheat growers applied fertilizers on 1.68 million hectares or 73.4 percent of wheat acreage but often with sub-optimal amount (Samuel, et al., 2017). Before the establishment of Ethiopian Agricultural Businesses Corporation on December 2015, Ministry of Agriculture and Livestock Resources (MoANR) in collaboration with Agricultural Inputs Supply Enterprise (AISE) had imported fertilizer to Ethiopia. Now fertilizer import is the sole responsibility of Ethiopian Agricultural Businesses Corporation.
Pesticides and herbicides: Efforts have been made and intensive research conducted to develop rust resistant wheat seed varieties in collaboration with international research agencies (Zewdie, et al., 2016). Historically, the country has got used to suffer rust disease epidemics and recurrence over the last 4 decades that forced it to abandon one or more of its improved varieties in each decade or less (Fentahun, et al., 2017). Yellow rust and stem rust have become serious problems to the wheat sector are particularly worrisome given that Ethiopia spends just 0.2 percent of its agricultural gross domestic product on agricultural research (Minot, et al., 2015). Along with developing and generating rust resistance varieties to replace those wheat varieties, which are wiped out by the diseases, the research system has contributed by undertaking various confined trials to test those chemicals requested to be imported from abroad. A larger share of wheat receives chemicals than any other cereal crops, for instance pesticides are applied to almost half (47 percent) of the wheat area in Ethiopia, and farmers apply pesticides to a significant portion of teff and barley areas (39 and 23 percent, respectively), but pesticide use on maize and sorghum remains rare (Minot, et al., 2015). Input suppliers import inputs such as chemicals, equipment, pesticides and herbicides from Germany and China, and supply them to unions, small wholesalers and retailers and even smaller retail shops that sell herbicides, pesticides and other chemicals to farmers (Zewdie, et al., 2016).
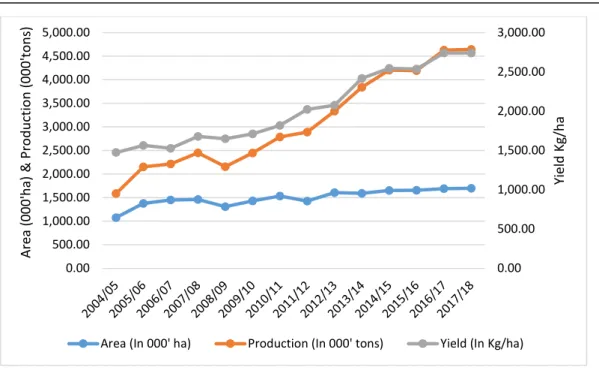
3.4. Growth trend of wheat production in Ethiopia
Figure 2 depicts the growth trend of wheat area cultivated, production, and yield in Ethiopia. Wheat production has grown significantly in the country over the past 13 years, rising from around 1.5 million tons in 2004/05 to 4.6 million tons in 2017/18 with an average annual growth rate of 6.1% (Figure 1). Despite its growth in production, there is significant inter-annual variability in production particularly during the years from 2004/05/ to 2009/10, due to variation in rainfall. The area cultivated with wheat has increased with slower rate than production, implying there is an increase in estimated yield. Moreover, as compared to the yields attained by other major producers in Africa (for example, Egypt, South Africa, and Kenya), Ethiopian wheat yields are low, but considerable potential for improvement (Gashaw & Bernard, 2017).
Figure 1: The growth trend of wheat production (2004-2017/18) Source: Author’s computation based on data from CSA (2004-2017/18) 3.5. Growth trend of wheat consumption in Ethiopia
The percentage utilization and trend of wheat consumption was shown in Figure 2. Central Statistical Agency reported that more than 58% of wheat produced in 2017/18 production season were used for household consumption (CSA, 2004/05-2018). Nearly 17% and 21% were used for seed and sale, respectively. The remainder is used for in kind payment for labor, animal feeds and other uses.
The trend analysis of wheat consumption of farm household indicated that the percentage utilization of wheat is not significantly increased from 2008/09 to 2017/18 except a relative small increase in for sale. However, study by Abu (2013) indicated that the wheat consumption trend in Ethiopia is gradually increasing in urban areas due to high population growth (about 2.6% a year), migration of people to urban areas, and changes in life styles (Abu, 2013).
Figure 2: Smallholders’ percentage utilization of wheat crops (2008-2017) Source: Author’s computation based on data from CSA (2008-2017)
Although Ethiopia has increased its wheat yield by 6.1% (Figure 2) over the last decade and more, the country cannot be self-sufficient in wheat and fully respond to the growing wheat demand by own wheat production. The current wheat demand has reached 6.3 million tons (USDA, 2019). In order to close the gap between demand and supply of wheat, it is needed to increase the volume of production by 37%. Moreover, to meet the growing demand of wheat as a result of population pressure and its associated factors by own production in 2050, the volume of
0.00 500.00 1,000.00 1,500.00 2,000.00 2,500.00 3,000.00 0.00 500.00 1,000.00 1,500.00 2,000.00 2,500.00 3,000.00 3,500.00 4,000.00 4,500.00 5,000.00 Y ie ld K g /h a A re a ( 0 0 0 'h a ) & P ro d u ct io n ( 0 0 0 't o n s)
production of wheat must grow from the current level 4.6 million tons in 2017/18 to 10 million tons in 2050. It is suggesting the need to generate and adopt high yielding wheat cultivars and expand wheat production area with the required level to fill the yield gap.
Wheat import has grown significantly over the past decade by an average of 6.6 percent (Samuel, et al., 2017). In marketing year 2011/12, the country imported 750,000 MT of wheat mainly from Russia and Argentina and around 300,000 MT through food aid mainly from the United States (Abu, 2013). In 2013/14 the country imported 1.39 million metric tons, which is about 34% of the domestic production and above 160% of the marketed wheat in the country (Minot, et al., 2015). A range of factors contribute for wheat demand growth including population growth, expansion of agro-processors, urbanization, and increasing household income (Samuel, et al., 2017).
Hence, alongside improving productivity of smallholders through various interventions, the Ethiopian government is subsidizing wheat grain shortfall through importing thousands of tons and providing it to milling industries (AACCSA, 2016). On top of this, the Ethiopian government has embarked on wheat production initiative in the lowland part of the country since 2015. The initiative is in partnership with Ethiopian Agricultural Research Council Secretariat (EARCS), Ethiopian Institute of Agricultural Research (EIAR), Ethiopian Sugar Corporation, and Agricultural Transformation Agency (ATA), with different role and responsibility. The partnership aims at substituting imports of wheat crop through expanding irrigated wheat production in low land potential areas of the country. According to the initiative document, it has estimated that the country has a potential to produce up to 5 tons/ha in highland areas if farmers adopt full technology packages and 6 tons/ha in the lowland areas if the required irrigation infrastructure is put in place (ATA, 2018).
After successive on farm trials following cool season of the year, best performer wheat varieties were produced on 700 hectares of land at Dubti sugar production farm. Based on the experiences obtained again, the initiatives scaled up to 3502 hectares at Dubti, Gewane, Amibara, Tentale, and Tibila of Afar areas in collaboration with private owned farms. In an effort of scaling up irrigated wheat production, 4 tons/ha and 2.8 tons/ha of the maximum and minimum yield was realized, respectively. The initiative has planned to expand wheat production by using existing potential in Afar, Somali and South Omo, and thereby close the import gap by 2021.
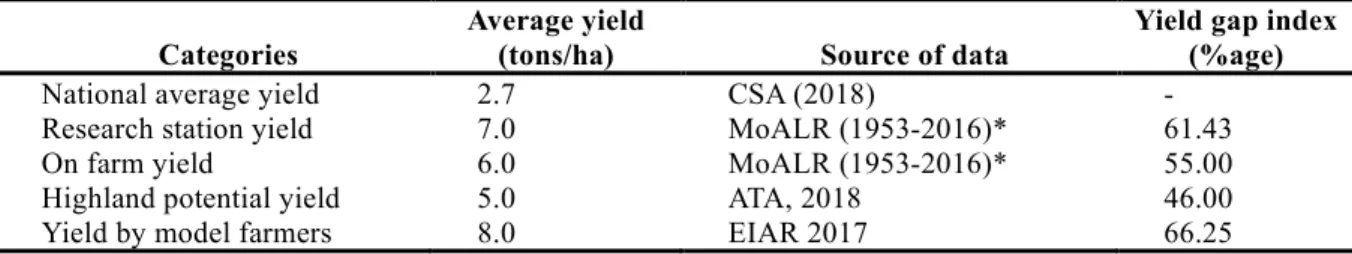
3.6. Observed yield gap
The percent of actual yield gap of wheat crop obtained from potential, national average, yield at research station and on farmers’ plot was presented in Table 4. Wheat potential yield in highland areas of the country (5 tons/ha), yield at research station (7 tons/ha) and on farmers’ plot (6 tons/ha) and yield by model farmers (7 tons/ha) was compared with the national average yield (2.7 tons/ha) to estimate the yield gap in the overall wheat yield. Accordingly, the yield gap was 61.43%, 55%, 46% and 66.25% when the national average yield compared with yield at research station, on farmers’ plot, highland potential, and yield by model farmers, respectively. Table 4: Observed wheat yield gap
Categories
Average yield
(tons/ha) Source of data
Yield gap index (%age)
National average yield 2.7 CSA (2018) -
Research station yield 7.0 MoALR (1953-2016)* 61.43
On farm yield 6.0 MoALR (1953-2016)* 55.00
Highland potential yield 5.0 ATA, 2018 46.00
Yield by model farmers 8.0 EIAR 2017 66.25
Source: Authors’ computation based on different data sources (2018/19) *The maximum yield achieved among the varieties (tons/ha)
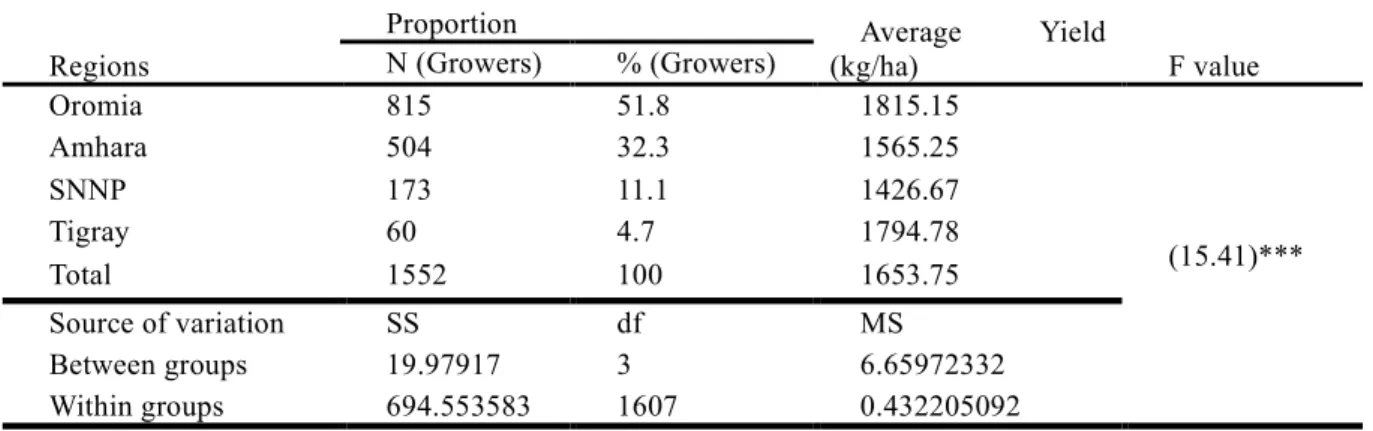
3.7. Observed yield variation
Of the total wheat growers surveyed, 51.8%, 32.3%, 11.1%, and 4.7% are in Oromia, Amhara, SNNP and Tigray, respectively. The overall average yield was found 1.6 tons/ha with minimum and maximum wheat yield of 8.8 tons/ha and 0.1 ton/ha, respectively (Table 4). With the assumption of normality and homogeneity of variance for one-way ANOVA analysis, the natural logarithm of the wheat output (kg/ha) was used. The Bartlett's test for equal variances found statistically insignificant, implying the result was valid. Accordingly, the analysis of variation of the wheat yield, presented in Table 4, showed there was statistically significant variation among the regions and wheat-growing farmers at less than 1% probability level.
Table 4: Variation of wheat yield observed among wheat growers in major regions Regions
Proportion Average Yield
(kg/ha) F value N (Growers) % (Growers) Oromia 815 51.8 1815.15 (15.41)*** Amhara 504 32.3 1565.25 SNNP 173 11.1 1426.67 Tigray 60 4.7 1794.78 Total 1552 100 1653.75 Source of variation SS df MS Between groups 19.97917 3 6.65972332 Within groups 694.553583 1607 0.432205092
Source: Authors’ computation based on data from EIAR/CIMMYT (2014/15) ***, **, * Significance at 1, 5 and 10% levels, respectively.
3.8. Causes for wheat yield variability
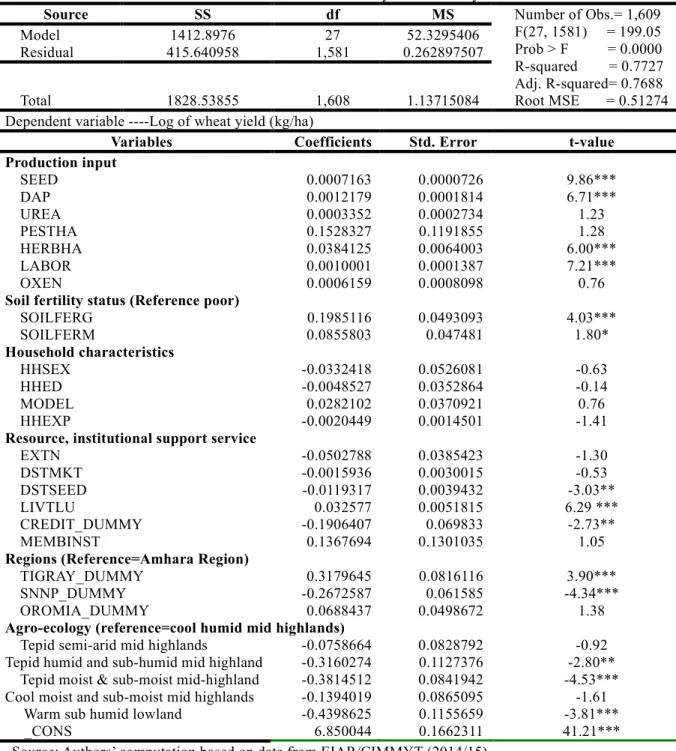
Among several variables, 20 independent variables with high predictive value was chosen and entered in the regression analysis. R-squared or coefficient of determination, adjusted R-squared, standard errors, and F-test, goods of-fit-statistics were used as a criteria to appraise the best fit of the model in WLS regression. The R-squared or coefficient of determination was 0.77, explaining about 77% of variations of wheat yield among the farmers in aggregate term was explained by explanatory variables considered in the model. The model is hence, best fit and good predictor of wheat yield variability among the respondent farmers.
The regression result on the determinants of yield variation in respect of wheat crop were documented in Table 6. Accordingly, among the variables included in the analysis, eight variables have significantly contributed for wheat yield variability in major growing areas at less than 1% probability level. These variables include labor per hectare, the use of improved seed per hectare, the use of DAP per hectare, the use of herbicide per hectare, soil fertility status, TLU, region, agro-ecology (Table 5). The use of farming inputs, such as improved seed, fertilizers (DAP), labor and chemical (herbicides) per hectare significantly determined the yield variability among wheat producing farmers in the regions, implying high rate of adoption of improved technologies along with their full production packages reduce yield variability among the farmers. In agreement with the result, several studies showed that (Samuel, et al., 2017) (Zewdie, et al., 2016) (AACCSA, 2016) (Deksiso & Uppal, 2018) the use of improved seeds and other production inputs help the growers to bring significant yield increment in their wheat farming.
Table 5: WLS Coefficient estimates for determinants of wheat yield variability
Source SS df MS Number of Obs.= 1,609
F(27, 1581) = 199.05 Prob > F = 0.0000 R-squared = 0.7727 Adj. R-squared= 0.7688 Root MSE = 0.51274 Model 1412.8976 27 52.3295406 Residual 415.640958 1,581 0.262897507 Total 1828.53855 1,608 1.13715084
Dependent variable ----Log of wheat yield (kg/ha)
Variables Coefficients Std. Error t-value
Production input SEED 0.0007163 0.0000726 9.86*** DAP 0.0012179 0.0001814 6.71*** UREA 0.0003352 0.0002734 1.23 PESTHA 0.1528327 0.1191855 1.28 HERBHA 0.0384125 0.0064003 6.00*** LABOR 0.0010001 0.0001387 7.21*** OXEN 0.0006159 0.0008098 0.76
Soil fertility status (Reference poor)
SOILFERG 0.1985116 0.0493093 4.03*** SOILFERM 0.0855803 0.047481 1.80* Household characteristics HHSEX -0.0332418 0.0526081 -0.63 HHED -0.0048527 0.0352864 -0.14 MODEL 0.0282102 0.0370921 0.76 HHEXP -0.0020449 0.0014501 -1.41
Resource, institutional support service
EXTN -0.0502788 0.0385423 -1.30 DSTMKT -0.0015936 0.0030015 -0.53 DSTSEED -0.0119317 0.0039432 -3.03** LIVTLU 0.032577 0.0051815 6.29 *** CREDIT_DUMMY -0.1906407 0.069833 -2.73** MEMBINST 0.1367694 0.1301035 1.05
Regions (Reference=Amhara Region)
TIGRAY_DUMMY 0.3179645 0.0816116 3.90***
SNNP_DUMMY -0.2672587 0.061585 -4.34***
OROMIA_DUMMY 0.0688437 0.0498672 1.38
Agro-ecology (reference=cool humid mid highlands)
Tepid semi-arid mid highlands -0.0758664 0.0828792 -0.92
Tepid humid and sub-humid mid highland -0.3160274 0.1127376 -2.80** Tepid moist & sub-moist mid-highland -0.3814512 0.0841942 -4.53*** Cool moist and sub-moist mid highlands -0.1394019 0.0865095 -1.61
Warm sub humid lowland -0.4398625 0.1155659 -3.81***
_CONS 6.850044 0.1662311 41.21***
Source: Authors’ computation based on data from EIAR/CIMMYT (2014/15) ***, **,* Significant at 1%,
4. Conclusions
Wheat is considered as one of the major strategic crops next maize to address food insecurity and the growing food demand in Ethiopia. However, the national average yield of wheat crop was found very low due to technical and institutional factors to achieve the potential yield confirmed by the research system. If the farmers are assisted and able to utilize the available technologies along with their full packages, it is possible to increase the national wheat yield by 46% in highland wheat growing areas of the country. However, with available wheat production area and available technologies, it is not possible to meet the growing demand for wheat. This is partly due to rapid population growth and fast urbanization.
The study suggests that it is important to review the existing policies and strategies of the wheat sector research and development that has been designed to guide the overall wheat production and consumption in the countries. It is also needed to generate and adapt site specific improved wheat varieties and production management practices, which will be guided by proper technology requirement road map and management system.
Furthermore, improved technologies for sustainable natural resource management should be generated and introduced by taking inter and intra-farm/plot variability into account. Proper institutional support services in key areas that needs reforms to the level that can fully capable to addressing the current challenges of wheat production in the county.
Overall, provided the countries’ rapid population growth and the existing climate change, Ethiopia should keep up wheat production level that can fully respond to the demand in required amount, type and site. Beyond sustaining population support, the wheat sector should trigger the economic transformation through surplus production resulted from the use of agricultural technologies and other inputs, and that of institutional innovation. However, operationally how the existing wheat production system can supply the required amount of wheat for the growing population is a critical question that calls for apposite answers.
Acknowledgements
The authors are gratefully to EIAR, CSA, MoARD, and CIMMYT for the provision of the data used in this study.
Conflict of Interests
The authors have not declared any conflict of interests. References
AACCSA, 2016. Value Chain Study on Wheat Industry in Ethiopia, Addis Ababa, Ethiopia: Afro Universal Consult and General Trading P.L.C. Final Report, AACCSA/Addis Ababa Chamber of Commerce and Sectorial Associations (2016)..
Abu, T., 2013. Ethiopia Grain and Feed annual Report. , s.l.: USDA Foreign Agricultural Science. GRAIN Report Number: ET-1301.
ATA, 2018. Low land wheat initiative: 3-years strategy, budget, operating model an implementation plan. August,
2018, Addis Ababa, Ethiopia: ATA: Agricultural Transformation Agency, Unpublished.
Bekele, H., Verkuiji, H., Mawangi, W. & Tanner, D., 2000. Adaptation of improved wheat technologies in Adaba
and Dodola Woredas of the Bale highlands of Ethiopia, Addis Ababa, Ethiopia: CIMMYT/EARO.
Chilot, Y. & Dawit, A., 2016. Adoption of Crop Technologies among Smallholder Farmers in Ethiopia: Implications for Research and Development. EIAR 50th Year Jubilee Anniversary Special Issue, 16(1). Chilot, Y., Dawit, A., O. Leonard, N. K. & Greg, T., 2016. Tracking the Diffusion of Crop Varieties Using DNA
Fingerprinting, Addis Ababa, Ethiopia: Research Report 112, Ethiopian Institute of Agricultural Research
(EIAR).
Chilot, Y. et al., 2013. Analysis of Adoption and Diffusion of Improved Wheat Technologies in Ethiopia, Addis Ababa, Ethiopia.: Research Report 101, Ethiopian Institute of Agricultural Research (EIAR).
CSA, 2004/05-2018. Area and Production of Major Crops (Private Peasant Holdings, Meher Season).
Agricultural Sample Survey. 2004/05-2017/18 (2006-2010 E.C.). Volume I Report, Addis Ababa, Ethiopia:
Central Statistical Agency (CSA).
Deksiso, G. & Uppal, A., 2018. Assessment of the factors affecting wheat yield: the case Tiyo Woreda Arsi zone of Oromia region in Ethiopia. Indian Journal of Economics and Development, 6(6).
Diao, X., 2010. Economic Importance of Agriculture for Sustainable Development and Poverty Reduction: The Case Study of Ethiopia. IFPRI, Global Forum on Agriculture 29-30 November 2010 Policies for Agricultural
Development, Poverty Reduction and Food Security, Adis Ababa, Ethiopia : IFPRI.
FAO, 2009. How to Feed the World in 2050? Information Division, Rome, Italy: Food and Agricuture Organization (FAO).
Fentahun, M., Abebe, K. & Fisseha, Z., 2017. Retrospects and prospects of Ethiopian Agricultural Research.
Addis, Ababa, Ethiopia: EIAR, ISBN: 9789994466412. .
Gashaw, T. & Bernard, T., 2017. Farmers’ Quality Assessment of Their Crops and Its Impact on
Commercialization Behavior: A Field Experiment in Ethiopia, s.l.: IFPRI Discussion Paper 01624.
Gujarati, D., 2004. Basic Econometrics. 4th Ed.. s.l.:The McGraw−Hill Companies.
Initiative:, W., 2015. Wheat research for food security. [Online] Available at: http://www.wheatinitiative.org/about-us/wheat-research-food-security[Accessed 18 December 2018]. Josephson, A., Ricker-Gilbert, J. & Florax, R., 2014. How does population density influence agricultural
intensification and productivity? Evidence from Ethiopia. Food Policy , 48(-), pp. 142-152.
Mann, M. & Warner, J., 2015. Ethiopian Wheat Yield and Yield Gap Estimation: A Small Area Integrated Data
Approach , Addis Ababa, Ethiopia: International Food Policy Research Institute (IFPRI).
Minot, N. et al., 2015. The Wheat Supply Chain in Ethiopia: Patterns, trends, and policy options, International Food Policy Research Institute (IFPRI) Washington, DC: International Food Policy Research Institute (IFPRI) .
MoARD, 1953-2016. Crop Variety Registers, Addis Ababa, Ethiopia: Ministry of Agriculture and Rural Development (MoARD).
Rashid, S., 2010. Staple Food Prices in Ethiopia. Prepared for the COMESA policy seminar on “Variation in staple food prices: Causes, consequence, and policy options”, 25‐26 January 2010 under the African
Agricultural Mar, Maputo, Mozambique: s.n.
Samuel, G., Mekbib, G. & Matthias, K., 2017. The Wheat Sector in Ethiopia: Current Status and Key Challenges for Future Value Chain Development. In: C. Borgemeister; J. von Braun; M. Denich; T. Stellmacher; E.
Youkhana. s.l.:ZEF Working Paper Series .
Schneider, K. & Anderson, L., 2010. Yield Gap and Productivity Potential in Ethiopian Agriculture: Staple Grains
and Pulses, s.l.: Evans School Policy Analysis and Research (EPAR). EPAR Brief No. 98.
Snodgrass, D., 2014. Agricultural Transformation in Sub-Saharan Africa and the Role of the Multiplier, s.l.: A Literature Review. Report No. 4. August 2014.
STAT, F., 2014. FAO Statistical Data base for wheat production in Ethiopia, Rome, Italy : Food and Agriculture Organization of the United Nations.
UN, 2015. Department of Economic and Social Affairs, Population Division, World Population Prospects: The
2015 Revision, Key Findings. , s.l.: Working Paper No. ESA/P/WP.241.
USDA, 2019. Grain and Feed Annual Report. , Addis Ababa, Ethiopia: USDA GRAIN Report Number: ET 1903. Zewdie, H., Belaineh, L., Jima, H. & Moti, J., 2016. Supply analysis in wheat industry: contributions of value chain analysis in Ethiopia: Cases from Arsi and East Shewa Zones in Oromia National and Regional State.