Farm level adoption decisions of soil and water management technologies in semi-arid Eastern Kenya
30
0
0
Full text
(2) FARM LEVEL ADOPTION DECISIONS OF SOIL AND WATER MANAGEMENT TECHNOLOGIES IN SEMI-ARID EASTERN KENYA Charles Bett1 In this paper the conceptual framework of individual farmers’ adoption decisions of new agricultural technologies is used to identify factors that influence adoption modified fanya juu terraces in semi-arid eastern Kenya. The adoption decision model was specified using farm and farmers’ characteristics and technology characteristics thought likely to influence farmers’ adoption behaviour. To test intensity of adoption a Tobit model was specified and estimated. Results of logit regression analysis reveal that access to markets, education, costs, technology attributes, labour, credit and risk preferences significantly influenced adoption decisions. Results from the estimated intensity of adoption model (tobit) show that variation in the proportion of land with technology was significantly influenced by age and level of education of the household head, access to markets, technology attributes, credit, off-farm income and risks.. Key words: Logit analysis; Tobit analysis; modified terraces; adoption 1. Introduction Although agriculture is an important sub sector of Kenya’s economy which contributes 30% to the country’s gross domestic product and employs 75% of the country’s workforce (Itabari 1999), frequent food shortages are experienced in the country. This has been attributed to the problems faced in the agricultural sub sector which include population pressure, poor soils, inadequate rainfall, persistent use of inappropriate technologies by farmers, distribution problems, inappropriate agricultural policies, pests and diseases (Republic of Kenya, 1993). Due to population pressure there as shift of the population to the arid and semi-arid (ASAL). Kenya’s population according to the census of 1999 was 28.6 million and with a population growth of 2.9%, the immediate direct consequence has been food deficits and land degradation. It is therefore becoming more urgent and important to provide solution for land degradation problems in the ASALS. The arid and semi-arid areas constitute 75% of Kenya and the remaining 25% is of high agricultural potential (Itabari 1999). In Kenya the semi-arid lands includes areas where annual crops are grown under rainfed conditions and where seasonal rainfall ranges from 500mm-800mm per annum and the area covers 7.5 million hectares. The 25% of the country is of high agricultural potential due to adequate rainfall ranging from 1250mm to 2000mm annually, which enables farmers to achieve maximum 1. Charles Bett is a student at The University of Sydney, Department of Agricultural and Resource Economics, NSW, 2006, RD Watt Building A04, Tel:+61 2 9351 4903, Facsimile: +61 2 9351 4953, Email: cbet6507@mail.usyd.edu.au or c.bett@agec.usyd.edu.au or charles_bett@hotmail.com. 2.
(3) returns from their agricultural enterprises with very high population density. Thus, attention is now shifting more and more to the semi-arid areas to meet the food deficits. Land degradation and low soil moisture in Kenya’s semi-arid environments is further compounded by the intensity of rain whenever it falls causing soil erosion and leaching. Other problems include land fragmentation, low farm incomes and high unemployment rates. Concerted efforts have been made to address problems facing the agricultural sub sector in Kenya including land degradation largely through a framework set up by the Kenya government in collaboration with other stakeholders. These efforts include technological change through government agencies, non-governmental organizations, churches and farmers. The government through the Ministry of Agriculture and Livestock Development (MOA&LD) has established an extension system whose aim is not only to pass on new agricultural technologies to farmers, but also to educate farmers on how to use these technologies. Non-governmental organizations (NGOs) and churches compliment efforts by the Government. NGOs and churches are concentrated in the arid and semi-arid lands (ASALs) of Kenya. NGOs and churches target the poorest in the community and try to encourage them to adopt new agricultural technologies through provision of services such as education, provision of inputs, provision of loans and organizing agricultural tours. Whereas some NGOs and churches supply inputs in the form of seeds of new varieties and other inputs associated with the new technology, others assist farmers form self help groups with an aim of pooling resources to enable them invest in capital and or labour intensive agricultural technologies. They organise farmers to pool labour and work on rotational basis on individual farms. In the case of technologies requiring capital investment they assist farmers by providing groups with a revolving credit to purchase capital requirements. Technical support is also provided in collaboration with MOA&LD and research institutes by passing on information regarding new technologies through farmer training forums. The Kenya Agricultural Research Institute (KARI), under the Ministry of Agriculture and Livestock Development develops agricultural technologies for different agro-ecological zones of the country. The National Dryland Farming Research Centre (NDFRC), within KARI develops agricultural technologies for the arid and semi-arid lands of Kenya. NDFRC has developed several agricultural technologies including early maturing crop varieties, disease and pest management strategies, and land and water enhancement technologies for the semi-arid environments. The policy objective of the agricultural sector is to attain self-sufficiency in basic food. Technological change therefore is important because it aims at improving productivity and it is hoped that it will improve farmers’ welfare by increasing their income, which is one of the governments’ goals. The aim of technological change is to maximize production and increase production to meet food demand (Gunawan 1988). Other positive effects of technological change may include labour saving and reduced environmental degradation. Technological change may also result in undesired effects. The undesirable effects could result due to increased productivity, which leads to over supply thus reducing farmers’ incomes. If the technology is labour saving it could also lead to job redundancies. Despite all the efforts by the Kenya government to meet its goals, supplemented by NGOs and churches, adoption of some agricultural technologies at the farm level in the. 3.
(4) arid and semi-arid lands, compared to the high potential areas remain low. It has been reported that farm level adoption of new agricultural technologies in Kenya is high in high potential areas but low for arid and semi-arid environments (Hassan 1998). Despite the benefits associated with the technologies as shown by experiments in research stations and on-farm, this is yet to translate via adoption to benefits for the farmer. A number of studies(Griliches 1957; Griliches 1960; Shakya and Flinn 1985; Gunawan 1988; Muhammad 1993; Baidu-Forson 1999) have been undertaken to investigate decision process in adopting or not adopting technologies. Past studies have concentrated on farm and farmers’ characteristics, as the most important factors affecting adoption. However, other characteristics such as technology related characteristics (Sall et al.,2000), farmers risk preferences and economics of adoption at farm level may also influence adoption decisions. Problems encountered by rural farmers with respect to technology adoption could be due to attempting to adopt technologies without understanding the social and economic costs. There are few, if any, studies in the arid and semi-arid lands of Kenya on adoption of soil and water management technologies where socio-economic aspects have received little attention. There is little information about farmers’ perceptions of the new technologies and how farmers risk preferences affect their decision to adopt or not adopt soil and water management technologies. There is need to understand farmers’ adoption decisions by investigating likely determinants such as risks, costs, income, off-farm income, profitability of agricultural enterprises under improved technologies and access to markets. Within this framework socio-economic variables such as level of education, farming experience, skills and institutional variables such as contractual arrangements and land tenure are likely to be important in understanding farmers’ decisions in adopting or not adopting new agricultural technologies. An investigation of farmers’ decisions to adopt or not adopt new technologies, appropriateness of the technologies, measuring effects of farmers’ characteristics on technology adoption provides useful information for policy makers for planning agricultural development. This specific objectives of this paper are: (1) identification of economic variables that influence adoption of land and water enhancing technologies, (2) examine effects of socio-economic variables, (3) examine what role risks play in farmers’ decisions of adopting new technologies, (4) examine the role played by farmers’ perceptions on improved technology in their adoption decisions, (5) examine the effect of time (years) on adoption of soil and water management technologies. The specific technology investigated in this paper is a variant of the conservation terrace, namely modified fanya juu2 terrace. Terraces refer to levelled portions of land along contours on sloping land with catchments. Modified fanya juu terraces refer to a variant of conservation bench terraces that have been modified during construction by digging a trench and throwing the soils up the slope. The next section of this paper reviews theoretical models and specifies the theoretical framework for studying adoption decisions at farm level in relation to the soil and water management technologies. Section 3 discusses the analytical model and the estimation of adoption. The empirical model used to test adoption decisions and the Tobit model used to examine intensity of adoption is discussed and their estimation procedures presented. The model to be estimated is specified and the explanatory variables used in the model defined. Section 4 presents the 2. Fanya juu is a Swahili word meaning to make by throwing the soils up.. 4.
(5) study area and describes in summary the data collected. Section 5 examines and discusses the results of the estimated empirical model whiles in section 6 the summary, conclusions and implications of the findings are presented. 2 Theoretical models Decision by farmers to use improved technologies has been described as a complex one involving two stages, one is whether to adopt or not, and secondly, is the level of use of the technology (Sall 2000). The first step is a complex process consisting of five stages (1) knowledge stage, (2) persuasion stage, (3) decision stage, (4) implementation stage and (5) confirmation stage. This is the innovation decision process defined as the process by which an individual goes through from the first knowledge of an innovation to a decision to adopt or reject (Gunawan 1988; Rogers 1995; Neupane et al., 2002). Farmers go through a stage of awareness or being knowledgeable of a new technology and forming an attitude towards a technology before deciding whether to adopt or not. This process has been illustrated in figure 1 as the adoption behavioural framework, a framework frequently used to examine adoption of various technologies (Shakya and Flinn 1985; Gunawan 1988; Varua 1991.; Neupane et al., 2002). As illustrated "I" is the index reflecting the combined influence of X and is not observed. What is observed is farmer adoption, with Y=1 for an adopter when some threshold is reached and Y=0 for a non adopter when some threshold is not reached.. 5.
(6) Farmers personal characteristics Tenure status Education Farming experience Family labour Age. I Adopt Y=1 Socio-economic characteristics Farm size Credit Costs Social acceptability. Institutional support Government policies Extension services Non-governmental organizations Research e.g. on-farm trials Membership to organizations Farmer groups. Knowledge/awareness and persuasion stages. Technology attributes Complexity Trialability Compatibility Observability Relative advantage. X. Figure 1: adoption behavioural framework. Adapted from (Shakya and Flinn 1985). 6. Adoption behaviour (Decision). I. Implementation. Reject Y=0.
(7) Adoption is the current level of use and intensity of use of a technology. In the econometric literature, three models have been frequently used analysing adoption, the linear probability, the logistic function (logit) and the normal density function (probit) models (Feder et al.,1985; Ayuk 1997). These models use a binary variable as the dependent variable. The use of a binary choice variable as a dependent variable may not capture intensity of adoption. It has been pointed out that there is a possible loss of information when a binary variable is used as the dependent variable (Baidu-Forson, 1999, citing Lynne et al., 1988). To overcome this problem the use of Tobit estimation method has been proposed for analysing intensity of adoption where the dependent variable is continuous (for example percentage proportion of the acreage covered by the technology) with a zero limit. Linear probability models have several inherent problems and have lately come under increasing criticisms. For example Rosenberg (1994, p 139) claimed that linear models of innovations are dead. The linear probability model may not be appropriate because the probability of doing something does not change linearly with the explanatory variables and therefore the need to use non-linear models to analyse choice behaviour of individuals. Limitations of linear probability models and their estimation using ordinary least squares (OLS), when the dependent variable is limited to zero (0) and one (1) were discussed extensively by Judge et al. (1985), Varua (1991) and Gujarati (1999). Logit and probit models produce identical results with small samples but logit has an advantage over probit because it is less complicated in its calculation. Logit was chosen over probit due to its simplicity in calculation and the fact that unlike probit it captures the dynamic aspects of adoption of technologies (Besley and Case 1993). 2.1 The logit model Estimated coefficients of the logit model define the slope or rate of change of a function of the dependent variable per unit of change in the explanatory variable. Positive sign for the coefficient indicates that the log of the odds ratio of adoption of modified fanya juu terraces increases as the value of the variable rises and a negative sign indicates that the ratio decreases as the value of the variable drops. The logit model is specified as follows (Judge et al. 1985, Varua, 1991): Pi =. 1. (1) 1+ exp[−(α + β1 X1i + β 2 X 2 i + − − − − + β n X ni )] where: Pi is the probability that an individual will make a decision to adopt a particular technology. α and β n are the parameters to be estimated th th X ni is the n explanatory variable for the i observation. After the specification of the logit function the task is then to estimate the parameters α and β ni . Gunawan (1988) observed that the estimation process for the logit model depends on the nature of data available. The first method of estimation is by use of grouped data and this is only possible with repeated observations of X n . When repeated observations are available the probability of each individual’s decision of adoption can be calculated in the sample and these probability data relate to the X’s. However in the 7.
(8) absence of repeated observations, no probability data are available and calculation of parameters becomes more complicated and requires the use of the maximum likelihood estimation (MLE) methods. Estimation of parameters by use of MLE is usually the most appropriate and practical method with data collected through survey methods. A single observation of X ni , is sufficient. The maximum likelihood method, under fairly general conditions the estimates has a number of desirable asymptotic characteristics (Judge et al., 1985). It yields estimates that are consistent, asymptotically efficient with normal limiting distributions. Maximum likelihood estimates of α , βn and the standard errors were obtained by using SHAZAM. Logit models have been used extensively to understand adoption decisions of new innovations. In his pioneer studies of adoption, Griliches (1957, 1960) used this model to analyse adoption of hybrid corn in the United States of America. Anderson et al. (1999) used the model to analyse the decision to adopt or not to adopt dead level fields and basins in the United States of America and (Gunawan 1988) used it in examining adoption and bias of agricultural innovations in Indonesia. Shakya (1985) and Muhammad (1993) used the model to study adoption of new crop varieties in Nepal and Kenya respectively. 2.2 The Tobit model Binary choice models (e.g. logit) allow the probability of adoption to be calculated, however, they do not generate expected use rates of the factor (in this case modified fanya juu terraces) for farmers who are adopters (Shakya and Flinn 1985), and expected elasticity of probability of adoption for non-adopters. To calculate expected use rates the use of tobit method has been proposed (Baidu-Forson 1999). Tobit allows the use of a continuous dependent variable with a lower limit, zero and an upper limit. In semi-arid eastern Kenya proportion of land with the technology vary from farmer to farmer and farmers with zero adoption exist and therefore the use of Tobit is appropriate. In the intensity of use analysis, the dependent variable was defined as the percentage proportion of land with modified fanya juu terraces (TECHACRE) and therefore application of tobit estimation gives the required information of adoption probability and generates use levels of the technology. Following Baidu-Forson (1999) the stochastic model underlying Tobit is specified as follows: t = X iβ + µi (2) if X i + ui > 0 , positive latent variable which is unobserved, adoption of an improved technology t occurs; ti = 0 , if X i + ui ≤ 0 in case of non adoption of t. Where i= 1, 2, -------N denotes the number of farm households ti = dependent variable (percentage proportion of land with the technology) Xi = vector of independent variables (socio-economic-institutional attitudinal etc) ui = random error term.. The change in the probability of the expected level of use of the technology for adopters and the elasticity of the probability of being an adopter is given by the 8.
(9) relationship between the expected value of all observations, E t and the expected * conditional value above the limit E t . The relationship is: *. E t = F(z)E t (3) where: F(z) is the cumulative density normal distribution function and z = X β σ Effect of kth variable of X on t is as follows: * * δF (z) δE t δ E t (4) δX k = F (z)( δX k ) = E t ( δX k ) From this equation total change is then disaggregated into expected level of use of t and the probability of being an adopter.. 4. The empirical model. This study was motivated by the realization that there is need to identify factors that may help in formulating strategies and policies that improve adoption of land and water enhancing technologies. The theories and related studies covered in the preceding sections form the basis of the model specification in this section. On the basis of the theoretical mode (logit) in section 3 the model for this study was specified as follows: 1 1+ exp[−(y i)] where: y i = α + β 1 farmacre + β 2 slope + β 3 disttown + β 4 eduesco + β 5 hhage + β 6 frmorgan + β 7 moa + β 8 attribut + β 9 totallab + β10loanacqu + β11nonfinco + β12 riskenvi Pi =. (5). Appendix 1 summarizes the explanatory variables used in this study and their expected signs. The signs indicate the effect of the independent (explanatory) variable on the dependent variable, whether it is negative or positive and the magnitude of the effect. The signs of the coefficients show the direction of the effects whereas the magnitude expresses how quickly the probability rises with the variable, that is the steepness of the cumulative density function (CDF). The t-ratios obtained tests the hypothesis that the parameter in question is zero, that it does not affect the dependent variable. If the null hypothesis is not false then the test statistic is distributed as N (0, 1) (Muhammad, 1993). On the basis of past studies it was hypothesized that adoption of modified fanya juu terraces will be influenced by farm characteristics (farmacre, slope), farmers’ characteristics (education, hhage), technology characteristics (attribut), labour availability (totallab), risks attitudes (riskenvi), market access (disttown), capital requirements (loanacqu, nonfinco), farmer organizations (frmorgan) and extension contact (moa). Farm size and slope were the only farm characteristics incorporated in the model. Land is an important factor of production and in this study land size was expressed in acres (farmacre). Farmers were asked to give the size of their farms as shown in the title or using any other available official records and if none was available the land was measured. Some soil and water management technologies especially the water harvesting. 9.
(10) techniques require minimum size of land to be effective. This means that there is a critical minimum land size beyond which the techniques won’t be optimal. Larger land sizes have larger catchments and thus more water will be collected and this will result in increased yield and profitability. Due to land fragmentation it was expected that land size would have a negative impact on adoption, which reduces farm level profitability. The gradient (slope) of each farm in the sample was determined with the help of the extension personnel assisting in the survey. Gradient was classified as steep, gentle sloping or flat. The gradient of the farm was represented by a dummy variable with the gradient covering more than fifty percent of the farm being assigned a value of one (1) and zero (0) otherwise. The topography of the farm plays an important role in the decision on what soil and water management strategies to use. Individuals whose farms have a sloping gradient may suffer more losses of soil nutrients through erosion and water may not be retained long enough to be able to infiltrate into the soils and be taken up by the plant. This results in low yields and reduced profitability of farm enterprises. Although gradient of the farm was expected to have a positive impact on adoption of soil and water conservation measures, higher slopes also mean higher costs of establishing soil conservation measures. Farm decisions in rural settings may be determined by one individual, the household head. To test this hypothesis the household heads personal characteristics were collected. The personal characteristics included in the model were education and age. An individual with high level of education is assumed to have a high ability to obtain process and use information relating to improved soil and water management technologies. This would depend on the economic viability of the technology, for example if adoption is not economically worthwhile more education would reduce adoption. Education was therefore expected to influence adoption positively or negatively. Education was classified into five major categories in the questionnaire; none for no formal education, primary (< 4 years), primary (> 4 years), secondary, tertiary and adult education. The highest level of education achieved either in years or the certificate they were holding was then solicited from farmers. Age of the household head (hhage) was expected to have either a negative or positive effect on adoption of soil and water management technologies. It is known that peoples willingness to change and adopt new technologies change with age. Older farmers were likely to be relatively reluctant in their decisions to take up new technologies. However, it is also true that older farmers were likely to have more farming experience and would therefore be likely to be more receptive to improved soil and water management technologies. On their part younger farmers would be receptive to new ideas and would likely be more willing to invest on new and long-term technologies. The influence of age on adoptions could not therefore be established a priori. With the assumption that the household head was the decision maker in the farm the age of the household head was included in the model as a continuous variable. Positive technology attributes was used as a proxy for economic advantage or profitability. Farmers were asked to list what they perceived to be desirable and undesirable attributes (attribut) of the technology. The aim of this was to determine the respondent’s perception of the efficiency of the technologies and their yield/profit advantage. The perception of a technology was represented by a dummy variable. A farmer listing more positive attributes than negative attributes including increased yield and soil and water conservation was given a value of one. The perception variable was set. 10.
(11) to zero for any other responses. It was expected that attributes of the technology would influence adoption positively. Large households were hypothesized to be able to provide labour required for labour intensive technologies and to this extent labour would influence adoption positively. Modified terraces being labour intensive technologies, households endowed with more labour are the ones more likely to adopt them. However, it has also been argued that large households result in more pressure on the land. This is more so in communities where land is usually subdivided amongst members of the household and this could discourage adoption of new and improved technologies. Family size, defined here as the number of adults above eighteen years old was assumed to indicate the amount of labour available in the household. Presence of risk (riskenvi) in agriculture is viewed as having substantial influence on farmers’ decisions to invest in new or improved technologies. Farmers in the semi-arid environments of Kenya and the world in general face considerable risks and uncertainties due to the fragile nature of their environment. They are uncertain about rainfall, returns of new technologies and the existence of markets for their products. Farm decisions on what soil and water management technologies to adopt would likely be based on risks associated with the technology. To asses’ farmer perception on the role of technology in reducing risks, farmers were asked whether they would take up new soil and water management technologies under the environment of uncertainty due to climate or price uncertainty. Farmers answering in the affirmative were assigned a value of one (1) and zero (0) otherwise. Depending on farmer’s risk attitudes, risk was expected to influence adoption positively or negatively. Past studies have identified farmers’ constraints in rural settings as poor infrastructure, costs and lack of capital. To asses the role of these constraints in paly in adoption, access to markets, costs of the technology, credit and sources of non-farm income were included in the model. Proximity to markets (disttown) may provide the farmer with opportunities in form of outlets for farm products at low cost while long distances to markets increases transaction costs and this could discourage agricultural commercialisation. Farmers living near towns and markets are more likely to be visited by extension providers than those living far away and therefore the cost of accessing technical information is reduced. Data was collected by measuring the distance from the farms to markets and towns. Initial cost of technology and maintenance costs play important roles in farmer’s decision on whether to adopt or not adopt a new technology. In land management technologies like modified terraces initial costs are in the form of establishment costs whereas maintenance costs are incurred seasonally. Farmers were asked to give their total expenditure of establishing modified terraces their annual maintenance costs. Farm investments just like any other business ventures could be expensive and may require external sources of income. Financial institutions usually provide loans to meet such short falls. Some of these institutions attach stringent conditions to their loans, some of which may not be met by farmers. Availability of credit would improve the chances of adoption. Credit availability (loanacqu) enables farmers to meet costs associated with the new technology. To this extend credit would influence adoption positively. However, this may only be true if there are no other competing activities for the same capital. If a farmer considers these other activities to be more profitable, then availability could result in a shift from farming, which will have the. 11.
(12) effect of reducing adoption. Credit availability was measured as a categorical variable by asking farmers if they had acquired credit in the past. The answer yes was assigned a value of one (1) and zero (0) otherwise. Apart from agricultural activities farmers are known to engage in other off-farm income generating activities to meet their liquidity constraints. Availability of non-farm income (nonfinco) would likely encourage adoption of modified terraces, so long as there were no non-farm income activities competing for the same capital. Non-farm income was represented by a dummy variable with farmers having a source of non-farm income being assigned a value of one (1) and zero (0) otherwise. Farmers have been known to engage in self-help groups with an aim of pooling resources for their own benefit. Interaction with other members of farmer organizations may expose farmers to more information, educational tours, extension, and credit, which in the long run encourages adoption. The variable on farmer organizations (frmorgan) was measured as a categorical variable by asking farmers if they belonged to any farmer organization. An affirmative answer was assigned a value of one (1) and zero (0) otherwise. There exist several extension providers in the semi-arid environments of Kenya with the major extension provider being the government through the Ministry of Agriculture. In summary they act as technology transfer agents and provide technical information to farmers to help them make informed decisions on new technologies and modern farm practices. More information sources means increased information for farmers and thus more likely to adopt new and improved technologies. To measure impact of sources of information farmers were asked to state their sources of information and the number of times they have received technical advice from those sources in the last one year. Response that advice has been received at least once in the last one year was assigned a value of one (1) and zero (0) otherwise. 4. The study area, data and sources of information. Water is one of the most important limiting natural resources in the semi-arid environments of Kenya. The limited rainfall in the region falls in short periods with high intensity resulting in soil erosion and leaching thus reducing the quality of soils. This creates the need for land and water management technologies to enhance soil and water retention for the successful cultivation of crops by farmers. On the basis of rainfall and temperature the semi-arid environments have been classified broadly into three agro climatic zones, namely agro climatic zones, 4, 5 and 6 of the Kenya national agricultural zonation system (Kiome and Stocking 1995; Itabari 1999). Agro climatic zone 4 has mainly low to medium altitudes, ranging from 1300m to 1800m above sea level, with annual temperatures of 180C to 210C. The agro climatic zone 5 falls between 800m to 1300m above sea level with mean annual temperatures of 210C to 240C. Rainfall ranges from 500mm to 800mm annually which is erratic, poorly distributed and of high intensity while it lasts. In semi-arid eastern Kenya, the monthly rainfall pattern is bimodal and the “long rains” fall between March to May with a peak in April while the “short rains” fall between October to December, peaking in November. The semi-arid environments of Kenya have scarce surface water resources with few permanent rivers. Most rivers in the region are seasonal and do not provide water when most needed for agricultural purposes. There are a few lakes in the area, however only two are fresh water and the rest are saline. 12.
(13) (Itabari 1999). Other surface water resources include earth dams, water pans, rock and roof catchments. Predominant soils include luvisols, acrisols and vertisols (Itabari 1999). Clays of luvisols and acrisols are predominantly kaolinitic clays. Soil textures range from sandy loam to loamy sand with a characteristic of hardening when dry but friable when wet. They are deep and well drained in wetter areas but tend to be shallow in dryer areas. They are regarded as being of low water holding capacity and, due to their poor structural development, they are highly erodible and prone to surface sealing and capping under high intensity rainfall. Vertisols which occur in plains and depressions, have a more clayey texture. They are moderately deep to deep and have better nutrient status. However, it is difficult to manage them because they do not drain easily, are heavy and sticky when wet and extremely hard when dry. Farming systems in the semi-arid environments are predominantly agro-pastoral with a strong interaction of crop farming activities and livestock activities. However, in agro ecological zone 4 crop farming is predominant while livestock farming is predominant in agro ecological zones 5 and 6. Livestock kept in the region are dual purpose both for milk and beef (Omiti, et al., 1999). Major crops in the semi-arid environments include cereals, legumes and horticultural crops. Cereals grown include maize, sorghum and millets. Legumes include beans, pigeonpeas and cowpeas whereas the horticultural crops grown include citrus, mangoes, pawpaws, kales and tomatoes. Apart from horticultural crops, which are regarded as high value cash crops, the rest are largely grown for subsistence. During the early years of Kenya’s agricultural evolution, soil and water management was one of the areas targeted for research and improvement. One of the first soil and water management technologies to be introduced and demonstrated to the farmers in Kenya were terraces. Terraces are levelled portions of land along contours on sloping land with catchments. Since their development variants have evolved where soils are thrown up or down the slope to form an embankment that retains water and spreads it in the field. It has been reported that terracing was introduced in Kenya as early as 1937 (Tiffen et al., 1994). However, modified fanya juu terraces in which soils are thrown up the slope were introduced formally in the mid 1950,s when the government started an aggressive campaign of soil conservation. Introduction of soil and water management technologies focused on arid and semi-arid areas where erosion and moisture stress was severe. In the semi-arid environments the early 1980’s saw intensive campaigns to reduce erosion and its effects by promoting soil and water conservation measures. The methods, which were targeted for promotion included cut-off drains, bench terraces, modified fanya juu terraces, grass strips and cover crops. A pressing problem in the semi-arid environments of Kenya is the rapid degradation of the fragile environment, which leads to low productivity and result in land barrenness (Itabari 1999). The per capita arable land has been estimated at 0.3 hectares (Republic of Kenya 1994). Smallholder farmers own 85% of the land area with their holdings ranging in size from 0.1 to 10 hectares. The remaining land held by large-scale farmers’ ranges in size from 10 to 10,000 hectares. With these statistics, and the absence of significant foreign earnings that would allow food imports, it is apparent that there is a need for increased food production in the country. To increase food production there are two options, either an increase in the area under crop production or an increase in the yield per unit area. Increasing the area under food production is not feasible in high. 13.
(14) potential areas due to population pressure which has resulted in land fragmentation and most land is fully cropped. Therefore the only option is to increase food production per unit area in either one or both of the high potential areas and semi-arid environments. Increased yields and production stability could be achieved through the use of appropriate soil and water management techniques and the introduction of irrigation schemes. Although the government has been pursuing these two options, the introduction of irrigation schemes has been hindered by the high capital outlay required for the establishment of irrigation structures and by the lack of permanent rivers in the semi-arid regions of Kenya. In the semi-arid environments irrigation has been minimal (Muhammad 1993) and land under irrigation in Kenya is a mere 1.5% (Itabari 1999). Primary data on a range of issues thought to influence individual decisions in the uptake of new and improved innovations was collected from 125 farm households in two divisions of semi-arid eastern Kenya. Additional information was obtained from secondary sources at the Ministry of Agriculture and from the National Dryland Farming Research Centre based in semi-arid eastern Kenya. The survey was conducted in Machakos district where two divisions Mwala and Kalama were randomly selected. The Machakos district has a population of 783,000 with approximately 112,000 farm households (Kenya Bureau of Statistics 2001). The Mwala division has a population of 89,000 whereas Kalama has a population of 41,000 with a total of 13,000 and 6,000 farm households respectively. The number of farm households was calculated using an average of seven persons per household which was obtained from past studies in the area (Muhammad 1993; Omiti 1999). Administratively Kenya is divided into provinces, districts, divisions, locations, sub-locations and villages. Due to the administrative set up a multistage sampling procedure was adopted. The Machakos district in eastern Kenya was purposively selected because it was one of the first districts where soil and water management technologies was introduced and more than 75% of the district fall under agro-ecological zone 4 (LM 4) (Tiffen 1994). Agriculture in Machakos district is more intense compared to the other districts which were predominated by agro-ecological zone four and five. Land use in zone five is mostly for range purposes. The process of sampling started with the listing of all the divisions in the district where two divisions Mwala and Kalama were selected randomly. This was followed by a visit to each of the two divisions where the divisional extension personnel gave an overview of the division by giving information on the number of farm households, agroecological zones, rainfall, soils and farming systems predominant in the division. The second stage of sampling was to draw the list of all the sub-locations in the two divisions and half of the sub-locations selected randomly. The third stage of sampling involved making a list of all farm households in all the sub-locations selected and households selected randomly. The Mwala division has many sub-locations as compared to the Kalama division. In Mwala fifteen sub-locations were selected and in Kalama six sublocations were selected. Whereas in Mwala the number of farmers selected in each sublocation was between 4 and 5, in Kalama was between 8 and 9 farmers were selected in each sub-location as there were fewer sub-locations. Two broad classes of land and water management technologies in semi-arid environments of Kenya are modified terraces and ridges. Modified terraces include modified fanya juu terraces and modified fanya chini terraces whereas ridges include open ridges and tied ridges. It was found in the survey. 14.
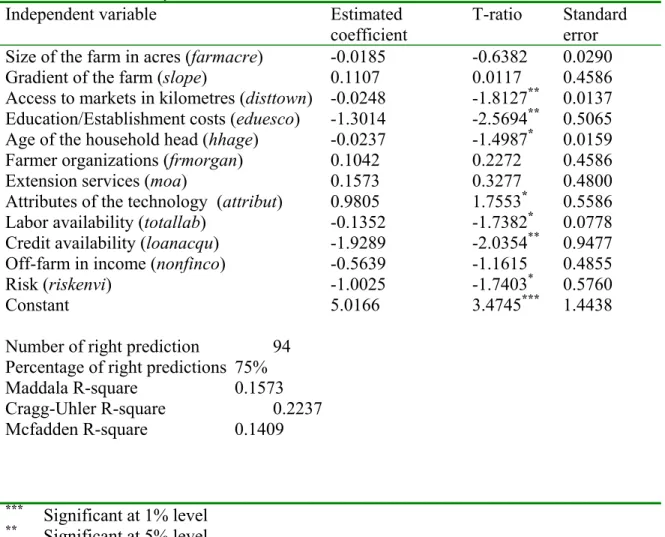
(15) that the use of modified fanya juu terraces was more widespread than modified fanya chini terraces. It was also found that adoption levels for open ridges were higher compared with tied ridges. Table 1 summarizes the adoption levels of modified terraces and ridges. Table 1: Adoption of selected soil and water management technologies Soil and water management Adopters Non-adopters Percentage adoption technology (no.) (no.) Modified fanya juu terraces 88 37 70.4 Modified fanya chini terraces 8 117 6.4 Tied ridges 5 120 4 Open ridges 56 69 44.8 5. Discussion of the results. From the discussions in the preceding sections decisions by farmers in the semiarid environments may be subject to exogenous, technical, socio-cultural and economic factors, which may serve to inhibit or encourage adoption of soil and water management technologies. A combination of these factors thought likely to influence adoption decisions have been incorporated in a logit and Tobit model, and estimated with an aim of identifying important factors affecting adoption decisions and level of use of the technology respectively in semi-arid eastern Kenya. 5.1 The estimated logit model The dependent variable was defined dichotomously with the respondents with no technology (non-adopters) being assigned a value of zero (0) and those with technology (adopters) being assigned a value of one (1). Adopters were those farmers reporting the use of modified fanya juu terraces on their farms and non-adopters were those farmers who did not have the technology on their farms. Results obtained indicate relatively low levels of total variations explained as indicated by the three R2 and this means that there could be other determinants of adoption not included in the model. However, this is expected with cross sectional data and this compares favourably with past studies (e.g., Ervin and Ervin, 1982, El-osta and Morehart, 1999). For logit models the usual R2 is not meaningful in determining the goodness of fit. Several alternatives of R2 have been proposed including Cragg-Uhler, Maddala and Mcfadden. There being no basis of choosing one of the three R2, the convention is to report all the three. In the estimated model Maddala and Mcfadden were almost the same whereas Cragg-Uhler was 0.2237. Out of the seven significant variables only one showed unexpected signs. The percentage of correct predictions was 75% with 94 right predictions. The R-squares obtained together with the percentage of right predictions indicate a relatively good fit. Table 2 summarises the estimated logit model.. 15.
(16) Table 2: Logit analysis of factors determining choice of modified fanya juu terraces in semi-arid eastern Kenya Independent variable Estimated T-ratio Standard coefficient error Size of the farm in acres (farmacre) -0.0185 -0.6382 0.0290 Gradient of the farm (slope) 0.1107 0.0117 0.4586 ** 0.0137 Access to markets in kilometres (disttown) -0.0248 -1.8127 Education/Establishment costs (eduesco) -1.3014 -2.5694** 0.5065 Age of the household head (hhage) -0.0237 -1.4987* 0.0159 Farmer organizations (frmorgan) 0.1042 0.2272 0.4586 Extension services (moa) 0.1573 0.3277 0.4800 0.5586 Attributes of the technology (attribut) 0.9805 1.7553* 0.0778 Labor availability (totallab) -0.1352 -1.7382* ** Credit availability (loanacqu) -1.9289 -2.0354 0.9477 Off-farm in income (nonfinco) -0.5639 -1.1615 0.4855 0.5760 Risk (riskenvi) -1.0025 -1.7403* Constant 5.0166 3.4745*** 1.4438 Number of right prediction 94 Percentage of right predictions 75% Maddala R-square 0.1573 Cragg-Uhler R-square 0.2237 Mcfadden R-square 0.1409. *** ** *. Significant at 1% level Significant at 5% level Significant at 10% level. Past studies examining the effect of education on adoption of agricultural technologies have been mixed. Whereas some have found education to influence adoption positively (e.g., Ervin and Ervin, 1982, El-osta and Morehart, 1999) others have found education to influence adoption negatively (e.g., Lapar and Pandey, 1999, Varua, 1991). Higher education influences adoption decisions because it is associated with the ability to synthesize more information on technologies on offer and improvement of farm management. Farmers with higher level of education have an enhanced ability to understand and interpret information regarding new or improved technologies. Modified fanya juu terraces are labour intensive and expensive to construct. Farmers were asked to estimate the establishment costs used in terrace construction. Whereas the adopters were able to estimate the establishment costs without difficulty, few non- adopters could confidently do so. This clearly creates a problem for analysing the effects of cost on adoption. Ultimately the only solution is to obtain better data on costs from the nonadopters. In the absence of such data, a dummy variable was used to represent establishment costs. Farmers who were able to estimate costs were assigned a value of one and zero for those who were not able to estimate the establishment costs. Education. 16.
(17) effects could either have a positive or negative influence on particular adoption decisions depending on the viability of the technology. On the other hand costs were expected to have a negative influence on adoption decisions. The net effect of education and costs was therefore expected to influence adoption decisions negatively. Estimated coefficient, 1.3014** (0.50651)3, show that interaction between education and establishment costs significantly influenced adoption decisions negatively. Education and cost were allowed to interact because, education or costs alone influenced adoption decisions insignificantly. Farming experience and planning horizon are two aspects that help to explain the effect of age on adoption decisions. Older farmers were expected to view new and improved technologies favourably due to the long farming experience they are likely to have. However, it has also been argued that older farmers maybe more conservative and reluctant to adopt new technologies as compared to younger farmers. Younger farmers on their part have a longer planning horizon and are more likely to invest in technologies such as modified terraces, which are long-term investments. The net effect of age on adoption decisions therefore can not be established a priori. Results obtained, 0.023670* (0.015854), by estimating the logit model showed that, age has a significant negative influence on adoption decisions. Ceteris paribus, if age is increased by one unit, the log of the odds ratio in favour of adopting modified fanya juu terraces goes down by 0.0237 units. The negative relationship between the log of the odds ratio and the variable can be explained by older farmers shorter planning horizon and, maybe their being more risk averse than younger farmers. Age has been previously tested in several adoption studies and the results have been mixed. In a study of technology adoption decisions in dairy production it was found that age influenced adoption decisions positively (El-osta and Moerhart, 1999). In a study of adoption of soil conservation (Lapar and Pandey, 1999) it was found that age influenced adoption decisions of contour hedgerows both positively and negatively in Cebu and Claveria respectively in the Philippine uplands. A study of factors influencing adoption of land enhancing technology in the Sahel (Baidu-Forson, 1999) found that age influences adoption decisions negatively. A study of a fishing technology (Varua 1991.) also found that age influenced adoption decisions negatively but was not significant. Capital in the form of credit, non-farm income or savings is required to meet financial implications that come with new or improved technologies. Farmers were asked if they had acquired any loans for agricultural activities. Results obtained, 1.9289** (0.48553), indicated that credit negatively influenced adoption decisions significantly. Ceteris paribus, if credit was increased by one unit on average, the log of the odds ratio in favour of adopting modified fanya juu terraces goes down by 1.9189 units. This result can be attributed to farmers channelling credit to other activities, other than crop farming. Such activities would include opening small retail business. Proximity to markets, towns and major roads provides a number of improved opportunities for the farmer. Distance was measured in kilometres by estimating the distance of the farmer to the nearest town or market. Distance to towns’ or markets’ was expected to have a positive or negative 3. The number in parentheses is the standard error of the estimate whereas the number outside the *** ** Indicates significance at 1% level, indicates parentheses is the estimated coefficient. * significance at 5% level, indicates significance at 10% level. This style of reporting estimated coefficients and standard errors of the estimate is adopted throughout this paper. 17.
(18) influence depending on how far, farmers were from towns or major markets. Results obtained, 0.024765** (0.013662), indicated that distance to town significantly influenced adoption decisions negatively. Holding all other things constant, if the distance was increased by one unit, on average, the log of the odds ratio in favour of adopting modified fanya juu terraces goes down by approximately 0.0248 units. Technology attributes are considered important in adoption decisions of agricultural innovations and, in particular farmers’ perceptions of those attributes. If in a farmer’s perception, the positive attributes outweigh the negative attributes, then the technology maybe adopted. On the other hand if a farmer perceives that negative attributes exceed the positive attributes, then the technology maybe rejected. In the long run a technology with more positive attributes improves farm profitability and thus this variable was used as a proxy for economic advantage or profitability of the technology. Farmers were asked to list positive and negative attributes in order of importance. A dummy reflecting the attributes was then specified with cases of farmers mentioning more positive attributes including soil conservation, water conservation and increased yield being assigned a value of one and zero otherwise. The positive coefficient obtained, 0.98051** (0.55860), indicates that farmers who had favourable perception of the technology were more likely to be adopters. Ceteris paribus, if technology attributes, were increased by one unit, then the log of the odds ration would increase, on average, by 0.98051 units. When new or modified technologies are introduced, they are associated with risks. Whereas some of these risks could be subjective in that farmers view the technology as having risks just because they do not have all the information about the technology, the risks could also be objective in that risks stem from fragile environments and uncertain markets. With the introduction of improved technologies, farmers who are risk loving would be more willing to adopt technologies while farmers who are risk averse would adopt a wait-and-see attitude until more information on the new technologies becomes available. On the role of the technology in reducing risks farmers were asked whether they would take up new technologies under an environment of uncertainty due to uncertain weather conditions and markets. Farmers responding in the affirmative were postulated to be farmers who view modified fanya juu terraces as a risk reducing technology and those responding in the negative thought to be those farmers who view the technology as non risk reducing. Whereas a positive relationship was expected because modified terraces are thought to retain moisture in the field and increase chances of crop success the results were on the contrary. A negative relationship was obtained, 1.0025* (0.57603), between the log of the odds ratio and the variable. A possible explanation is that farmers viewed soil and water management technologies as non-risk reducing. Most soil and water management technologies are labor using. Terrace construction increases seasonal demand for labour during peak seasons and is usually done during the dry periods when the ground is very hard. It could be done with less labour at the times when the ground is softer. However, this is unusual because during the peak seasons when the rains set in there are other more highly valued farm activities competing for labour, for example planting and weeding. A labor availability variable defined as the number of adults above eighteen years living on the farm was included in the model. Estimated coefficient obtained, 0.13522* (0.077793), showed that, labour. 18.
(19) significantly influenced adoption decisions negatively. Holding all other things constant, if labour was increased by one unit on average, the log of the odds ratio in favour of adopting modified fanya juu terraces reduces by 0.1352 units. This result may be explained by the pressure large households have on the land. More people above 18 years means a particular household was large and this means more pressure on the land which may have a negative influence on adoption decisions. Labour was measured as a continuous variable using all adults in the household who were above 18 years. In a study of adoption of soil conservation in the Philippine uplands (Lapar and Pandey 1999), land/labour ratio, measured as the ratio of the area operated to the number of family members engaged in farming was used as an indicator of population pressure on land. Results from one site indicated a negative influence on adoption, whereas results from another site indicated a positive influence. In another study of factors influencing adoption of land enhancing technology in the Sahel (Baidu-Forson 1999), also used land/labour ratio as an indicator of pressure on land. In Baidu-Forson’s study it was expected that land/labour ratio would have a negative influence on adoption, but the results were on the contrary. Availability of non-farm income helps the farmer to meet liquidity shortfalls and to this extent was expected to have a positive effect on adoption decisions. Non-farm income activities competing with farm enterprises, on the other hand would have a negative influence on adoption decisions. Lapar and Pandey (1999), argue that, the level of non-farm income may not be exogenous, but be affected by the profitability of the farm enterprises which in turn is dependent on conservation decisions. Therefore adoption of conservation practices and level of non-farm income maybe determined simultaneously, which arises due to labour allocation decisions of the households into farm and non-farm activities. If non-farm income activities are more profitable then farm adoption decisions would not be viewed favourably by the farmers. The non-farm income variable was specified as a dummy variable, based on survey responses to a question by asking farmers to state whether they were engaged in off-farm income generating activities. Results, 0.56396 (0.48553), show that non-farm income influences adoption decisions negatively, but this was not statistically significant. Farmers reported their nonfarm income originated from salaried employment, donations from children and relatives working in towns and cities, and business activities. Donations from children and relatives working overseas, towns and cities would be classified as exogenous. On the other hand, non-farm income from salaried employment and non-farm business activities may not be exogenous. From the results obtained it seems non-farm income activities were preferred to farm activities and this may explain the negative relationship obtained between the log of the odds ratio and the adoption of modified fanya juu terraces. The dummy variable for non-farm income provides only a very rough measure of non-farm income. Ideally one would measure the actual amount. Due to the sensitivity farmers view attempts to get information on their income and the difficulty of the farmers remembering the actual amounts, actual amounts were not sought. This has been attempted by earlier studies in Kenya and the Sahel (Muhammad 1993; Baidu-Forson 1999) but farmers were reluctant to give the information. Depending on the technology, farm size could influence adoption through factors such as fixed adoption costs, risk preferences, human capital, credit constraints, labour requirements and tenure arrangements (Feder et al., 1985). Farm size was specified in. 19.
(20) acres based on the data recorded in the survey and was found to influence adoption decisions negatively, although not significantly. The estimated coefficient was 0.0180531 (0.029038). The negative influence might be explained by what has happened over the years where land subdivision has occurred leading to land fragmentation. Land fragmentation makes it difficult to undertake optimal soil and water lay outs, enforce proper land use or obtain convenient water ways. It has been suggested in theoretical literature (Feder et al.,1985) that fixed costs inhibits and slows the rate of adoption amongst smallholder farmers. Land fragmentation reduces benefits associated with economies of scale. It has been demonstrated that, at a given point in time, there maybe a lower limit on the size of adopting farms, such that farms smaller than a certain critical level will not adopt new or improved technologies. The critical lower limit level may have been reached in the case of the surveyed area of semi-arid eastern Kenya. It has also been argued that capital maybe readily available for large scale farms as opposed to small and fragmented farms. This could be explained by small sizes of land which creditors are usually unwilling to accept them as collateral for the provision of loans. If credit is an important factor associated with farm size, the fact that credit is included in the model could have reduced the effects of farm size. Farmers were asked to state their sources of information in order of importance and the number of visits in the last one year from each of the sources listed. An extension services variable was then specified as a dummy variable by assigning a value of one for extension services from the government and non-governmental organizations if there had been at least one visit in the last one year. Estimated coefficient, 0.1573 (0.4800), showed a positive, but insignificant relationship between the log of the odds ratio and the extension variable. This result is consistent with other studies (Baidu-Forson, 1999, Neupane et al., 2002), which found extension contact positively influences adoption decisions. Membership of farmer organizations was hypothesized to impact positively on the adoption of modified terraces, through educational tours provided by the government and non-governmental organizations to such groups. In this regard it is akin to the extension services variable. Some farmer organizations also organize labour exchange activities. Labour exchange involves farmers coming together and working in each others farms in turns during peak periods. Labour exchange relaxes the labour constraints during peak seasons. The estimated coefficient, 0.10420 (0.45855), showed an insignificant positive relationship between the log of the odds ratio and the variable. Slope can be used as an indicator for soil and water loss, but it was used here due to its influence on costs. Nature of the slope is very important especially in the construction of modified fanya juu terraces. This is because trenches have to be dug which sometimes could be as deep as 0.75 meters with a length of 100 meters or more. The depth and the spacing (therefore the number of terraces) will be greatly determined by the slope coefficient. The steeper the slope, the more the trenches and therefore the more the labour costs. The estimated coefficient, 0.11069 (0.45860), showed a positive but insignificant relationship between the log of the odds ratio with the slope variable. 5.2 The estimated Tobit model When a new innovation is introduced a farmer either accepts or rejects the innovation. If a farmer adopts the innovation a subsequent decision has to be made of the extent or the quantity of the innovation to adopt, referred to as intensity of adoption. This. 20.
(21) is because most innovations come with a complete set of recommendations, which a farmer, depending on his/her circumstances, will take them as a whole or in part. The limited dependent variable model, Tobit, is preferred when the dependent variable is continuous with a lower and upper limit. It estimates the probability of adoption and in addition the value of the non-limiting response for the case I≥I* (Shakya and Flinn 1985). Following the tobit model used to test factors affecting incidence and intensity of adoption which was specified in section 2 the model for this study was specified as: t = α + β1X 1 + β 2X 2 + β 3 X 3 + β 4 X 5 + β 5 X 5 + β 6 X + β 7 X 7 + β 8 X 8 + β 9 X 9 + β 10 X 10 + β 11 X 11 + β 12 X 12. where: t X1 X2 X3 X4 X5 X6 X7 X8 X9 X10 X11 X12. 6. (6). = Percentage proportion of land with the technology (techacre) = Slope of the land (slope) = Distance to nearest market/town (disttown) = Education/costs (eduesco) = Age of household head in years (hhage) = Membership of farmer organizations (frmorgan) = Extension contact (moa) = Technology attributes (attribut) = Labour (totallab) = Credit (loanacqu) = Non-farm income (nonfinco) = Risks (riskenvi) and = Years since the technology was adopted (years). Tobit model use maximum likelihood methods (MLE) to estimate the coefficients of t in equation 10. The coefficients estimated are asymptotically efficient, unbiased and normally distributed (Shakya and Flinn 1985). Therefore with large samples the ratio of the estimated coefficients and its standard error approximates a normal distribution, thus an analog of the t test is used for testing the individual significance of the coefficients. In this study, the portion of the land area with modified fanya juu terraces was used to represent the quantity of innovations adopted by the farmers and therefore a direct application of Tobit estimation sufficiently provides the required information on adoption probability and intensity of use of the technology. The dependent variable t was the percentage proportion of the area with the technology to the whole farm acreage. The dependent variable, while continuous it was limited. It was greater than zero but with upper limit of 100 percent (0%<Y≤100%). Following the specification of the model (equation 10) leads to a positive prediction of the percentage of adoption, 0%<Y≤100%. The log-likelihood function was -46.44 whereas the fairly high squared correlation between observed and expected values of 0.2746 indicate the existence of useful information in the estimated Tobit model. All the variables except risks showed the expected signs. Table 3 summarizes the estimated tobit model for factors influencing intensity of adoption of modified fanya juu terraces in Semi-arid eastern Kenya.. 21.
(22) Table 3: Estimated Tobit model for factors influencing intensity of adoption of modified fanya juu terraces in semi-arid eastern Kenya Elasticity of Variable Normalized Standard T-ratio coefficient error adoption expected level index of use intensity Farm gradient (slope) -0.0768 0.20221 -0.3798 -0.0292 -0.0261 Distance to markets (disttown) -0.0129 0.0061 -2.1130** -0.4459 -0.3981 Education and costs (eduesco) -0.7052 0.23702 -2.9755** -0.1610 -0.1437 Age in years (hhage) -0.0188 0.0066 -2.8310** -0.8879 -0.7928 Farm organizations (frmorgan) 0.0643 0.2012 0.3195 0.0284 0.0253 Extension services (moa) 0.0831 0.2073 0.4009 0.0272 0.0243 0.1130 Technology attributes (attribut) 0.5041 0.2335 2.1592** 0.1266 Labor (totallab) -0.0419 0.0358 -1.1708 -0.1951 -0.1742 Credit availability (loanacqu) -1.4578 0.6042 -2.4129** -0.0666 -0.0594 Off-farm income (nonfinco) -0.4017 0.2070 -1.9403** -0.2262 -0.2020 Risk (riskenvi) -0.3579 0.2323 -1.5404* -0.2587 -0.2310 0.2783 Years of adoption (years) 0.0251 0.0061 4.1166*** 0.3116 Constant 2.6853 0.5614 4.7830*** Log-likelihood function = -46.442186 Mean square error = 0.53755330E-01 Mean error = -0.10772728E-01 Squared correlation between observed and expected values = 0.27455 Predicted probability of Y> limit given average X(1) = 0.7931 The observed frequency of Y >limit = 0.7040 At mean value of all X(I), E(Y) = 0.2766 *** Significant at 1% level ** Significant at 5% level * Significant at 10% level Variations in the proportion of land with modified fanya juu terraces is significantly explained by the following: (1) years since the technology was adopted, 0.025066*** (0.0060891), (2) an interaction of education and costs, 0.70526** (0.23702), (3) age of the household head, 0.018823** (0.006649), (4) credit, 1.4578** (0.60418), (5) technology attributes, 0.50412** (0.23348), (6) distance to markets, 0.012972** (0.006191), (7) off-farm income, 0.40170** (0.20702) and (8) role of technology in reducing risks, 0.35787* (0.23233). Other variables were insignificant in explaining the variations in TECHACRE. Surveyed farmers adopted modified fanya juu terraces at different times, ranging from 1 year to 57 years, an average of 13 years. Years since the technology was used for the first time significantly explained the variations in the percentage portion of the land with the technology. When a technology is first adopted farmers will undergo a phase of trying the technology to a small extend or in small quantities. With time, results of the initial trials by farmers will be clearer and more information on the technology is available which will lead to more farmers adopting the technology and early adopters increasing the extent and quantity of adoption. Another important variable that explained. 22.
(23) the variations in TECHACRE was an interaction between education and costs. Whereas education was expected to have either a negative or positive influence on intensity of adoption, costs was expected to have a negative influence. An interaction between costs and education influenced intensity of adoption negatively and significantly. Higher education level is associated with greater information on soil and water management, which helps the farmer to make informed choices. Costs on the other hand may discourage further adoption if the farmer cannot raise enough capital to sustain costs associated with the initial adoption. Financial incompatibility arises if the financial outlay of the technology is beyond the reach of the farmers, which inevitably discourages complete adoption. Age can be taken as a composite of the effects of farming experience and planning horizon (Lapar and Pandey 1999). Whereas longer farming experience associated with older farmers and long planning horizon associated with younger farmers was expected to have a positive effect on intensity of adoption, conservatism associated with older farmers would influence intensity of adoption negatively. The estimated tobit elasticities show that age makes a substantial contribution to adoption and intensity of use of the technology. This result is consistent with earlier findings that have found a negative influence (Baidu-Forson 1999) and contrary to other findings that have found a positive influence of age with innovations. Technology attributes was used as proxy for economic advantage or profitability. Among other attributes mentioned by farmers, was increased productivity reflected by the increased yield from various farming enterprises. Increased yield is expected to result in increased profitability. Technology attributes which included soil conservation, water retention and conservation, and increased yield was found to be significant in explaining the variations in the proportion of the land with the technology. Credit and the percentage proportion of land with the technology were found to be significantly and negatively related. Credit is expected to relax the financial constraint and this would be expected to have a positive influence on intensity of adoption. However, this is only as far as the profitability of the technology supersedes other investment alternatives available to the farmer. In reality a farmer must make a choice between farming and other alternative investment options. The area being environmentally fragile due to erratic rainfall makes farming more risky than other business opportunities and this may lead to farmers allocating a higher proportion of available capital to other investment opportunities. Distance to markets was used as a proxy for market access. Farmers who can reach the market readily will have an incentive to increase their productivity in order to maximize on income generating activities provided by proximity to markets. On the other hand being far away from markets either by distance or state of the roads discourages farmers from increasing their farm productivity. In the case of this study distance to markets significantly and negatively explained the variations in the percentage proportion of land with the technology. If financial capital is a constraint to adopting modified fanya juu terraces, and if farm enterprises are more profitable than other investment options, then non-farm income would have a positive influence on intensity of adoption. However, if alternative investment options exist, then a negative relationship between the portion of land with the technology and the intensity of adoption may be expected. Non-farm income was found. 23.
(24) to be significantly and negatively related to the percentage proportion of land with modified fanya juu terraces. Another important variable influencing intensity of adoption of modified fanya juu terraces was the role played by the technology in reducing risks, as viewed by he farmers. Farmers who view the technology as risk reducing would be expected to have a higher level of adoption whereas those viewing the technology as non-risk reducing would be expected to have a low level of adoption or no adoption at all. The estimated Tobit elasticities show that it would be possible to increase the level of adoption or intensity of use if the technology has risk reducing characteristics. The significance of risk on intensity of adoption of soil and water management technologies is similar to earlier findings (Baidu-Forson 1999). 6 Summary and concluding remarks. The Kenya government’s policy objective is to improve food production by increasing productivity either by increasing production per unit area and or increasing area under production. The result of this policy objective is hoped will lead to improved food security and self sufficiency. One area the government and other stakeholders have put emphasis on is improving and reversing land degradation through the use of improved land water management technologies by encouraging technical change. This is evident from the activities of the government, non-governmental organizations and churches in the semi-arid environments of Kenya. The aim of this study was to identify factors influencing adoption and levels of the technology in semi-arid eastern Kenya. Factors identified would help policy makers, NGO’s and churches prescribe strategies and policy interventions in the targeted areas. Technology attributes was found to influence adoption decisions significantly. This implies that the use of modified fanya juu terraces is profitable according to farmers’ perceptions, thus policy makers need to demonstrate profitability of the new technologies to farmers. Other important variables influencing adoption decisions were credit, interaction between education and costs and distance to markets, risks, labour and age of the household head. The influence of education and establishment costs means that the higher the establishment costs the less likely the technology would be adopted. Policy makers should therefore think of policies that are financially compatible with the economic means of the farmers in the region. Whereas nothing much could be done about age of the farmers, improvement of the infrastructure, demonstration of risk reducing characteristics of the technology are areas that may require interventions. To encourage and increase level of use of the technology, infrastructure, education, financial compatibility, economic advantage of the technology, capital requirements, role of technology in reducing risks may need policy interventions. Variables relating to these aspects were all important in explaining the variations in the land with modified fanya juu terraces. The analysis in this paper was related only to adoption decisions and intensity of use relating to modified fanya juu terraces. However, factors found to be important in influencing adoption decisions and the level of use of modified fanya juu terraces may be important in other land and water management strategies. Follow up studies covering more locations and more classes of land and water management technologies to confirm. 24.
(25) or refute the findings in this paper will be helpful in formulating policies and strategies that will increase adoption decisions and levels of use of the technology.. 25.
(26) References. Anderson, D. P., Wilson, P. N. and Gary, D. T. (1999). "The Adoption and Diffusion of Level Fields and Basins,’ Journal of Agricultural and resource Economics." Journal of Agricultural and resource Economics 24(1): 186-203. Ayuk, E. T. (1997). "Adoption of Agroforestry Technology: The Case of Live Hedges in the Central Plateau of Burkina Faso." Agricultural Systems 54(2): 189-206. Baidu-Forson, J. (1999). "Factors influencing adoption of land-enhancing technology in the Sahel: lessons from a case study in Niger." Agricultural economics 20: 231239. Baidu-Forson, J. (1999). "Factors influencing adoption of land-enhancing technology in the Sahel: lessons from a case study in Niger." Agricultural economics 20(3): 231-239. Feder, G., Just, R. E., and Zilberman, D. (1985). "Adoption of agricultural innovations in developing countries: A survey." Economic development and cultural change 33: 255-298. Feder, G., Just, R. E., and Zilberman, D. (1985). "Adoption of agricultural innovations in developing countries: A survey." Economic development and cultural change 33(2): 255-298. Griliches, Z. (1957). "Hybrid corn: an exploration in the economics of technical change." Econometrica 25(4): 501-522. Griliches, Z. (1960). "Hybrid Corn and the Economics of Innovation." Science: 275-280. Gunawan, M. (1988). Adoption and bias of new agricultural innovation in Jawa Barat, Indonesia. Minnesotta, University of Minnesota. Gunawan, M. (1988). Adoption and bias of new agricultural innovation in Jawa Barat, Indonesia, PhD Thesis. Minnesotta, University of Minnesota. Itabari, J. K. (1999). Optimizing soil water use in the semi-arid areas of Kenya. Efficient soil water use: the key to sustainable crop production in the dry areas of West Asia, North and Sub-Saharan Africa. Proceedings of the 1998 (Niger) and 1999 (Jordan) workshops of the Optimizing Soil water Use (OSWU) Consortium., Niger and Jordan, ICARDA, Aleppo, Syria. Itabari, J. K. (1999). Optimizing soil water use in the semi-arid areas of Kenya. Efficient soil water use: the key to sustainable crop production in the dry areas of West Asia, North and Sub-Saharan Africa. Proceedings of the 1998 (Niger) and 1999. 26.
Figure


Related documents
To disentangle the possible microbial interactions, we studied the feasibility of nitrate reduction through sulfide dependent autotrophic denitrification and AOM together
Overall, farmers are expected to save more than $1.6 billion per year in Federal income taxes, primarily from capital gains tax reductions ($725 million) and new child tax credits
More specifically, based on their strategic projects, Department of Excellence will have to report to IC West governance on: their capacity of achieving
m4 merupakan pembalikan bebas dari m1. Instrumen-instrumen yang digunakan pada bagian A ini yaitu instrumen suling.. yang memainkan melodi pokok, gitar, bas, dan kendang
GPLList signature(object = "GSE") : returns a list, each item of the list being a GPL object GSMList signature(object = "GSE") : returns a list, each item of the
We would expect that individuals who prioritize moral values might be more opposed to same-sex unions than those who prioritize other issues, particularly since the phrase
13 The low energy prices between mid‐1980s and early 2000s prompted most analysts to
The first step in our analysis is to calculate break-even inflation rates for each TIIS auction, or the rate of inflation at which the cost to the Treasury of issuing a TIIS
