Statistical Analysis of the Social Network and Discussion
Threads in Slashdot
Vicenç Gómez
[email protected]Andreas Kaltenbrunner
[email protected]Vicente López
[email protected]Barcelona Media Centre d’Innovació, Barcelona, Spain
Dept. Tecnologia (DTIC), Universitat Pompeu Fabra, Barcelona, Spain
ABSTRACT
We analyze the social network emerging from the user com-ment activity on the website Slashdot. The network presents common features of traditional social networks such as a gi-ant component, small average path length and high cluster-ing, but differs from them showing moderate reciprocity and neutral assortativity by degree. Using Kolmogorov-Smirnov statistical tests, we show that the degree distributions are better explained by log-normal instead of power-law distri-butions. We also study the structure of discussion threads using an intuitive radial tree representation. Threads show strong heterogeneity and self-similarity throughout the dif-ferent nesting levels of a conversation. We use these results to propose a simple measure to evaluate the degree of con-troversy provoked by a post.
Categories and Subject Descriptors
J.4 [Computer Applications]: Social and Behavioral Sci-ences—Sociology; G.2.2 [Mathematics of Computing]: Graph Theory—Network problems,Trees
General Terms
Human Factors, Measurement, Performance
Keywords
social networks, online communities, bulletin board, weblogs, h-index, log-normal, power-law, thread, radial tree
1.
INTRODUCTION
Message boards or web forums are online areas where dis-cussions are held by many users on a variety of topics. Some users post articles and other users can comment on these posts, forming a discussion thread or nested dialogue. Al-though the first message boards, USENET and the bulletin board system (BBS), date back to 1979 only recently the social networks emerging from the comment interaction be-tween their users have been studied [24, 14, 8].
In addition to this form of networks, message boards can show rich complexity in the structure of their discussion threads. Unlike personal weblogs which receive a few num-ber of replies [15], message board blogs can receive thou-sands of messages during a day. Previous studies of USENET
Copyright is held by the International World Wide Web Conference Com-mittee (IW3C2). Distribution of these papers is limited to classroom use, and personal use by others.
WWW 2008, April 21–25, 2008, Beijing, China. ACM 978-1-60558-085-2/08/04.
have been focused mainly on visualization techniques to fa-cilitate understanding of the social and semantic structure [20]. The Netscan system [22], a powerful interface to track discussion threads and authors, has proven to be a valu-able tool to understand different roles appearing in these newsgroups [6, 4]. It is therefore of interest to analyze the statistics governing the structure of threads in order to un-derstand the underlying patterns of communication existing in these large online spaces, and to develop efficient tech-niques which improve the system performance.
Here we have selected Slashdot1
, a popular technology-news website created in 1997 that publishes frequently short news posts and allows its readers to comment on them. Un-like other message boards, Slashdot has a community based moderation system that awards a score between−1 and +5 to every comment and upholds the quality of discussions by discouraging Spam and offensive comments [13]. Threads in Slashdot may trail for two weeks and one single post can easily exceed 200 contributions, which are mainly replies to other comments rather than direct responses to the original posts. These implicit relationships based on shared interests can be used to construct a network [24, 8] amenable to study typical macroscopic quantities of complex networks [18].
In previous studies [11, 12] the temporal patterns of the time differences between a post and its comments have been analyzed and notable regularities were found. Here we use the same dataset as in these studies, which represents one year of activity on Slashdot and consists of about 104
news posts which received 2,075,085 comments written by 93,636 users (see [12] for more details concerning the dataset).
We also characterize the discussion threads by studying several quantities associated to their radial tree structure. They show strong heterogeneity and self-similarity through-out the different nesting levels of a conversation. Based on these results, we propose a simple measure to evaluate the degree of controversy provoked by a post.
2.
THE SOCIAL NETWORK
We first explain the procedure used to create three dif-ferent versions of the network. Next, the values obtained for different indicators are analyzed with special emphasis on the degree distribution. Finally, we describe briefly the community structure.
2.1
Building the Network
We generate a social network based on the implicit rela-tions between the author of a comment and the user who
1
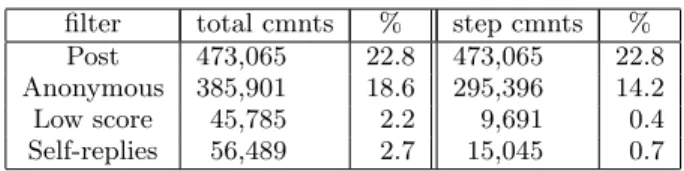
filter total cmnts % step cmnts % Post 473,065 22.8 473,065 22.8 Anonymous 385,901 18.6 295,396 14.2 Low score 45,785 2.2 9,691 0.4 Self-replies 56,489 2.7 15,045 0.7 Table 1: Comments discarded after proper filtering.
replies to it. To improve the quality and the representativ-ity of the resulting graph, we filter some of the comments according to the following four criteria:
1. The post: Under this assumption, no relations exist between the post’s author and its direct commentators, unless he also participates later in the discussion. 2. Anonymouscomments were also discarded.
3. We discard very low quality comments withscore−1. 4. Finally, we filter outself-replies, often motivated by a forgotten aspect or error fix of the original comment. The second and third column of Table 1 show the total num-ber and the percentage of comments which fall in each cat-egory. Columns 4 and 5 give number and percentage of comments discarded due to the above explained filter steps. Note that after elimination of direct replies to posts and anonymous comments, low-score comments only represent a small fraction.
After the filtering process, the remaining number of com-ments is 1,281,888, approximately 63% of the total. The users are reduced to 80,962, approximately 87% of the ini-tial set of users.
In a social network, each user corresponds a nodei∈V in a graphG=hV, Ei. Edges in our graph (i, j)∈E indicate social relations between two individuals, which are conse-quence of their comment activity. Letnij be the number
of times that useriwrites a comment to userj. Based on
nij, there are several ways to interpret when two users are
linked. To be as much systematic as possible, we compare three different types of networks according to the following interpretations:
Undirected dense : An undirected edge exists between usersiandjif eithernij > 0ornji>0. The weight
of that edgewij is simply the sumnij+nji.
Undirected sparse : An undirected edge exists between usersiandjifnij>0andnji>0. The weight of an
edgewijin this case is defined aswij= min{nij, nji}.
Directed : A directed edge exists from user ito userj if
nij>0 regardless ofnji. The weightwij=nij.
Figure 1 shows a small example to illustrate the generation of the three different graphs. On the left, there is a tree structure corresponding to a small thread of depth 4. La-bels denote the user who writes the contribution and valid comments are shown within the gray region. The post trig-gers four responses from users A, B, C and D. At the second nesting level, five comments appear (two from the same user E, one from user A (who already commented on the origi-nal post), and two more from users F and G. At the third level, there are only two comments from users A and C, and finally, there is one last comment from G.
The small graphs on the right correspond to the three graph versions. In Figure 1b, users are linked if they ex-change at least one message. In Figure 1c, bidirectional edges exists between users when both users replied a com-ment of the other. These reciprocal relations are the links in the undirected sparse graph. Note that we do not consider possible relations not associated to the thread structure like mentioning a user within the text of a comment. Semantic analysis would be required to overcome this limitation.
2.2
General Description
We now characterize the structural properties of the ob-tained graphs [18]. Table 2 shows the values of the indicators considered here for the different networks. If not stated oth-erwise, indicators are calculated for the unweighted graph.
In the first two rows we show the number of nodesN=|V|
and edgesM=|E|of the respective networks. In the case of the undirected sparse graph,Nis reduced significantly. The number of actual linksM is very small compared to the po-tential number of relationshipsO(N2
). This would suggest a highly sparse network with many connected components composed of small groups of users. However, as row 3 of Table 2 indicates, a vast majority of the population forms a “giant component”, leaving only a small proportion of users disconnected from that component. These isolated users are grouped mainly in pairs, or at most, in small clusters of size 4 in all three networks. In both undirected graphs, the “gi-ant component” contains more than 97% of the users and in the directed2
network almost 75%. These quantities in-dicate that the social network of Slashdot is characterized by a compact community and a small proportion of isolated users, in concordance with typical social networks.
The average degreehkiis shown in row 4 of Table 2 (stan-dard deviations between parenthesis). The directed network presents an intermediate value between the dense and sparse undirected representations. All cases show high standard deviations, indicating a big level of heterogeneity within the community. This aspect is analyzed in more detail in Sec-tion 2.3.
The average path lengthℓ, measured only for the giant component, takes small values for all three networks,
sug-2
We considerweakly connected components in the directed case, i.e. two verticesiandjbelong to the same component if there exists a path between i and j at least in one of the two possible directions. The size of the big cluster for strongly connected components is of course, smaller.
Figure 1: Example of graph generation. (a) A small thread of comments. (b) Undirected dense network. (c) Directed network. (d) Undir. sparse network.
Indicator Directed Und.Dense Und.Sparse N 80,962 80,962 37,087 M 1,052,395 905,003 294,784 Max.clust. 73.12% 97.90% 97.15% hki 13(50.1/49.4) 22.36(79.3) 7.95(25.7) ℓ 3.62(0.7) 3.48(0.7) 4.02(0.8) ℓrand 4.38 3.62 5.05 D 10 9 11 C 0.027(0.075) 0.046(0.12) 0.017(0.078) Cw 0.026(0.074) 0.047(0.12) 0.018(0.080) Crand 1.67·10 −4 2.88·10−4 2.27·10−4 r −0.016 −0.039 −0.016 ρ 0.28 − −
Table 2: Indicators of the Slashdot social networks.
gesting that the small-world property is present in all of them. The quantities are approximately one unit lower than the corresponding value for a random graphℓrand. The
max-imal distanceD between two users is also very small. Even for the undirected sparse case, it only takes a maximum of eleven steps to reach a user starting randomly from any other. These results are also in accordance with similar stud-ies of other traditional social networks.
To study the statistical level of cohesiveness we calculate the clustering coefficientC according to [23], and also its weighted versionCw[1]. We notice no significant differences
between them. Thus the number of messages interchanged between two users is not relevant to determine the cluster-ing level. The impact of havcluster-ing a weighted network is ana-lyzed in more detail in Section 2.5. We can see that for all graphs,CandCware about two orders of magnitude higher
than their randomized counterpartCrand. This is again in
harmony with other analysis of real-world networks, which report similar deviations from the random graph, and en-hances the evidence of the small-world property. As before, the directed graph represents an intermediate value between both undirected versions.
Another quantity of special interest in social networks is the degree correlation, or mixing coefficient, which allows to detect whether highly connected users are preferentially linked to other highly connected ones or not. This fact is known as assortative mixing by degree and is present in many social networks [19]. Table 2 shows the correlation coefficientr for our three networks, which is far from±1. Therefore, unlike traditional social networks which present a strong assortative mixing, Slashdot is characterized by nei-ther assortative nor dissortative mixing. Users do not show any preference to write comments in function of the connec-tivity of the other users. Interestingly, other related studies of online communities show similar [10, 8] coefficients. This seems to be a fundamental difference to social interactions occurring outside these large online spaces.
The last general property we analyze is the reciprocity. High reciprocity is another feature typically present in so-cial networks. In our case, reciprocity occurs when a user
i replies the answer of another userj to a previous com-ment ofi, and can be measured by means of a reciprocity coefficientρ. Using the method proposed in [7], we quantify how the Slashdot network differs from a random network in the presence of two mutual links (edges in both directions) between pairs of nodes. The small positive valueρ= 0.28
suggests that our network is only moderately reciprocal, so that users tend to write slightly more often than expected by chance to other users who previously wrote them.
From this global characterization we can conclude that the underlying network of Slashdot presents common features of traditional social networks, namely, a giant cluster of con-nected users, small average path length and high clustering. In contrast to other social networks, Slashdot shows moder-ate reciprocity and neutral assortativity by degree. We also see that there is significant difference between considering dense and sparse undirected versions, and that the directed version represents an intermediate description between the two. The moderate value of the reciprocity coefficientρ sug-gests that studying only the undirected network, one could miss some relevant structural information. Finally, regard-ing clusterregard-ing, we see no significant differences between the weighted and the binary network. Despite the strong simi-larity to a much smaller network of BBS-users [8], these two features seem to be exclusive of Slashdot.
2.3
Degree Distributions
We now focus on the function describing the number of users in the network with a given number of neighbors. The analysis of this degree distribution describes the level of interaction between users and provides a robust indicator about the grade of heterogeneity in the network.
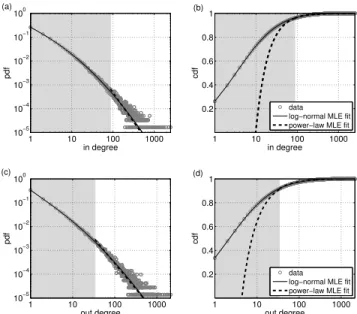
Figure 2 shows in small circles the probability distribution (pdf) and the cumulative distribution (cdf) of the degrees for the directed network. The other two networks present equiv-alent results. First, we can see that in and out degree dis-tributions are almost identical. Unlike previous studies [8], in our case the activities of writing and being replied could be characterized by similar processes.
As expected, the obtained distributions are heavy-tailed, covering in this case more than three orders of magnitude and indicating a high level of heterogeneity between the users. Surprisingly, the users located at the tail of the
distri-in degree pdf (a) 1 10 100 1000 10−5 10−4 10−3 10−2 10−1 100 in degree cdf (b) 1 10 100 1000 0.2 0.4 0.6 0.8 1 data log−normal MLE fit power−law MLE fit
out degree pdf (c) 1 10 100 1000 10−5 10−4 10−3 10−2 10−1 100 out degree cdf (d) 1 10 100 1000 0.2 0.4 0.6 0.8 1 data log−normal MLE fit power−law MLE fit
Figure 2: In and out degree distributions of the di-rected Slashdot network and corresponding PL and truncated LN approximations.
bution are not Slashdot authors of posts who also participate actively in the discussions, as one would expect. The first Slashdot author in the list sorted by degree appears at po-sition number 378 (in the case of the in-degree distribution of the directed network). Therefore, the hubs of the social network are not the “affiliated” authors, but regular users who participate actively in the discussions.
To find a functional form which best explains the ob-served data, we compare two approximations: the “usually assumed” power-law (PL) hypothesis, and a truncated log-normal (LN) hypothesis [16]. Their corresponding density functions are given by
fLN(x;µ, σ, θ) = 1 (x−θ)σ√2πexp „ −(ln(x−θ)−µ)2 2σ2 « and fP L(x;α, xmin) = x−α ζ(α, xmin) , whereζ(α, x) =P∞ n=0(n+x)
−α is the generalized or
Hur-witz zeta function. We select the optimal parameter values using maximum likelihood estimation (MLE). The PL dis-tribution has as parameters the scaling exponentαand the minimum degree valuexminfrom which the PL behavior
oc-curs. To find the proper value of xmin we apply a recent
method proposed in [5]. The LN distribution has three pa-rameters: the meanµ, the standard deviationσand a shift
θ, which represents a lower bound of the degree values. Both distributions can be very similar [16].
Figure 2 shows that for the case of the PL hypothesis (dashed-bold line), the obtained values ofxmin(represented
by the border between gray and white areas) are extremely large, leaving almost all the data samplesoutside the fitted region, which contains only a few users at the tail of the distribution. However, the LN fit provides an explanation of theentire dataset, of both, the left-support of the distri-bution, where most of the probability mass is concentrated, and also in the tail of the distribution, where fluctuations are bigger due to finite sampling effects.
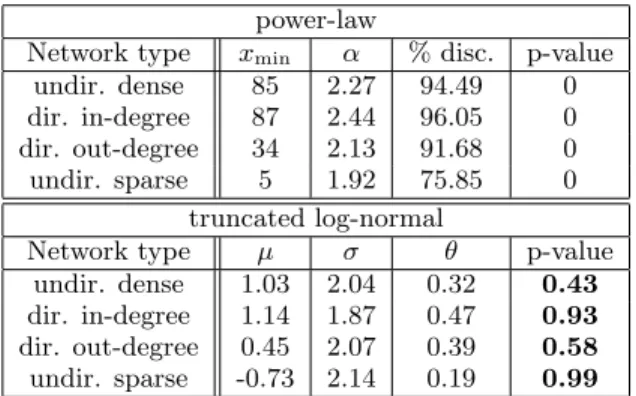
Table 3 summarizes the results of the fits of the degree distributions. The first two columns of the upper part of Table 3 show the parameters of the PL distribution. The minimum value ofxminis 5, corresponding to the undirected
sparse version. Even in this case, more than 75% of the users are not included in the PL fit. The proportion of discarded samples is indicated in the third column. The lower part of Table 3 gives the parameters of the LN approximation, which show more variability than those of the PL.
power-law
Network type xmin α % disc. p-value
undir. dense 85 2.27 94.49 0 dir. in-degree 87 2.44 96.05 0 dir. out-degree 34 2.13 91.68 0 undir. sparse 5 1.92 75.85 0
truncated log-normal
Network type µ σ θ p-value
undir. dense 1.03 2.04 0.32 0.43 dir. in-degree 1.14 1.87 0.47 0.93 dir. out-degree 0.45 2.07 0.39 0.58 undir. sparse -0.73 2.14 0.19 0.99 Table 3: PL and LN fit of degree distribution.
After selecting the optimal values of the parameters for both hypothesis, we test whether the provided model of the data can be accepted or not. We use the Kolmogorov-Smirnov test (KS), whose p-values are shown in the last column of Table 3. In all cases, the PL hypothesis provides a p-value much lower than 0.1 (our choice of the significance level of the KS-test). Hence, we can conclude that, even after discarding most of the data, the PL is not able to ex-plain the tail of the distributions. In contrast, the obtained p-values for the truncated LN model are quite high, all of them bigger than 0.1, so the LN-hypothesis allows to explain the entire distribution.
2.4
Mixing by Score
In Section 2.2 we have seen that the Slashdot network presents neutral mixing by degree. It is interesting to an-alyze whether Slashdot users show assortative mixing by other attributes. In this subsection, we associate to each user a score, which is calculated by averaging over all the scores of the comments of the same user. This quantity al-lows us to differentiate high-quality writers (those with high mean score) from regular-quality writers.
The initial score of a comment is generally 1 if it comes from a registered user or 0 if it is anonymous3
. Moderation can modify the initial score to any integer within the range [−1,5]. To ensure a representative subset of the network, we only consider users who wrote at least 10 comments, a total of 18,476 users, representing approximately 23%.
In Figure 3a we plot the histogram and the corresponding cdf of the distribution of the mean scores. Note that the minimum score is 0, since we eliminate −1 comments. The distribution shows an unexpected bimodal profile, with two peaks at mean scores 1.1 and 2.3. This indicates that two different classes of users coexist.
Is the mean score a representative measure of the user’s commenting quality? To check its validity we plot in Fig-ure 3b the distribution of the standard deviations of the scores. More than 3/4 of all users show deviations smaller than 1, so the scores a user obtains do not fluctuate signifi-cantly. Therefore, their mean seems to be a good candidate to characterize the user.
3
Anonymous users cannot be considered in this analysis.
0 1 2 3 4 5 0 500 1000 1500 2000 2500 mean score num users (a) c 1 users c2 users 0 1 2 3 4 5 0 0.25 0.5 0.75 1 cdf mean score 00 0.5 1 1.5 2 2000 4000 stdev score num users (b) 0 1 2 0 0.5 1 cdf stdev score −10 0 1 2 3 4 5 2 4 score
avg. num. replies
(c) all users c 1 users c 2 users
Figure 3: (a) Mean scores of users who wrote at least 10 comments. (b) Standard deviations of the mean scores of the same users. (c) Relation between the score of a comment and the average number of received replies for all, c1 and c2 users.
We now analyze whether users of one class reply prefer-entially to users of the same class or not. The bimodality suggests a simple characterization using two classes of users. We select the boundary between classes to balance their sizes (the resulting boundary is 1.90). Thus a given user is as-signed to classc1 if its mean score is≤1.90, and otherwise
to classc2. Classc1contains 9,254 users whereasc2contains
9,222. The assortativity matrixEis calculated counting the number of comments interchanged between classes. Each el-ementEij indicates the number of comments that users of
classiwrote to users of classj. Its normalized versionE′
is obtained dividingEby the total number of comments:
E= „ 78,341 198,391 151,013 455,997 « E′ = „ 0.09 0.22 0.17 0.52 « .
The assortativity coefficient isrscore= 0.036, so the network
is neutrally mixed by mean score. Note, however, that more than half of the comments are written from users of class
c2 to other c2 users, and that the proportion of comments
received byc2users is 0.74, so there is a strong bias in favour
of good writers.
This can either mean that users tend to reply preferen-tially to users of the class with higher average score, or sim-ply that high-scored comments tend to receive more reac-tions than low-scored ones independently of the user. To check this, we compare in Figure 3c the average number of replies received by comments in function of their scores for either all users or only the users of classesc1andc2. To get
a broader range of scores, we also include negative scores. It is quite clear that scores≥2 correlate with the average number of reactions and are independent of the user’s class, but comments with scores below 2 do not show this corre-lation and achieve substantially more replies on average if written by users of classc2.
We can thus conclude that on average, although higher scored comments tend to achieve more replies regardless of the user who wrote it, it is also true that good writers, even when they post low-scored comments, still receive significant more replies thanc1users.
2.5
Community Structure
To end this characterization of the Slashdot network we analyze its community structure. We take a simple approach based on agglomerative clustering which takes benefit from the weighted nature of the Slashdot network [18]. We choose the dense undirected network and start our procedure with each node as an independent cluster. Letλdenote the num-ber of comments, so that pairs of users (i, j) who interchange a number of commentswij≥λare included in the network,
and the other connections are discarded. Starting from the biggest valueλ=λmaxand progressively decreasing it, users
are connected incrementally and communities can be ob-tained. This simple procedure is equivalent to building a dendrogram and allows to browse through the community structure at different scales by changing the parameterλ.
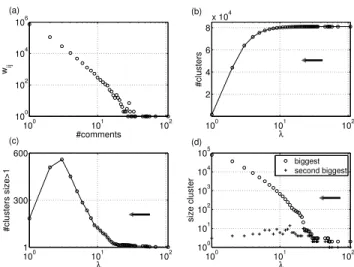
Figure 4a shows the distribution of the weightswij of all
links in the network. The vast majority of pairs of users only exchanges a small number of comments whereas a few of them really maintain intense dialogues during the year. This seems to be the reason why previous properties such as the clustering coefficient do not show significant differ-ences between the weighted and the unweighted network. The most discussing pair of users exchanged a total of 108
100 101 102 100 102 104 106 #comments wij (a) 100 101 102 2 4 6 8 x 10⁴ λ #clusters (b) 100 101 102 1 300 600 (c) λ #clusters size>1 100 101 102 100 101 102 103 104 105 λ size cluster (d) biggest second biggest
Figure 4: Results of the agglomerative clustering. (a) Distribution of weights (number of messages be-tween pairs of users). (b) Number of clusters in function of λ and (c) considering only clusters of size >1. (D) Size of the two biggest clusters.
comments. This represents our initial value λmax to start
the agglomerative procedure.
Since most of users exchange only a small amount of com-ments, one would expect that the number of clusters remains quite high for a wide range of λ values. This is indeed the case. As λ is progressively decreased, users are being grouped in small clusters. Simultaneously, a giant cluster is being formed which absorbs the small clusters when they reach a moderate size. In Figure 4b we plot the number of clusters in function ofλ. It is reduced dramatically in the last step when λ = 1 is reached. A more detailed analy-sis can be obtained if we discard isolated users, and focus only on groups of pairs or more users, who at least inter-changed one comment. This is shown in Figure 4c. We can see that for high values of λ, the number of groups of size two or more is very small. Then it starts to grow signifi-cantly around λ∼ 10, reaches a maximum at λ= 3, and then again falls to the number of components of the original graph (considering all links). We also plot in Figure 4d the sizes of the two biggest components in function of λ. We can see that the biggest component grows very fast and the second biggest remains small, showing evidence of a giant cluster present in all scales.
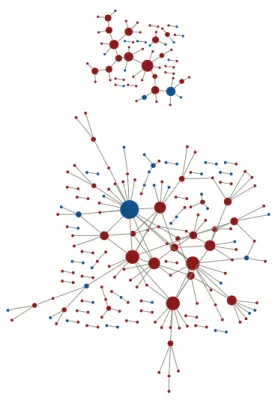
We can track the resulting communities and show the net-works at each λ. This is roughly illustrated in Figure 5, where two snapshots of the agglomerative process are shown. Figure 5 (top) corresponds to a high value ofλ= 20, where a small backbone of the most connected users is starting to grow. Note that users are colored according to their score attribute (see Section 2.4). Users corresponding to the sec-ond class (high-quality commentators) are colored in red. Clearly, the backbone of Slashdot users is formed mainly by high-quality commentators. Forλ= 15 (Figure 5 bottom), the most connected users receive even more connections and form the giant component. A few clusters of small sizes which still do not have grown sufficiently to be merged with the big community are also present.
Figure 5: Two snapshots of the network for
λ = 20,15. Nodes are colored according to their score class (red: high quality, blue: medium qual-ity). For clarity, we only show clusters of size>1.
0 20 40 60 80
100 102
max. comments same user
num posts (a) 100 101 102 0 0.2 0.4 0.6 0.8 1
max. comments same user
cdf
µ = 1.85
σ = 0.56 p−value = 1.00 (b)
Figure 6: (a) Histogram of the maximum number of comments of onesingle user per post. Solid line corresponds to the best LN fit (b) cdf.
3.
STRUCTURE OF THE DISCUSSIONS
After analyzing the social network of Slashdot, we focus on the question about how information is structured within a discussion thread. A thread starts with the publication of a post, which in turn triggers an amount of activity in the form of comments. In this section, we present a statistical characterization of the structure of such discussions using a useful and intuitive radial tree representation. This repre-sentation leads naturally to a measure which can be useful to evaluate the degree of controversy of a given post.
An initial picture of the activity generated by posts can be found in previous studies [12]. Posts receive on average approximately 195 comments and there exists a clear scale in the number of comments a post can originate. Half of them receive less than 160 contributions. A small number of highly discussed ones, however, can trigger more than one thousand contributions.
The number of comments gives an idea of how the partic-ipation is distributed among the different articles, but is not enough to quantify the degree of interaction. For instance, a post may incite many readers to comment, but if the author of a comment does not reply the responses to his comment, there is no reciprocal communication within the thread. In this case, although users can participate significantly, we can hardly interpret that the post has been highly discussed. On the other hand, a post with a small number of contributors but with one long dialogue chain will evidence a high degree of reciprocal interaction (albeit its general interest may be reduced). At the description level of the social network, the reciprocity coefficientρand the agglomerative clustering de-scribed in the previous section already represent a measure to explain the degree of (reciprocal) interaction. At the de-scription level of the individual post, a possible measure to quantify this type of interaction is the maximum number of comments written by a single user to a particular post.
We show this quantity (excluding theanonymous users) versus the number of posts, i.e. how many posts exist with a certain maximum number of comments written by the same user, in Figure 6. The obtained distribution has a peak at 4. As the cdf indicates, for approximately half of the posts at least one single user participates 5 times or more in the discussion. The log-normal shape of the distribution sug-gests a multiplicative process underlying the generation of this quantity. This indicates a strong heterogeneity and level of interaction within discussion threads. Users do not only give an opinion, but also interchange a significant quantity of messages, and the intensity of this interaction varies con-siderably throughout the different posts. We now study in more detail their intrinsic tree structure.
3.1
Radial Tree Representation
The high number of comments elicited by controversial posts makes them difficult to explore and to find relevant contributions within the nested dialogues. The current inter-face of Slashdot offers a filtering mechanism based on scores. By default, direct comments to a post rated 1 or higher are fully shown. For deeper nesting levels, comments can be fully shown (score 4 or above), abbreviated (score between 1 and 4) or hidden (score below 1).
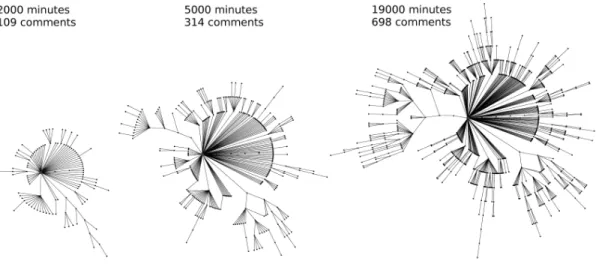
We propose a natural representation of thread discussions which takes advantage of their structure. Consider a post as a central node. Direct replies to this post are attached in a first nesting level and subsequent comments at increasing nesting levels in a way that the whole thread can be con-sidered as a circular structure which grows radially from a central root during its lifetime, aradial tree. Figure 7 shows three snapshots of a radial tree associated to a controversial post which attracted a lot of users. An analog example of a less discussed post can be seen in Figure 8. More exam-ples of trees are shown in Figure 9. Their profiles are highly heterogeneous. In some examples, only a huge number of contributions without replies appear in the first level, re-sulting in trees with high widths but small depths. In other examples, however, there are only discussions between two users who comment alternatively giving rise to very deep trees with small widths. Sometimes, the intensity of the discussion is translated to one of the branches because of a controversial comment which triggers even more reactions than the original post (e.g the post in the center of Figure 9).
Figure 7: An example of radial tree structure corresponding to a controversial post related to Windows and Linux which received a total of982comments. The title of the post is“Can Ordinary PC Users Ditch Windows
for Linux?”. Figures show three snapshots in different times.
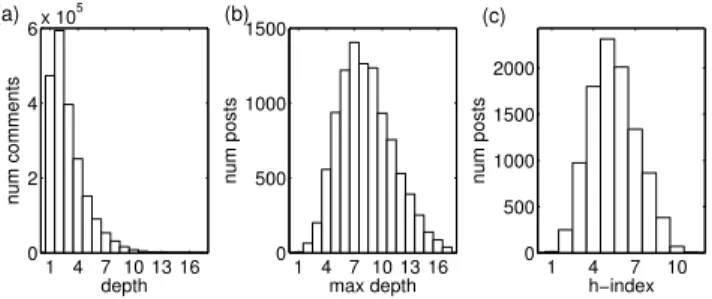
Apart from being a useful tool for browsing and examining the contents of a highly discussed post, radial trees can be used to describe statistically how information is structured in a thread. In Figure 10a we plot the distribution of all the extracted comments per nesting level for all posts. This gives an idea about the relation between the width versus the depth of the trees. The first two levels contain most of the comments and then their number decays exponen-tially in function of the depth. The maximum depth was 17. A general pattern which seems to be common to all threads is formed by a broad first nesting level of contribu-tions, followed by a second, even wider set, and finally an exponential decay. This fact is reflected in the peak at depth two of the plot and the decreasing number of comments for deeper nesting levels. This gives evidence of the transient nature of the discussions. The reason behind this pattern is apparently related with an initial growth of interest which is reduced after users may have exposed all their knowledge, or translated to a more recent article. Only those who have engaged a dialogue will keep writing in subsequent levels. This decay could also be explained because of accessibil-ity awkwardness, since the visibilaccessibil-ity of a comment can be proportional to its depth. The previous result would sug-gest that the majority of posts does not reach high nesting levels, and one would expect a similar distribution for the
Figure 8: Radial tree structure of a little commented post which received133comments in total. Its title
is“Amazon One-Click Patent to be Re-Examined”.
maximum depth of the posts. However, as Figure 10b indi-cates, the distribution of maximum depths does not follow the same pattern. It is almost symmetrical, weakly skewed toward smaller maximum depths. Although comments are concentrated in the first levels, threads typically reach a depth around 7.
Up to now, the quantities analyzed do not capture the apparent heterogeneity of the discussion threads we have reported in previous examples (see Figure 9). We now take
1 4 7 10 13 16 0 2 4 6x 10 5 depth num comments (a) 1 4 7 10 13 16 0 500 1000 1500 max depth num posts (b) 1 4 7 10 0 500 1000 1500 2000 h−index num posts (c)
Figure 10: Results of (a) Number of comments per nesting level. (b) Number of posts per maximum
depth. (c) Number of posts per h-index.
a look on how the comments are generated within a given nesting level. This analysis can be performed extracting the branching factors b, that is, the number replies pro-voked by a given comment (or a given post). Figure 11 shows in log-log scale the distributions ofbfor the first five nesting levels. Level 0 corresponds to direct comments to the posts, whereas subsequent plots correspond to replies to comments. First, the range of possible values spans almost three orders of magnitude for direct comments and is con-siderable for subsequent nesting levels, which gives evidence of the high heterogeneity underlying the discussion threads. Second, there is a clear discrepancy between commenting level 0 and subsequent ones. While the distribution of di-rect replies follows quite closely a bell-shape in the log-log domain, subsequent levels have an always decreasing prob-ability. This illustrates the different nature of the process underlying the generation of comments to the initial post and the generation of replies to other comments. Interest-ingly, this variation is not reported in subsequent nesting levels. In addition, no dependency of the score on the nest-ing level could be found (data not shown). Although the resulting threads can take very different forms as we have previously shown, the same generative process seems to be taking place at all nesting levels. The bell-shaped curve of the first level branching factors, and the curvature in subse-quent levels in log-log scales suggest again a good LN fit to
100 101 102 103 10−4 10−3 10−2 Level 0 b probability µ=3.59 σ=0.74 pval=0.00 100 101 102 10−5 10−4 10−3 10−2 10−1 Level 1 b probability µ=0.41 σ=0.99 pval=0.00 100 101 102 10−5 10−4 10−3 10−2 10−1 Level 2 b probability µ=−0.45 σ=1.03 pval=0.14 100 101 102 10−5 10−4 10−3 10−2 10−1 Level 3 b probability µ=−0.61 σ=1.00 pval=0.28 100 101 102 10−5 10−4 10−3 10−2 10−1 Level 4 b probability µ=−0.49 σ=1.02 pval=1.00
Figure 11: Distributions of branching factorsb in 5 levels. Level0shows direct comments to posts.
Figure 12: (a) Thread with many comments in the first level, but a few in subsequent levels. (b) Thread with a intense debate between two users.
explain the observed data, indicated by continuous lines in Figure 11. However, according to the p-values of KS-tests, the LN hypothesis is only accepted for levels deeper than 2.
3.2
The H-index as a Structural Measure of
Controversy
In this subsection we will use the previous results to mea-sure the degree of controversy of a post. As before, our ap-proach does not consider semantic features and only relies on its structural information. It is important to note that a definition ofcontroversial is necessarily subjective. How-ever, indicators such as the number of comments received or the maximum depth of the discussions can be, among oth-ers, good candidate quantities to evaluate the controversy of a post, but suffer from some drawbacks as we will explain in what follows. We therefore seek for a measure, as sim-ple as possible which incorporates as many of these factors and is able to rank a set of posts properly. The number of comments alone does not tell us much about the structure of the discussion. There might be a lot of comments in the first level but very little real discussions, such as in the post of Figure 12a. A better measure for the controversy of a post seems to be the maximum depth of the nesting. But again that measure has some drawbacks. Two users may become entangled in some discussion without participation of the rest of the community, increasing the depth of the thread. The example of Figure 12b illustrates this case. We thus want to overcome both types of bias.
We propose to quantify the degree of controversy associ-ated to a post using an adapted version of the h-index [9], commonly used to characterize the scientific output of re-searchers. The papers of a researcher are ordered by their number of citations in descending order and the h-index is then defined as the maximum rank-number, for which the number of citations is greater or equal to the rank number. It represents a fair quantity which considers the number of papers published by the scientist and their visibility, or how often these papers are cited by other scientists. Some exten-sions of this index have been proposed as an alternative to the impact-factor of journals and conferences [3, 21]. See [2] for more details and a review on literature about the h-index. For our purposes, we will define the h-index in the follow-ing way: given a radial tree correspondfollow-ing to a discussion thread and its comments organized in nesting levels, the h-indexhof a post is then the maximum nesting leveliwhich has at leasth > icomments, or in other words,h+ 1 is the
1 23 4 5 67 8 9 1011 500 1000 1500 0 200 400 600 800 h−index num comments num posts h−index num comments 1 2 3 4 5 6 7 8 9 1011 500 1000 1500 200 400 600 800
Figure 13: h-index versus number of comments.
1 23 4 5 67 8 9 1011 5 10 15 0 200 400 600 h−index max depth num posts h−index max depth 1 2 3 4 5 6 7 8 9 1011 5 10 15 0 200 400 600
Figure 14: h-index versus maximum depth.
first nesting leveliwhich has less thanicomments. Turn-ing back to Figure 12b, we can easily calculate the h-index. There are 9 comments in both first and second levels, 6 com-ments in the third level and 3 comcom-ments in the fourth level, which gives an h-index of 3. This post has maximum nest-ing level of 17, and it is ranked first if only the maximum depth is considered, but drops down to the position 9,239 using the h-index. Similarly, the post of Figure 12a, which received 161 comments, has just an h-index of 3, because most of the comments are located in the upper levels. The post falls 4,412 positions from a ranking based only on the number of comments to its rank based on the h-index.
Figure 10c shows a histogram with the number of posts with a given h-index. This distribution is less skewed than those of the number of comments and the maximum depth (compare with Figures 10a and 10b). In Figures 13 and 14 we plot a 3D chart to compare both, number of comments and maximum depth, against the h-index.
Although we observe an evident correlation between both quantities (more pronounced in the maximum depth) there exist posts which receive a lot of comments but interestingly do not have a significant h-index. This is even more evident when comparing h-index and maximum depth.
Since many posts share the same h-index, we need a way to break the ties. In this situation, we prioritize posts which reach a certain h-index with less comments. Thus, our final
proposed measure uses as a first ranking criteria the h-index and as second the inverse of the number of comments. For a postiwe use the following formula to rank it:
ri= h-indexi+
1 num commentsi
.
The first 15 posts according to this ranking can be seen in Table 4. We also show their ranks if only their number of comments or their maximal discussion depth would have been considered. In the latter case, we choose as well the number of comments to break the ties.
4.
CONCLUSIONS
Our analysis represents a step toward the understanding of the structure of networks in which relations are hidden and more generic than explicit, well-defined links such as friendships or affiliations. The Slashdot network exhibits some special features that deviate from traditional social networks: neutral mixing by degree, almost identical in and out degree distributions, only moderated reciprocity, and absence of a complex community structure. We conjecture that most of the reactions in Slashdot arise when high diver-sity in opinions occur. Users are therefore more inclined to be linked to people who express different points of view [17]. The nature of this interaction seems to be a key aspect to understand the obtained results.
Unlike the BBS network [24, 8] where discussions are un-restricted, the scoring system of Slashdot guarantees a high quality and representativity of the social interaction. This particular feature allowed us to find a correlation between scores and number of received replies and to distinguish clearly between two classes of users: good writers who, on average achieve high scores for their comments, and regular writers. The number of replies of a comment depends mostly on its quality (the score it achieved) but we find some weak evidence for user reputation influencing the connectivity in the network. Good writers are more likely than regular ones to receive replies to occasional comments with low scores. However, this effect is not strong enough to cause assorta-tive mixing by score since the opposite is not true. Regular writers can expect a similar number of replies as good writers to their comments with high scores, so there is no negative effect of a user’s reputation.
When analyzing the tree structure generated by the nest-ing of comments, we find interestnest-ing properties such as self-similarity within the different nesting levels of a discussion. This suggests that, despite the strong heterogeneity in the shapes of the discussions visible in their radial tree represen-tation, a simple depth-invariant mechanism exists which is responsible for their evolution. A detailed study of the dy-namics governing the growth of nested discussions is a topic of ongoing research.
To measure the degree of controversy of a discussion, a recent approach [15] trains a classifier using features that combine semantic and structural information. Our proposed measure, based on the h-index, appears to be a more con-venient indicator because of its simplicity, objectivity and robustness. It can be calculated efficiently and is monotonic (it never decreases), which makes it also a stable quantity to monitor and rank a discussion thread while it is still alive and receiving contributions. However, human based visual validation is necessary to check how it correlates with sub-jective sensation of controversy.
# H Num cmnts (#) Depth (#) Title
1 11 527 (401) 16 (113) Violating A Patent As Moral Choice 2 11 529 (390) 12 (1374) Human Genes Still Evolving
3 11 605 (208) 16 (120) Powell Aide Says Case for War a ’Hoax’
4 11 693 (96) 17 (34) US Releasing 9/11 Flight 77 Pentagon Crash Tape 5 10 243 (3287) 15 (159) Apple Fires Five Employees for Downloading Leopard 6 10 288 (2431) 14 (356) Linus Speaks Out On GPLv3
7 10 290 (2409) 11 (1774) New Mammal Species Found in Borneo 8 10 309 (2078) 13 (698) Biofuel Production to Cause Water Shortages? 9 10 315 (1999) 12 (1168) Torvalds on the Microkernel Debate
10 10 355 (1511) 17 (17) Well I’ll Be A Monkey’s Uncle 11 10 361 (1446) 13 (747) Windows Vista Delayed Again
12 10 366 (1394) 14 (416) NSA Had Domestic Call Monitoring Before 9/11? 13 10 367 (1379) 11 (1922) Unleashing the Power of the Cell Broadband Engine 14 10 380 (1279) 12 (1238) Making Ice Without Electricity
15 10 384 (1243) 14 (424) Evidence of the Missing Link Found?
Table 4: Top-15 controversial posts according to our proposed measure and corresponding positions according to the number of comments and maximum depth rankings.
5.
ACKNOWLEDGMENTS
We thank the reviewers for their valuable suggestions and C`atedra Telef`onica de Producci´o Multim`edia for funding.
6.
REFERENCES
[1] A. Barrat, M. Barth´elemy, R. Pastor-Satorras, and A. Vespignani. The architecture of complex weighted networks.Proc. Natl. Acad. Sci. USA,
101(11):3747–3752, March 2004.
[2] L. Bornmann and H. D. Daniel. What do we know about the h index? J. Am. Soc. Inf. Sci. Tech., 58:1381–1385, 2007.
[3] T. Braun, W. Glanzel, and A. Schubert. A
Hirsch-type index for journals.Scientist, 19:8–8, 2005. [4] A. B. Brush, X. Wang, T. C. Turner, and M. A.
Smith. Assessing differential usage of usenet social accounting meta-data. InProc. SIGCHI ’05, pages 889–898, New York, NY, USA, 2005. ACM. [5] A. Clauset, C. R. Shalizi, and M. E. J. Newman.
Power-law distributions in empirical data. arXiv:0706.1062, June 2007.
[6] D. Fisher, M. Smith, and H. T. Welser. You are who you talk to: Detecting roles in usenet newsgroups. In Proc. HICSS ’06, Washington, USA, 2006. IEEE CS. [7] D. Garlaschelli and M. I. Loffredo. Patterns of link
reciprocity in directed networks.Phys. Rev. Lett, 93(26):268701, 2004.
[8] K.-I. Goh, Y.-H. Eom, H. Jeong, B. Kahng, and D. Kim. Structure and evolution of online social relationships: Heterogeneity in unrestricted discussions.Phys. Rev. E, 73(6):066123, 2006. [9] J. E. Hirsch. An index to quantify an individual’s
scientific research output.Proc. Natl. Acad. Sci. USA, 102(46):16569–16572, 2005.
[10] P. Holme, C. R. Edling, and F. Liljeros. Structure and time evolution of an internet dating community.Social Networks, 26(2):155–174, 2004.
[11] A. Kaltenbrunner, V. G´omez, and V. L´opez. Description and prediction of Slashdot activity. In Proc. 5th Latin American Web Congress (LA-WEB 2007), Santiago de Chile, 2007. IEEE CS.
[12] A. Kaltenbrunner, V. G´omez, A. Moghnieh, R. Meza, J. Blat, and V. L´opez. Homogeneous temporal activity patterns in a large online communication space. In Proc. BIS 2007 Workshop on Social Aspects of the Web (SAW 2007). Poland, 2007.
[13] C. Lampe and P. Resnick. Slash(dot) and burn: Distributed moderation in a large online conversation space. InProc. SIGCHI ’04, pages 543–550, New York, USA, 2004. ACM.
[14] N. Matsumura, D. Goldberg, and X. Llora. Mining directed social network from message board. InProc. 14th WWW ’05, pages 1092–1093, New York, USA. ACM Press., 2005.
[15] G. Mishne and N. Glance. Leave a reply: An analysis of weblog comments. InThird Annual Workshop on the Weblogging Ecosystem: Aggregation, Analysis and Dynamics (WWW’06), Edumburg, UK, May 2006. [16] M. Mitzenmacher. A brief history of generative models
for power law and lognormal distributions.Internet Mathematics, 1(2):226–251, 2003.
[17] R. Munroe, 2008. http://xkcd.com/386/. [18] M. E. J. Newman. The structure and function of
complex networks.SIAM Review, 45(2):167–256, 2003. [19] M. E. J. Newman and J. Park. Why social networks
are different from other types of networks.Phys. Rev. E, 68(3):036122, 2003.
[20] W. Sack. Discourse diagrams: Interface design for very large-scale conversations. InProc. HICSS ’00. Volume 3, page 3034, Washington, DC, USA, 2000. IEEE CS. [21] A. Sidiropoulos and Y. Manolopoulos. Generalized
comparison of graph-based ranking algorithms for publications and authors.Journal of Systems and Software, 79(12):1679–1700, 2006.
[22] M. Smith. Tools for navigating large social cyberspaces.Commun. ACM, 45(4):51–55, 2002. [23] D. J. Watts and S. H. Strogatz. Collective dynamics of
small-world networks.Nature, 393(6684):440–442, 1998.
[24] K. Zhongbao and Z. Changshui. Reply networks on a bulletin board system.Phys. Rev. E, 67(3):036117, 2003.