Mortgage Dollar Roll
∗
Zhaogang Song
†Federal Reserve Board
Haoxiang Zhu
‡MIT Sloan School of Management
March 13, 2014
Preliminary. Comments Welcome
Abstract
Mortgage dollar roll is the most important trading strategy for investors to finance their positions in agency mortgage-backed securities (MBS). The “specialness” of dollar roll is the extent to which the implied dollar roll financing rates fall below prevailing market interest rates. This paper provides the first analysis of dollar roll specialness in agency MBS markets, using a large panel dataset from July 1998 to July 2013. We show that the dollar roll specialness increases in prepayment risks (proxied by primary mortgage rates and “burn-out effect”) and decreases in MBS supply. The expected returns of agency MBS decrease in their dollar roll specialness. We find evidence that the Federal Reserve’s large-scale asset purchase (LSAP) increases dollar roll specialness by pushing down mortgage rates, but not by reducing the effective supply of MBS.
Keywords: MBS, Mortgage Dollar Roll, TBA, Specialness, LSAP, Repo JEL classification: G12, G18, G21, E58
∗First version: January 2014. We thank Katy Femia, Akash Kanojia, Guohua Li, and Clara Vega for
helpful discussions and comments. The views expressed here are the authors’ and do not necessarily reflect those of the Board of Governors of the Federal Reserve System.
†Board of Governors of the Federal Reserve System, Mail Stop 165, 20th Street and Constitution Avenue,
Washington, DC, 20551. E-mail: [email protected].
Mortgage Dollar Roll
March 13, 2014
Abstract
Mortgage dollar roll is the most important trading strategy for investors to finance their positions in agency mortgage-backed securities (MBS). The “specialness” of dollar roll is the extent to which the implied dollar roll financing rates fall below prevailing market interest rates. This paper provides the first analysis of dollar roll specialness in agency MBS markets, using a large panel dataset from July 1998 to July 2013. We show that the dollar roll specialness increases in prepayment risks (proxied by primary mortgage rates and “burn-out effect”) and decreases in MBS supply. The expected returns of agency MBS decrease in their dollar roll specialness. We find evidence that the Federal Reserve’s large-scale asset purchase (LSAP) increases dollar roll specialness by pushing down mortgage rates, but not by reducing the effective supply of MBS.
1
Introduction
Agency mortgage-backed-securities (MBS) guaranteed by Ginnie Mae (GNMA), Fannie Mae (FNMA), and Freddie Mac (FHLM) form a major component of the U.S. fixed-income mar-ket. The combined market value of outstanding securities is about $5.75 trillion as of June 2013, around half of the outstanding $11.39 trillion of U.S. Treasury securities, according to the Securities Industry and Financial Markets Association (SIFMA).1,2 Agency MBS trade in over-the-counter markets, with over 90% of the trading volume occurring in a unique liquid forward market, which is known as the to-be-announced (TBA) market. In a TBA trade, the buyer and seller decide general trade parameters, such as agency, coupon, original mortgage term, par amount, and price, but the buyer does not know which MBS the seller will deliver until two days before the settlement.
A mortgage dollar roll is the combination of two TBA contracts, one front month and one future month. It is the most important trading strategy in the TBA market, amounting for up to two-thirds of the trading volume in the TBA market. In a dollar roll transaction, the “roll seller” sells a MBS in the front month TBA contract and simultaneously buys a MBS in the future month TBA contract with thesame TBA characteristics, at specified prices. A roll buyer does the opposite. Because of its close integration with the TBA trading convention, mortgage dollar roll is the most widely used trading mechanism by which investors in MBS markets finance their positions in agency MBS and hedge their existing exposures.
An important feature of a dollar roll transaction, relative to a repo transaction using the same MBS, is that securities changing hands in the two legs of the trade need not be the same, but only “substantially similar.”3 For example, the dollar roll contract can specify
that the deliverable MBS must be guaranteed by Fannie Mae, with the original loan term of 30 years and a coupon of 4% per year. But it does not specify a particular pool of mortgages underlying the MBS or particular CUSIPs. Therefore, dollar rolls have substantial embedded delivery options. It is generally expected that the roll buyer will deliver the cheapest MBS
1Throughout the paper, the term MBS refers only to residential mortgage-backed-securities rather than
those backed by commercial mortgages, unless otherwise noted.
2Ginnie Mae, Fannie Mae, Freddie Mac stand for the Government National Mortgage Association, Federal
National Mortgage Association, and Federal Home Loan Mortgage Corporation, respectively. Ginnie Mae is a wholly-owned government corporation within the Department of Housing and Urban Development. Usually called Government-Sponsored Enterprises (GSEs), Fannie Mae and Freddie Mac were private entities with close ties to the U.S. government before September 2008, and have been placed in conservatorship by the Federal Housing Financing Agency and supported by the U.S. Treasury department since then.
3The criterion of “substantially similar” is defined in the American Institute of Certified Public
Accoun-tants State of Position 90-3 such that the original and returned MBS should be of the same agency, original loan term, and coupon rate, and both should satisfy Good Delivery requirement set by SIFMA.
under the TBA cohort to the roll seller, which is usually referred to as cheapest-to-deliver (CTD). An MBS can be cheap if it has suffered from heavy prepayment (hence a lower market value per face value) or if it is simply illiquid. Therefore, upon selling an MBS in the front-month leg of the trade, the roll seller must take into account this redelivery risk; the higher is this risk, the lower she agrees to pay in the future-month leg of the transaction. The settlement prices in the two legs of the dollar roll transaction can also be affected by the market liquidity of the MBS.
The risks associated with entering a dollar roll transaction can be summarized by the “specialness” of a dollar roll. The dollar roll specialness is the focus of our study. By construction, a dollar roll is essentially a collateralized borrowing contract, with the roll seller being the cash borrower, except that the MBS delivered by the roll seller as collateral can be replaced by the roll buyer with another, potentially inferior MBS upon the maturity of the loan. Although a dollar roll transaction does not specify the collateralized borrowing rate explicitly as a repo contract does, a dollar roll has an implied financing rate that can be computed from the price difference (known as the “drop”) between the front and future month TBA contracts, the scheduled principal and interest payments of the MBS, and the projected one-month prepayment rate. A dollar roll is “on special” if the implied financing rate is lower than the prevailing market interest rate, such as the general-collateral repo rate on the MBS or unsecured rates like LIBOR. The specialness of a dollar roll is hence a key indicator of funding condition in agency MBS markets.
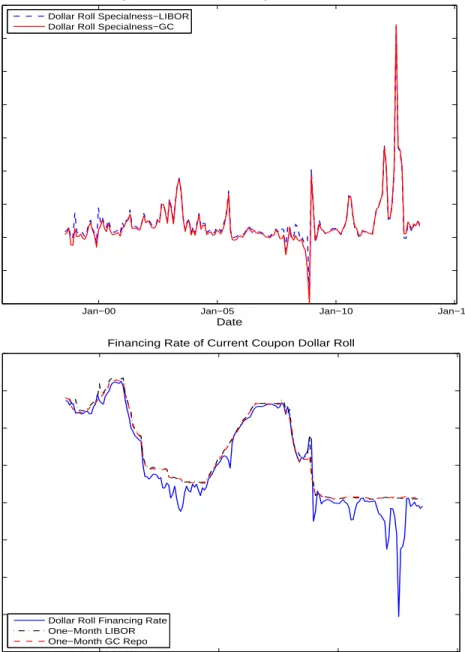
Figure 1 shows the time series behavior of the dollar roll specialness for FNMA 30-year current coupon MBS, from a proprietary database provided by J.P. Morgan.4 We observe
large variations of dollar roll specialness over time. It shot up to as high as 600 basis points recently.
To the best of our knowledge, this paper provides the first study of dollar roll specialness in agency MBS markets. Our inquiry is organized around three key questions:
1. What determines the dollar roll specialness?
2. What is the relation between dollar roll specialness and expected MBS returns?
3. What impact does the Federal Reserve have on the specialness of agency MBS through its large-scale asset purchases?
4The current coupon MBS is the MBS with a coupon rate that makes its price equal to par, analogous
Figure 1: Financing Rates and Specialness of Current-Coupon Roll
Jan−00 Jan−05 Jan−10 Jan−15
−200 −100 0 100 200 300 400 500 600 700 Date Basis Points
Specialness of Current Coupon Dollar Roll Dollar Roll Specialness−LIBOR
Dollar Roll Specialness−GC
Jan00 Jan05 Jan10 Jan15
−800 −600 −400 −200 0 200 400 600 800 Date Basis Points
Financing Rate of Current Coupon Dollar Roll
Dollar Roll Financing Rate One−Month LIBOR One−Month GC Repo
Note: This figure plots monthly time series of the specialness (top panel) and financing rates (bottom panel) of current-coupon MBS dollar rolls, from July 1998 to July 2013. The dollar roll specialness is computed both relative to the 1-month GC repo rate of agency MBS and to the 1-month LIBOR.
We investigate these questions empirically using a large panel data set from July 1998 to July 2013, consisting of dollar roll financing rates, mortgage yield spreads, MBS issuance, purchases by the Federal Reserve, and other data sources.
The determinants of dollar roll specialness. In studying the determinants of dollar roll specialness, we obtain monthly time series of dollar roll financing rates for FNMA 30-year TBA contracts with twelve coupon rates ranging from 3% to 8.5%, a proprietary database provided by J.P. Morgan. We compute the dollar roll specialness as the difference between prevailing one-month interest rates, both the 1-month general collateral (GC) repo rate of agency MBS and the 1-month LIBOR, and the implied financing rates.
We hypothesize two broad determinants of dollar roll specialness: prepayment risk and supply effect. On the one hand, a higher prepayment of principal on mortgages underlying an MBS lowers the remaining value of the MBS. Anticipating a higher risk of prepayment and being delivered an cheaper MBS, the roll seller offers a lower price for the future-month leg of the dollar roll. This implies a higher specialness of the dollar roll. On the other hand, a tighter supply of MBS gives the MBS holders extra rents in repo markets and security lending markets, above and beyond the cash flows. To convince the roll seller to part with her scarce collateral, the roll buyer must offer a higher price in the front month of the dollar roll contract. This also implies a higher specialness.
We test these hypotheses using panel regressions and find supporting evidence in the data. First, a lower primary mortgage rate implies a higher specialness. This is intuitive because a lower mortgage rate encourages homeowners to prepay existing, higher-interest mortgages and to refinance at lower rates. The sensitivity of dollar roll specialness to primary mortgage rate is also larger if home prices are higher or if housing transactions are more active. Direct measures of mortgage refinancing activity also positively relate to the specialness of mortgage dollar roll.
Second, in the cross-section the MBS with different coupons, we find that an MBS with a higher coupon has a lower specialness, if the MBS coupon is also higher than the prevailing coupon of newly issued MBS (In the data, the prevailing coupon is equal to the primary mortgage rate minus a stable spread). For example, if the prevailing coupon rate is 4%, then an MBS with a 5% coupon is more special than an MBS with a 7% coupon on average. This result may appear surprising at first. Wouldn’t MBS with higher coupons be more likely to be prepaid? No, and the reason is the so-called “burn-out” effect. Because mortgage rates move gradually over time, homeowners with the 7% mortgage have forgone refinancing activities
as the prevailing coupon rate fell from 7% to 6% and eventually to 4%. By self-selection, homeowners that did not refinance at favorable rates in the past may have impaired credit, low loan balance, low home equity value, or other considerations that make them also less responsive to lower mortgage rates in the future. By contrast, MBS that have marginally higher coupons than current coupon are more likely to be prepaid and become more special. Hence the burn-out effect.
The third piece of evidence is that a lower issuance of MBS increases the specialness. This is consistent with search theories of Duffie, Garleanu, and Pedersen (2002) and Vayanos
and Weill (2008) as well as evidence regarding repo specials and on-the-run premium in
Treasury markets (seeJordan and Jordan (1997),Krishnamurthy(2002), and Graveline and
McBrady (2011), among others). Interestingly, subsample analysis suggests that this effect
is the strongest in the financial crisis.
Taken together, over 30% of the variation in the dollar roll specialness can be explained by primary mortgage rates, burn-out effect, and MBS supply. The significance in these three determinants of specialness are robust to whether the GC repo rate or LIBOR is used to compute the specialness and whether time- and coupon-fixed effects are included.
The relation between dollar roll specialness and expected MBS returns. In study-ing the relation between the dollar roll specialness and expected MBS returns, we follow
Gabaix, Krishnamurthy, and Vigneron (2007) and use option-adjusted spreads (OAS) as a
proxy for MBS returns. The OAS is the yield on an MBS in excess of the term structure of interest rates after adjusting for the value of the homeowner’s prepayment option, condi-tional on the interest rate path. In principal, OAS reflects the deviation of an MBS’s market price from its expected value and hence the risk premium of this MBS demanded by investors who are averse to prepayment risks.
We obtain monthly OAS for the same collection of FNMA 30-year TBA contracts from July 1998 to July 2013, also provided by J.P. Morgan. Results of panel regressions show that there is a pronounced negative relation between the OAS and dollar roll specialness. In particular, regressions of the OAS on “special” dummies show that an MBS on special has a significantly negative premium of around 60 basis points relative to an otherwise identical security. As a robustness check, we obtain realized returns of TBA contracts for January 2000–July 2013, regress them on the dollar roll specialness, and find a strong negative relation as well. These results are robust to whether the GC repo rate or LIBOR is used to measure the specialness, whether the Treasury or LIBOR term structure is used to measure the OAS,
whether the regression is run on the “level” or the “first difference” of the data, and whether time- and coupon-fixed effects are included.
The impact of large-scale asset purchase on dollar roll specialness. Finally, we apply our framework of dollar roll specialness to evaluate the impact of the Federal Reserve’s large-scale asset purchase (LSAP) of agency MBS—one of the most important central bank actions in the financial crisis—on MBS funding market. As a response to deteriorating market conditions in the recent financial crisis, the Federal Reserve introduced a sequence of LSAP programs of agency MBS guaranteed by Fannie Mae, Freddie Mac, and Ginnie Mae. As of July 2013, the Federal Reserve has accumulated $1.25 trillion face value of agency MBS on its balance sheet, which is more than 20% of the outstanding amount of agency MBS. Moreover, most of the purchases concentrated in newly-issued agency MBS. For example, the $1.25 trillion of agency MBS the Federal Reserve purchased from January 2009 to March 2010 account for 40% of the aggregate issuance for 2009–2010. “Conceivably, if the Federal Reserve became too dominant a buyer in certain segments of these markets, trading among private agents could dry up, degrading liquidity and price discovery” (Bernanke(2012)).
Our framework points to two channels through which the LSAP can affect the dollar roll specialness. First, LSAP can decrease interest rates and mortgage rates, which will lead to increases in prepayment activities and hence increases in dollar roll specialness. Second, the large size of MBS withdrawn by the Federal Reserve from the private sector may result in shortages of collateral supply and increase the dollar roll specialness. We are interested in disentangling these two channels.
Based on the regression model of the determinants of dollar roll specialness, we decom-pose the dollar roll specialness into two components: one component captures prepayment risk (accounting for the effects of mortgage rates and burn-out effect), and the other cap-tures supply effect. We separately regress the two components of dollar roll specialness on measures of LSAP. The data show that LSAP has a significant impact on dollar roll special-ness mainly through its downward pressure on the interest rates and mortgage rates, which leads to higher prepayment risks. For example, the Federal Reserve’s purchases of MBS in a particular month corresponds to a 60–80 basis points increase in the dollar roll specialness. By stark contrast, LSAP does not seem to have statistically significant impacts on dollar roll specialness through the supply channel, despite its large size.
Related literature. Our paper contributes to three branches of literature: MBS markets, repo specialness, and the effects of central bank asset purchases on interest rates.
The MBS literature has traditionally focused on pricing models, whereas we focus on the financing side of MBS. Studies that propose MBS pricing models and study the dynamics of the OAS include Kupiec and Kah (1999), Dunn and McConnell (1981), Stanton (1995),
Schwartz and Torous (1989), Stanton (1995), and Boudoukh, Richardson, Stanton, and
Whitelaw (1997). Two recent studies, Gabaix, Krishnamurthy, and Vigneron (2007) and
Duarte, Longstaff, and Yu (2007), document empirical patterns of the returns of MBS and
dollar roll transactions, but they do not attempt to connect these return patterns to the dollar roll specialness or systematically analyze the determinants of specialness. Dollar roll specialness also provides us with a unique angle to analyze the impact of the Federal Reserve’s unconventional monetary policy, large-scale asset purchases, on MBS financing markets.
Our study is related to the literature of special repo rates of Treasury securities,
includ-ing Duffie (1996), Jordan and Jordan (1997), Buraschi and Menini (2002), Krishnamurthy
(2002), Duffie, Garleanu, and Pedersen (2002), Vayanos and Weill (2008), Pasquariello and
Vega(2009), andBanerjee and Graveline(2013), among others. The economics of dollar roll specialness in agency MBS markets, however, differs substantially from that of the Treasury repo specialness. Importantly, a dollar roll transaction does not require the return of the same collateral, which is the driving force behind the prepayment risk.
Lastly, our analysis of the impact of LSAP on dollar roll specialness relates to Stroebel
and Taylor (2012), Hancock and Passmore (2011), and Gagnon, Raskin, Remanche, and
Sack (2011), who analyze the effect of LSAP on mortgage rates. Instead of studying the level of mortgage rates, we investigate the impact of LSAP on the important MBS funding activity in the secondary MBS markets.
2
TBA Market and Dollar Roll
This section discusses details of the TBA trading convention in agency MBS markets, and dollar roll transactions, which consist of two simultaneous TBA contracts (seeHayre (2001)
and Hayre and Young (2004) for detailed industry references of MBS markets).5 A generic
example would be a TBA of $1 million face value of Fannie Mae 30-year MBS with a 5% coupon rate. The numbers used are hypothetical.
5All TBA-eligible MBS are so-called “pass-through” securities, which passes through the monthly
princi-pal and interest payments less a service fee from a pool of mortgage loans to owners of the MBS. Structured mortgage-backed-securities like CMOs, which tranche mortgage cash flows with various prepayment and maturity profiles, are not eligible for delivery in TBA contracts.
2.1
TBA market
A TBA contract, where TBA stands for “to be announced,” is essentially a forward contract to buy or sell an MBS. In a TBA trade, the buyer and seller negotiate on six general charac-teristics of the MBS pools to be delivered: agency, maturity, coupon rate, par amount, price, and settlement date. Different from other forward contracts, there is only one settlement date per month for TBA contracts, set by the industry group SIFMA. A single settlement date per month concentrates liquidity and facilitates the settlement of TBA trades.
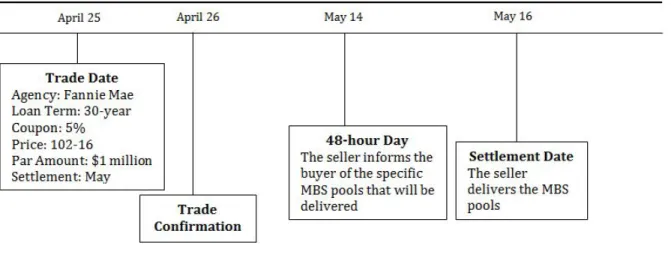
We now demonstrate the trading procedure of TBA markets through a concrete and hypothetical example. Suppose that on April 25, a buyer and a seller enter a TBA contract to trade $1 million par value of Fannie Mae 30-year 5% MBS at a price of 102-16, to be settled on May 16. The price 102-16 means $(102+1632)=$102.5 per $100 face value. Figure
2 shows the timeline of the example TBA trade.
Figure 2: A TBA Example
• Trade and Confirmation Dates. On the trade date April 25, the buyer and seller decide on the six trade characteristics. In the example, a TBA contract is initiated on April 25 and will be settled on May 16. The seller can deliver any MBS issued by Fannie Mae with the original mortgage loan term of 30 years, annual coupon rate of 5%, par amount of $1 million, and price at $(102+16/32) per $100 of par amount. The trade is confirmed within
one business day, which in this case is April 26.
• 48-Hour Day. The seller notifies the buyer of the actual identity (or the particular CUSIPs) of the MBS to be delivered at settlement date, no later than 3 p.m. two business days prior to the settlement date (“48-hour day“), which is May 14 in the example. These MBS pools have to satisfy the “Good Delivery” requirements set by SIFMA. For example, for each $1 million lot, the contract allows a maximum of three pools to be delivered and a maximum 0.01% difference in the face value; that is, the sum of the par amounts of the pools can deviate from $1 million by no more than $100 in either direction.
• Settlement Date. The seller delivers the MBS pools specified on the 48-hour day, and the buyer pays an amount of cash equal to the current face value times the TBA price (i.e., 102-16 in this example) plus accrued interests from the beginning of the month, given that the seller holds the MBS pools until the settlement date. Accrued interest is computed on a 30/360 basis.
The unique feature of a TBA trade is that the actual identity of the MBS to be delivered at settlement date is not specified on the TBA trade date. By specifying only a few key MBS characteristics, this TBA trading design dramatically increases the set of deliverable MBS and substantially improves market liquidity. The average daily trading volume of agency MBS is 20 times larger than that of corporate bonds, and close to 60% of that for Treasury securities in 2010, according to Vickery and Wright (2011).
2.2
Dollar roll
A dollar roll transaction consists of two TBA trades. The “roll seller” sells a MBS in the front month TBA contract and simultaneously buys a MBS in the future month TBA contract with thesame TBA characteristics, at specified prices. In particular, the two MBS delivered into the two TBA contracts need not have the same CUSIP, as long as they have the same TBA characteristics.
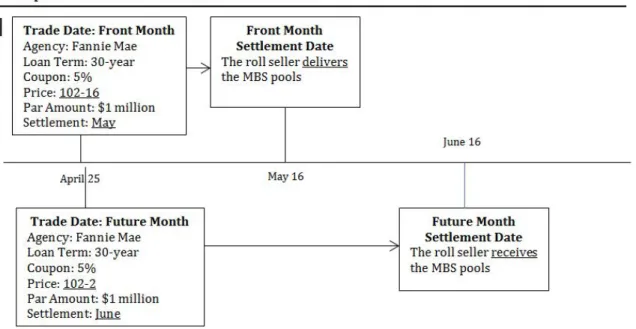
Figure 3 shows the timeline of an example dollar roll trade. In this example, the roll seller sells a MBS for May 16 settlement and buys it back for June 16 settlement, for a par amount of $1 million Fannie Mae MBS with the original loan term of 30 years and annual coupon rate of 5%, and with the front and future month prices at 102-16 and 102-2 per $100 of par amount, respectively.
The “drop” of this dollar roll, defined as the price difference of the front and future month TBA contracts, is positive for two reasons. (In this example, the drop is 1001632−100322 = 1432 per $100 par value.) First, the roll seller gives up principal and interest to the buyer during
the tenor of the front month TBA contract. Such a temporary ownership transfer provides a balance sheet relief over the financing period for the dollar roll seller, which is not feasible in repo contracts.6 Second, and more importantly, the returned MBS pool in the
future-month TBA contract may have inferior prepayment behavior and hence lower value than the original MBS sold in the front-month contract. This is because the TBA contract only requires a “substantially similar” MBS to be returned. These two features, especially the redelivery uncertainty of the returned MBS pool in the future-month leg, differentiates the dollar roll from a MBS repo transaction, in which the original owner collects principal and interest payments during the term of repo, and the same MBS pool has to be returned.7
Figure 3: A Dollar Roll Example
Participants in the TBA and dollar roll markets include MBS dealers, mortgage ser-vicers, pension funds, money managers (including mutual funds and endowments), hedge funds, commercial banks, and insurance companies. The Federal Reserve and foreign
cen-6In a typical repo contract, the repo collateral, say an MBS or Treasury security, stays on the cash
borrower’s balance sheet.
7Additionally, the cash lender in a repo transaction is generally able to call margin from the cash
bor-rower periodically (as often as daily), protecting the lender against counterparty credit risk deriving from fluctuations in the underlying collateral’s valuation.
tral banks with large dollar reserves (e.g. China and Japan) sometimes participate in MBS markets as well. Among them, commercial banks, insurance companies, and pension funds mostly use buy-and-hold strategies and only trade dollar rolls occasionally, due to account-ing considerations. Much of the dollar roll demand comes from MBS dealers who need to cover their short MBS hedging trades or maintain their MBS inventories for market-making.8
Mortgage servicers and money managers are main providers of dollar rolls, with the former enhancing their portfolios returns at desirable financing rates and the latter financing their MBS positions to hedge their interest rate exposure of the loans they service on their books. Hedge funds demand or supply dollar rolls for both hedging and speculation.
2.3
Dollar roll financing rates: a worked example
Though a dollar roll can be viewed as a contract of collateralized borrowing, the dollar roll transaction does not explicitly specify a collateralized borrowing rate as a repo transaction does with a repo rate. The borrowing rate of a dollar roll, which measures the benefit of rolling a MBS pool relative to holding it, can be computed based on the drop after adjusting for the principal and coupon payments the roll seller gives up over the roll period. As an over-simplified example, suppose that the front-month and future-month prices of the dollar roll transactions are P0 and P1, respectively, and the coupon and principal payments of the
MBS arec and d, respectively. Then, the effective financing rate of the dollar roll is
r= (P1+c+d)/P0−1. (1)
Of course, the computation of dollar roll financing rates in reality is much more involved. We now present a worked example for the calculation of dollar roll financing rates in Table
1, corresponding to the dollar roll transaction of Figure 3.
In this example, an investor sells a May/June dollar roll of $1 million FNMA 30-year 5% coupon MBS, with the price drop of 14/32. We assume that the scheduled principal payment in May is $1000 and the annualized conditional prepayment rate (CPR) is 10%. (The CPR gives the expected prepayment in a way we detail shortly.) Moreover, the 1-month reinvestment rate over the roll tenor for the roll seller is r = 2%. According to the trading convention, the principal and coupon payments of May are made on June 25.
Cash flows from holding on the $1 million FNMA 30-year 5% coupon MBS are presented
8Dealers’ short positions in MBS could be hedges against their long positions in CMOs, specified pools,
T able 1: Dollar Roll Calculation A: Assumptions Securit y FNMA 5% 30-Y ear Principal Balance $1 million Conditioal Prepa ymen t Rate (CPR) 10 Sc heduled Principal P a ymen t $1000 F ron t-Mon th TBA Price 102-16 Bac k-Mon th TBA Price 102-2 Roll “Drop“ 14/32 Prev ailing In terest Rate (e.g., LIBOR) 2% Implied Finance Rate r B: Cash Flo ws from Holding the MBS June 25 Receiv e coup on pa ymen ts (5%*30/360*1,000,000) $4166.67 Receiv e Sc heduled Principal $1000 Receiv e Prepaid Principal (with 10% CPR) $8732.87 $13,899.54 June 16 Discoun ted Pro ceeds as of June 16 ( 13,899.54 1+(2%*9/360) ) $13,892.99 C: Cash Flo ws from Rolling the MBS Ma y 16 Sell $1,000,000 FNMA 5% at 102-16 $1,025,000.00 Receiv e 14 da ys accrued coup on pa ymen ts (5%*14/360*1,000,000) $1944.44 $1,026,944.44 Rein v est the pro ceeds at r (30/360* r *1,026,944.44) un til June 16 $1711.57 $1,028,656.01 June 16 Buy $990,267.13 (=1,000,000-1000-8732.87) FNMA 5% at 102-2 -$1,010,691.39 P a y 15 da ys accrued coup on pa ymen ts to (5%*15/360*990,267.13) -$2.063.06 -$1,012,754.45 Net Pro ceeds from Rolling as of June 16 (1,028,656.01-1,012754.45) $15,901.56 D: Cash Flo w of Rolling vs Holding the MBS 15,901.56-13,892.99 $2,008.57 E: Dollar Roll Financing Rate Dollar roll implied financing rate=Rein v estmen t rate at whic h rolling and holding the MBS are indifferen t as of June 16 (Solv e for r in 1,026,944.44*(1+ r *9/360)-1,012,754.45=13,892.99) r =-1.16% Note: This table pro vides the calculation of a dollar roll example. The n um b ers are h yp othetical.
in Panel B of Table 1. The investor will receive $13,899.54 in total on June 25, including coupon payments of $4166.67, scheduled principal payments of $1000, and prepaid principal payments of (with a 10% CPR) $8732.87.9 The discounted proceeds as of June 16 is hence
$13,892.99, using the 1-month short rate of 2%.
Panel C tabulates the cash flows from rolling the $1 million FNMA 30-year 5% coupon MBS. The investor will receive $1,025,000 on May 16 by selling the MBS in the front month TBA contract at 102-16, along with 14 days accrued coupon payments of $1944.44 by holding the MBS until May 16, giving a total of $1,026,944.44. By reinvesting the proceeds at the rater = 2%, the investor receives the cash inflow of $1,028,656.01 on June 16. Furthermore, on June 16, the roll seller buys back the amount left after the scheduled and prepaid principal payments, i.e., $990,267.13 at the price of 102-2, leading to a cash outflow of $1,010,691.39.10
Moreover, the roll seller delivers 15 days accrued coupon payments of $2.063.06 to the roll buyer as the buyer holds the MBS from June 1 to June 16. In total, the roll seller has a cash outflow of $1,012,754.45 on June 16, with the net cash flow from the whole roll transaction as $15,901.56 on June 16.
Overall, the investor earns an additional $2,008.57 by rolling her MBS instead of holding onto it, with the 1-month reinvestment rate equal to 2%. The effective dollar roll financing rate can be solved as the reinvestment rate r that equates the cash flows from rolling the MBS and those from holding onto it. That is,r solves
1,026,944.44×(1 +r×9/360)−1,012,754.45 = 13,892.99,
which gives r = −1.16% in this example. Importantly, the calculation of implied financing rate assumes that the same MBS is returned. Since the roll seller may receive an inferior MBS in the future-month leg, the negative implied financing rate is not an arbitrage. Rather, it reflects redelivery premium, search costs, and other frictions in the market, which we discuss in the next subsection under the umbrella of “specialness.”
9A measure of monthly prepayment rate is the single monthly mortality rate (SMM), which equals
the prepayment amount as a percentage of the previous month’s outstanding balance minus this month’s scheduled principal payment. The SMM can be computed from the CPR asSM M = 1−(1−CP R)1/12.
The $8732.87 prepayment is calculated asSM M×(1,000,000−1,000) given a 10% CPR.
10In practice, the roll seller buys back more than the amount left after the scheduled and prepaid principal
payments due to the Good Delivery requirement that the returned MBS pool has a maximum principal difference of 0.01%. The simpler example here is just for the convenience of calculation.
2.4
Dollar roll specialness
We say a dollar roll is “on special” if the implied finance rate is lower than the prevailing borrowing interest rate, such as the MBS repo rate or LIBOR. The specialness of a dollar roll, defined as the market prevailing borrowing rate less the implied finance rate in a dollar roll, provides a rent to the MBS owners and represents an effective reduction in the financing costs of MBS positions below that associated with the prevailing borrowing rates. However, the specialness is not an arbitrage in any sense, as the dollar roll seller bears the redelivery risk, i.e., the risk of a MBS with inferior prepayment characteristics being returned in the future-month TBA contract. As discussed in the last subsection, the dollar roll implied financing rate only adjusts for the shrinking principal MBS balance due to the prepayments in the roll period, but assumes that the returned collateral is the same MBS pool. In other words, the dollar roll specialness incorporates a risk premium demanded by the roll seller for the redelivery risk. The higher is the risk, the lower price the roll seller is willing to offer in the far month of the dollar roll, and the lower is the implied financing rate (see equation (1) and the example in the previous subsection). Hence, the specialness is higher.
To see the intuition more clearly, we consider this stylized example. Suppose that the implied financing rate of a dollar roll on an MBS (and similar other MBS) is −1%, but the repo rate of using that MBS for secured borrowing is 2%. An investor with $1 million cash can engage in the following trades. She lends the cash against the MBS in the repo market for one month at 2%, and subsequently rolling the MBS collateral for one month at the financing rate of −1%. If, by any chance, the same MBS is returned to the investor in the dollar roll market, she can return the same MBS to the repo counterparty and close the repo contract; this earns her the net profit of $(2%+1%)/12 million. If, however, a different and cheaper MBS is returned in the dollar roll market, this different MBS cannot be used to close the repo contract, and she must buy or borrow the original MBS to close the repo contract. In this process, she must make up for the price difference between the original MBS and cheaper MBS delivered back to her in the dollar roll. The specialness of 3% (relative to MBS repo rate), therefore, compensates for such risks born by the roll seller.
Let us consider another related example that involves an unsecured financing rate, say LIBOR. Suppose that the LIBOR rate is 3%, and the implied dollar roll financing rate is still
−1%. An investor who starts with an MBS with market value of $1 million can engage in the following trades. She rolls the MBS in the dollar roll market by one month, earning 1%. She simultaneously invests the proceeds from selling the MBS at LIBOR, earning another 3%. However, as in the previous example, the MBS delivered back to her in the future month
can be inferior, and the total return of 4%, or specialness relative to LIBOR, compensates her for such risks.
In addition to being a compensation for redelivery risk, the dollar roll specialness also reflects the general supply and demand conditions in the TBA market. For example, if the MBS of particular characteristics are scarce in the market, a holder of such MBS can extract more rents in the repo market and security lending market. By rolling this MBS, the roll seller gives up not only the interest and principal payments, but also the rents associated with cheaper financing rates and lending fees. Therefore, the equilibrium implied financing rate in the dollar roll must fall, leading to a higher specialness. The scarcity of a particular class of MBS can be driven by the shorting and hedging activities of dealers and originators, as well as the amounts of newly issued MBS.
2.5
“Trading at Fail” and negative financing rate
So far, we discussed the functioning of dollar roll markets under the assumptions that both counterparties of the dollar roll transaction deliver on time. In reality, the security borrower in a dollar roll transaction may fail to return the MBS to the roll seller on time in the back-month TBA contract. In this case, we say the roll is “trading at fail.” Fails could happen if there is a temporary shortage of MBS that satisfy the TBA delivery requirements due to, for example, a high volume of CMO deals. In the case of trading at fail, the dollar roll seller benefits by not having to pay the cash back to the security borrower until the MBS is delivered back. In addition, the roll seller is still entitled the principal and coupon payments of the MBS that the roll buyer fails to return. On net, the dollar roll seller receives “extra” interests earned on the funds that would be passed to the security borrower if a fail had not occurred. That is, while the dollar roll is trading at fail, the roll seller effectively borrows from the roll buyer at the 0% financing rate.
Without a penalty on failure to deliver, a sufficiently negative implied financing rate in a dollar roll trade can encourage the MBS borrower in the roll transaction to fail strategically and charge a more desirable 0% financing rate, instead of the negative financing rate implied by the dollar roll. Assuming that the returned MBS is the same as the original one, this strategic incentive would bound the dollar roll financing rate at 0% from below. On April 29, 2011, the Treasury Market Practices Group (TPMG) proposed a fail charge of 2% for agency MBS markets, which would begin on February 1, 2012.11 By the same reasoning, this
11The TMPG is composed of a group of market professionals from securities dealers, banks, and buy-side
fails charge pushes the lower bound of the dollar roll financing rate to−2%, again assuming that the returned MBS is the same as the original one.
However, given the redelivery risk in a dollar roll transaction, the implied financing rate can fall below the failing charges of 0% or −2% significantly, as a compensation to the roll seller (see Figure1). This suggests that some security borrowers (roll buyers) view returning a MBS with inferior prepayment characteristics in the back-month TBA contract to be more advantageous than invoking a fail and holding onto the MBS. This usually happens when primary mortgage rate falls and new MBS issuance moves to lower coupon brackets, in which case holders of MBS with immediately higher coupons are subject to high prepayment risk and are better off delivering them. Reputation concerns may also prevent the security borrowers to fail excessively.
3
Hypotheses
In this section we develop hypotheses regarding the specialness of mortgage dollar rolls. We ask two questions. First, what are the determinant of dollar roll specialness? Second, what is the relation between dollar roll specialness and expected MBS returns?
3.1
Determinant of dollar roll specialness
We conjecture two main determinants of dollar roll specialness: prepayment risk and supply effect.
3.1.1 Prepayment risk
As we discussed in the previous section, a key feature of financing MBS by mortgage dollar roll, relative to financing by repo, is that the roll buyer (who lends cash and receives an MBS) has the option to deliver a substantially similar but different MBS in the back-month of the roll contract. In addition, when the roll buyer holds the MBS, principal and interest payments—including scheduled payments and principal prepayment—from the MBS go to the roll buyer. This implies that a high expected prepayment or a high risk of prepayment is unfavorable to the roll seller (effectively the cash borrower). As a compensation, the roll seller offers a lower price to buy back the substantially similar MBS in the back-month leg
the Federal Reserve Bank of New York, they meet periodically to discuss trading issues in Treasury, agency debt, and agency MBS markets. The TMPG has implemented a similar fails charge for transactions of U.S. Treasury securities since May 1, 2009.
of the roll transaction. This low price, in turn, implies a lower effective financing rate, or a higher specialness.
There are a number of ways to capture prepayment risk in the data. We focus on two channels: the time series (e.g. primary mortgage rate) and the cross section (e.g. MBS coupon). The former addresses time-varying market-wide prepayment risk that affects all MBS, whereas the latter focuses on the factors that differentiate MBS from each other.
Time-series measure. Our main time-series measure of prepayment risk is the primary mortgage rate. A lower mortgage rate this month implies a stronger incentive for borrowers to refinance the mortgage and prepay the principal. Because an MBS issued in high-mortgage rate environment tends to trade at a premium (relative to par) once mortgage rate declines, the prepayment of principal on such MBS is especially costly for the roll seller. Therefore, we expect MBS to become more special if mortgage rate becomes lower. Importantly, the mort-gage rate can be interpreted as a lead indicator of prepayment activity because refinancing and prepayment take time to complete.
Hypothesis 1. An MBS is more special in the dollar roll market if the primary mortgage rate is higher.
Hypothesis 1 can also be enriched by incorporating conditional variables, such as hous-ing prices and tradhous-ing activity in houshous-ing markets. For example, we also conjecture that conditional on the same primary mortgage rate, a higher house price tends to generate more refinancing and hence prepayment. This is because a higher property price relaxes the fund-ing constraints of households, makfund-ing it much easier for them to take advantage of a lower mortgage rate. A similar argument can be made about the trading activity in housing mar-ket: conditional on the primary mortgage rate, a higher trading volume almost mechanically generates more prepayments as original home owners pay down their mortgage after sales. We will test these conditional versions of Hypothesis 1.
Of course, the primary mortgage rate is not the only measure of prepayment risk. Another potential measure is survey-based refinancing activity, which we will use later to test the robustness of Hypothesis 1.
Cross-section measure: the Burn-Out effect.
Hypothesis 2. Conditional on the coupon rate of an existing MBS being higher than the prevailing coupon of newly issued MBS, a higher coupon rate of the existing MBS is associated with a lower specialness of that MBS.
Hypothesis 2 captures a well-recognized burn-out effect. Its mechanism is slightly more involved. Conventional intuition would suggest that the higher is the coupon of an MBS, the stronger is the prepayment incentive of borrowers, and the more special is the MBS. Seemingly reasonable, this intuition does not hold generally. To see why, consider the fol-lowing example. Suppose that a household borrows at the mortgage rate of 6%, and the mortgage is packaged into an MBS that pays a coupon rate of 5%. Suppose, too, that the mortgage rate then declines from 6% to 5.5%. At this point, the household would refinance its mortgage at the lower interest rate of 5.5% as long as the 0.5% interest rate improvement on the remaining loan balance dominates the cost of refinancing. If, however, the household does not take this refinancing opportunity, it signals a higher effective cost of refinancing: the household could have a worse credit, a low home equity value, or a small remaining loan balance, among other reasons. By this self-selection, households that forgo refinancing opportunity now are less likely to refinance in the future than an average household is.
This simple argument has a dynamic extension. As the mortgage rate declines further, say from 5.5% to 5%, households that borrowed at 5.5% are more likely to refinance on average than those who borrowed at 6%—because the latter group has rationally forgone the refinancing opportunity when the mortgage rate is 5.5%. By the same argument, a household that borrowed at, say, 7% is even less likely to refinance at 5%, conditional on having forgone the previous refinancing opportunities at 6.5%, 6%, and 5.5%. Therefore, the burn-out effect is that mortgages that already missed previous refinancing opportunities are less responsive to lower rates and hence less likely to be refinanced and prepaid in the future.
Although our data do not contain the interest rates on the underlying mortgages, they do have the coupon rates. Because the primary mortgage rate and current coupon rate have a relatively stable spread over time (see Figure 5), we use the difference between an MBS coupon rate and the prevailing coupon rate as a proxy of forgone refinancing opportunities; the larger is the coupon difference, the stronger is the burn-out effect. We put a floor on the coupon difference at zero because prepayment risk is largely irrelevant if the MBS coupon is lower than the prevailing coupon.
3.1.2 Supply effect
So far, we have discussed the effect of prepayment risk on the specialness of MBS dollar roll, which is unique to the MBS market. Now, we turn to the generic effect of supply for determining dollar roll specialness.
Supply is a relevant determinant of dollar roll specialness because the MBS market is over-the-counter (OTC). Among the important features of OTC markets is search friction: market participants must first locate a counterparty to execute a trade or borrow a security. OTC markets cover the vast majority of trading volume in debt instruments, including Treasuries, MBS, corporate bonds, municipal bonds, as well as the lending and repo arrangements of those securities. In this aspect, we expect the effect of supply for MBS dollar roll specialness to be similar to those found in other markets.
Hypothesis 3. A larger issuance of MBS of a particular coupon is associated with a lower specialness in the dollar roll market.
Theoretically, the effect of asset supply on its financing rate has been examined byDuffie,
Garleanu, and Pedersen(2002), andVayanos and Weill(2008), among others. Using a model
with search frictions and heterogeneous beliefs, Duffie, Garleanu, and Pedersen(2002) show that a larger supply reduces the lending fee and price of an asset in two ways. First, a larger asset supply implies a lower valuation or belief of the marginal holder of the asset. Second, a larger asset supply makes it easier for pessimists to locate the asset for shorting, which, in turn, reduces the lending fee and the asset price. Since a smaller lending fee corresponds to a higher effective financing cost for the security lender (i.e. cash borrower), their model predicts that the specialness is lower if the asset supply is larger.
Vayanos and Weill (2008) characterize the endogenous concentration of liquidity and
trading activity in one asset even if there is another identical asset. They show that, if the supply of Asset 1 exceeds that of Asset 2 by a sufficient amount, short sellers concentrate on Asset 1. In this equilibrium, a decrease in the supply of Asset 1 can lead to a higher or a lower specialness of Asset 1. This ambiguous prediction comes from the interaction between scarcity in the repo market and scarcity in the spot market.
Empirical studies in Treasury markets generally find that a tighter supply is associated with a higher specialness, as documented by Jordan and Jordan (1997) and Graveline and
McBrady (2011) in Treasury auctions data. Closely related, Krishnamurthy (2002) finds a
negative relation between on-the-run premium and issue size in US Treasury markets.
3.2
Relation between dollar roll specialness and expected MBS
returns
A commonly used measure of expected MBS returns is the option-adjusted spread (OAS)
(seeGabaix, Krishnamurthy, and Vigneron(2007)). The OAS is effectively an model-implied
yield spread of an MBS relative to a benchmark interest-rate term structure, after adjusting for the value of homeowners’ prepayment options. That is, the OAS measures the expected return an investor can earn by buying the MBS and hedging out the prepayment risks. In principle, if the prepayment models are perfectly accurate and there are no trading frictions or other risks, the OAS should be zero. In reality, however, the OAS is rarely zero, indicating that MBS buyers are compensated for other risks, such as credit risk or illiquidity risk, or that the prepayment models used to calculate MBS can be misspecified.
Hypothesis 4 focuses on the illiquidity risk channel. As we discussed in the previous subsection, an MBS can become special for two reasons: a high prepayment risk or a tighter supply. The relation between specialness and expected MBS returns, directly through the supply channel, is straightforward. Securities that are scarce tend to receive a lower financing rate in the repo market and a higher lending fee in the shorting market (see, for example,
Duffie (1996) and Duffie, Garleanu, and Pedersen (2002)). In exchange for these additional “rents,” holders of those securities are willing to accept a lower expected return.
The prepayment risk channel is slightly more involved, although it does ultimately lead to the endogenous tightening of the effective supply of a particular MBS coupon stack. To see the intuition, suppose that a particular MBS coupon stack is on special. Due to the heterogeneity of mortgage loans, some MBS CUSIPs within that group have a higher prepayment risk than others, creating a dispersion of prices. The higher the prepayment risk, the higher this difference dispersion. But because investors rationally deliver the cheapest CUSIPs into the back month of dollar roll contracts, these cheapest-to-deliver MBS CUSIPs tend to become more difficult to “locate,” with an effectively tighter supply. We emphasize that this supply shortage is distinct from lower new issuance. Rather, it is induced by the unique combination of mortgage prepayment risk and TBA market design, and endogenously driven by the specialness associated with prepayment risk. Consequently, these cheapest-to-deliver CUSIPs, more representative of their MBS group, receive lower expected returns (again because of the advantage of using them in repo and lending markets).
4
Data
Our empirical analysis employs three main data sets. The first data set comprises observa-tions of dollar roll financing rates for FNMA 30-year (generic) TBA contracts with twelve
coupon rates ranging from 3% to 8.5%. These financing rates are furnished by J.P. Morgan and available at the daily frequency from July 1998 to July 2013. We construct monthly time series of dollar roll financing rates by forming simple averages of daily numbers in each month, which reduces microstructure noises. The data are an unbalanced panel, with the common last observations in July 2013 but varying initial observations between July 1998 and August 2010. Panel A of Table2provides summary statistics of these dollar roll financ-ing rates. We observe that the time series mean of dollar roll financfinanc-ing rates increases with the coupon rate, with negative figures at coupon rates from 3% to 4%. The minimum values of financing rates are uniformly negative, extending to as low as −13% at the 7% coupon stack.
We compute two versions of dollar roll specialness, DSPGC and DSPLIBOR, using the
1-month general collateral (GC) repo rate of agency MBS and the 1-month LIBOR as bench-mark prevailing interest rates, respectively.12 We obtain the ICAP GC repo rate of MBS
from Bloomberg and the LBIOR from Datastream. Panels B and C of Table 2 report sum-mary statistics of DSPGC and DSPLIBOR, respectively. Overall, the average specialness
lies between 35 to 100 basis points, but with negative figures at coupon rates from 7.5% to 8.5%, probably due to the burn-out effect. The time-series mean of dollar roll specialness generally decreases with the coupon rate. Moreover, DSPGC is lower than DSPLIBOR as the GC repo rate of MBS is usually below the 1-month LIBOR. Panel D of Table 2presents the ratios of dollar roll being “on special” over time. We observe that the dollar roll exhibits specialness over 65% of the sample period for TBA of coupon rates less than 7%. MBS with very low coupons (the first two columns) and the market “current coupon” (the last column) are almost always special.
Our second main data set comprises daily observations of option-adjusted spreads (OAS) from July 1998 to July 2013 for the same collection of FNMA 30-year (generic) TBA con-tracts, also provided by J.P. Morgan. The OAS is a spread added to the term structure of interest rates such that the present (discounted) value of a MBS’s expected cash flows, after adjusting for the value of the homeowner’s prepayment option conditional on the in-terest rate path, equals the price of the security. Specifically, letrt, t= 1,· · · , T be the path
of one-period interest rate with a realization of rjt, t = 1,· · · , T under the economy state
j = 1,· · ·1, N. With a prepayment model that specifies the prepayment behavior of the
homeowner conditional on the realized interest rate path under state j, the cash flow path
12We also use the GCF repo rates of agency MBS that are only available from May 2005, and obtain
T able 2: Summary Statistics of Dollar Roll Financing Rates and Sp ecialness Conp on Rate 3 3.5 4 4.5 5 5.5 6 6.5 7 7.5 8 8.5 CC A: Dollar Roll Financing Rates Mean -78.6 -72.7 -12.4 152 131.5 221.1 241.2 233.5 227.6 349.1 385.8 464.3 222 Std 77.1 93.4 40.6 219.8 224.1 247.2 238.6 254.2 280.7 225.7 206.4 155.5 249.4 Min -260.6 -511.6 -204.6 -197.4 -230.2 -216 -143.3 -670.3 -1363.1 -1098.5 -406.3 58 -610.8 Max 20.6 18 43.6 539.7 544.8 683.2 676.2 668.3 659.7 675.6 865 934.8 651.7 B: DSP GC Mean 104.8 101.3 40.9 36 53.7 33.3 19.6 27.3 33.3 -88.2 -125 -203.4 38.9 Std 76.3 100.9 46.3 62.6 71.5 63.6 60.3 85 135.2 176.4 202.2 226.6 72.5 Min 6.2 2.6 -15.6 -187.6 -192.1 -202.7 -216.1 -217.8 -252.7 -516.5 -648.2 -909.1 -198.4 Max 291.4 604.7 288.8 299.3 257.2 230.8 187.6 691.8 1384.7 1120 427.9 218.2 641.8 C: DSP LIBOR Mean 101.7 99.1 39.7 41 58.7 39.6 26 33.8 39.7 -81.8 -118.5 -197 45.3 Std 77.9 97.5 47.1 58.2 66.4 60.7 57.8 82.6 134 178.8 203.5 229.1 69.6 Min 5.7 2.2 -22.9 -168.4 -173 -183.6 -214 -198.7 -254.7 -521.3 -652.9 -911 -179.3 Max 286.8 563.1 301.6 303.1 253.9 235.3 191.7 693.2 1386 1121.4 429.2 225.6 635.4 D: Ratio of “On Sp ecial” Begin 08/2010 12/2008 12/2008 05/2003 08/2002 11/1998 07/1998 07/1998 07/1998 07/1998 07/1998 07/1998 07/1998 End 07/2013 07/2013 07/2013 07/2013 07/2013 07/2013 07/2013 07/2013 07/2013 07/2013 07/2013 07/2013 07/2013 No. 36 56 56 123 132 177 181 181 181 181 181 181 181 “Sp eical”% -GC 100% 100% 96% 80% 82% 72% 64% 69% 64% 31% 36% 20% 88% -LIBOR 100% 100% 95% 88% 90% 81% 71% 75% 70% 35% 36% 22% 94% Note: This table pro vides summary statistics of the financing rates, sp ecialness relativ e to b oth the GC rep o rate and LIBOR, and the ratio of dollar roll b eing “on sp ecial”in the time series, across coup on rates. The v alues of financing rates and sp ecialness are denoted in basis p oin ts. The last column “CC” refers to “curren t coup on MBS”, whic h is the MBS with a coup on rates that mak es its price equal to par. The o v erall sample p erio d is July 1998 to July 2013, with v ariations dep ending on coup on rates.
from the MBS Cjt, t= 1,· · · , T can be calculated. Then the OAS is defined such that VM BS = N ∑ j=1 pj [ T ∑ t=1 Cjt (1 +rj1+OAS)× · · ·(1 +rjt +OAS) ] .
That is, the OAS is the yield spread to the interest rate rt required to set the present value
of the MBS expected cash flows based on the prepayment forecast equal to the market prices of this MBS. In principal, OAS measures the expected return an investor earns, relative to certain benchmark interest rates, by buying the MBS and hedging out the prepayment risks.13
We use OAS based on both the LIBOR swap yield curve and Treasury yield term structure for rt, with the OAS referred to as OASLIBOR and OAST sy, respectively. Since the LIBOR
and Treasury yields are benchmark interest rates used by financial market participants for debt borrowing,OASLIBORandOAST sy can be regarded as spreads relative to their funding costs.14 We form monthly OAS time series by taking simple averages of daily numbers in each month. Table 3 provides summary statistics of these OAS series. We observe that the time series means of OASLIBOR range from 6 to 160 basis points, and those of OAST sy
range from 20 to 200 basis points. Both increase with the coupon rates roughly, with the monotonic increasing pattern more pronounced for OAST sy than for OASLIBOR. Figure 4
plots the monthly time series of OASLIBOR and OAST sy for current-coupon FNMA 30-year
MBS.
Finally, we obtain weekly observations of primary mortgage rates (PMMS) for 30-year fixed-rate mortgage loans from the Freddie Mac primary mortgage market survey as a proxy for market-wide prepayment risk driven by interest rates. We also obtain daily observations of the current coupon (CC) rate for the 30-year TBA contract from J.P. Morgan., which we use to construct a measure of the burn-out effect. Figure 5plots the monthly time series of the PMMS and CC rate, computed as the simple averages of observations in each month. As expected, there is a spread of around 50-80 basis points between PMMS and CC due to the guarantee fee charged by the agency (Fannie Mae). Additionally, we obtain monthly new issuance and outstanding balance data of FNMA 30-year MBS pools across the twelve
13Since the hedging of prepayment risks is based on a prepayment model, OAS may contain components
due to misspecifications of the prepayment model or interest rate model. We conduct a number of robustness checks inAppendix Aon OAS.
14A few studies including Fabozzi and Mann (2011) and Belikoff, Levin, Stein, and Tian (2010) argue
that theOASLIBOR is a better measure as most investors use LIBOR as the benchmark borrowing rate and
T able 3: Summary Statistics of Option-Adjusted Spreads O AS LI B O R Coup on Rate 3 3.5 4 4.5 5 5.5 6 6.5 7 7.5 8 8.5 CC Mean 32.02 19.98 15.3 13.55 5.99 12.36 15.65 21.1 32.89 91.85 113.31 162.63 11.68 Std 27.08 19.99 12.97 21.39 27.35 25.64 30.63 36.74 47.05 120.8 152.41 176.41 17.52 Min -19.69 -31.19 -11.27 -37.72 -85.89 -63.76 -71.33 -35.89 -45.05 -41.15 -82.55 -55.61 -15.64 Max 82.93 75.89 59.52 81.94 75.95 109.97 150.09 191.4 220.96 377.64 424.9 493.37 68.69 O AS T sy Mean 28.99 22.98 19.35 43.91 37.79 39.28 43.55 50.7 67.4 128.56 150.94 203.07 43.44 Std 27.48 24.41 16.67 33.83 39.95 35.68 38.64 41.75 49.42 110.16 139.88 163.68 27.1 Min -28.41 -35.42 -15.66 -37.77 -82.54 -58.89 -67.85 -23.4 -12.9 -5.63 -43.44 -17.08 -21.22 Max 75.33 104.5 81.84 158.92 150.89 151.4 171.43 204.48 253.86 389.99 438.01 507.21 152.36 Note: This table pro vides summary statistics of mon thly series of O AS LI B O R and O AS T sy across coup on rates. The O AS v alues are denoted in basis p oin ts. The o v erall sample p erio d is July 1998 to July 2013, with v ariations dep ending on coup on rates.
Figure 4: Option Adjusted Spreads of Current-Coupon MBS
Jan−00 Jan−05 Jan−10 Jan−15
−40 −20 0 20 40 60 80 100 120 140 160 Date Basis Points
Option Adjusted Spreads of Current Coupon MBS
LIBOR−OAS Tsy−OAS
Note: This figure plots monthly time series ofOASLIBOR andOAST sy of current-coupon MBS, from July
1998 to July 2013.
coupon rates ranging from 3% to 8.5% from eMBS.
5
Empirical Analysis
We present our main empirical results in this section, both on the determinants of dollar roll specialness and on the negative relationship between specialness and expected MBS returns. Robustness checks are conducted in Appendix A.
5.1
What drives dollar roll specialness?
We study what drives variations of dollar roll specialness both over time and across coupon stacks. We conjectured in Section 3 that the specialness of a dollar roll depends on the market-wide interest rates, burn-out effect, and MBS supply. By Hypothesis 1, a lower primary mortgage rate P M M St implies a higher prepayment and redelivery risk, hence a
higher specialness.
We define the time-t burn-out effect of a MBS with coupon rate CPi as
Figure 5: Primary and Secondary Mortgage Rates
Jan−00 Jan−05 Jan−10 Jan−15
200 300 400 500 600 700 800 900 Date Basis Points
Primary and Secondary Mortgage Rate
Primary Mortgage Rate Current Coupon Rate
Note: This figure plots monthly time series of primary mortgage rates (PMMS) for 30-year fixed-rate mort-gage loans, from the Freddie Mac primary mortmort-gage market survey, and current-coupon (CC) mortmort-gage rate, from July 1998 to July 2013.
where 1{CPi>CCt} = 1 if the MBS coupon CPi is higher than the current coupon CCt, and 0 otherwise. By Hypothesis 2, conditional on CPi > CCt, the higher the coupon rate, the
less likely the prepayment, and the stronger the burn-out effect.15 This is because mortgage
rates adjust gradually and households who chose to forgo refinancing opportunities earlier are less likely to refinance in the future.
Finally, we use the time-t aggregate issuanceISUitfor FNMA 30-year MBS with coupon rateCPi to measure the supply of MBS to the dollar roll. Newly issued (“on the run”) MBS
are more likely to be circulated in the markets than are old (“off the run”) MBS that are held by institutional investors.
The units of the variables are as follows. Specialness and OAS are in basis points, mortgage rate and coupon rate are in percentage points (e.g., 3 for a 3% annualized rate), and issuance is in millions of dollars.
Table 4reports panel regressions based on the following model:
DSPit = ∑ t αtDt+ ∑ i γiDi+β1P M M St+β2BOit+β3ISUit+ϵit, (3)
15As a robustness check, we also define a MBS to be burn out if CP
i > CCt+ 1%, and the results are
where DSPit is either DSPitGC or DSPitLIBOR, and Di and Dt are coupon (or security)
dummies and time dummies, respectively, which control for coupon-specific effects or time-specific effects. We report robust t-statistics in parentheses that correct for serial correlation in the residuals clustered at the coupon level.
Table 4: Determinants of Dollar Roll Specialness
DSPGC DSPLIBOR (1) (2) (3) (4) (5) (6) PMMS -89.1209* -67.8822* -43.8756** -87.9048* -66.0455* -39.5748** (-2.2688) (-2.4179) (-5.5447) (-2.2369) (-2.3929) (-4.9361) BO -148.1298** -98.3957+ -79.1649** -148.1986** -100.9300+ -79.2929** (-3.2366) (-2.0688) (-4.6591) (-3.2389) (-2.1437) (-4.6834) ISU -0.0049** -0.0032* -0.0031* -0.0049** -0.0033* -0.0032* (-3.2790) (-2.5861) (-3.0755) (-3.2764) (-2.6123) (-3.0541) N 1,666 1,666 1,666 1,666 1,666 1,666 R2 0.5837 0.3815 0.3239 0.5827 0.3915 0.3331
Coupon Effect Yes Yes No Yes Yes No
Time Effect Yes No No Yes No No
Note: This table reports panel regressions based on the following model:
DSPit= ∑ t αtDt+ ∑ i γiDi+β1P M M St+β2BOit+β3ISUit+ϵit,
where DSPit is either DSPitGC or DSPitLIBOR, and Di and Dt are coupon (or security) dummies
and time dummies, respectively. Robust t-statistics are reported in parentheses based on clustered standard errors at the coupon level. Significance levels: ∗∗ for p <0.01, ∗ forp < 0.05, and + for
p <0.1, wherepis the p-value. The overall sample period is July 1998 to July 2013, with variations depending on coupon rates.
Results in columns (1) and (4) of Table 4, using DSPGC
it and DSPitLIBOR, respectively,
confirm our hypotheses on the determinants of dollar roll specialness: P M M S,BO, andISU
are all significantly affecting the specialness negatively. The economic magnitudes are also large. In particular, a 1% decrease in P M M S increases the dollar roll specialness by about 89 basis points; a 1% decrease of the MBS coupon rate increases the specialness by about 148 basis points; and a decrease of issuance of $9.95 billion, which is roughly one standard deviation of MBS issuance across both time and coupon stacks in our sample, increases
the specialness by 49 basis points (=0.0048*9950). We also observe that the regression coefficients are almost the same across DSPGC
it or DSPitLIBOR, indicating robustness of our
results to which benchmark rates are used to compute the specialness. The inclusion of coupon and time fixed effects inflates theR2s in our baseline regressions in columns (1) and
(4). Nonetheless, even after dropping some or all the fixed effects (columns (2), (3), (5), and (6)), P M M S, BO, and ISU still explain over 30% of the variation in the dollar roll specialness.
The time series persistence in the data may raise concerns about spurious regression results. In addition to the clustered robust t-statistics reported in Table 4, we also run regressions on the first difference based on the following model:
∆DSPit=∑
t
αtDt+β1∆P M M St+β2∆BOit+β3∆ISUit+ϵit. (4)
The regression results are reported in Table5. We still observe significant impacts ofP M M S
and BO on dollar roll specialness, but not ISU.16 The coefficients estimates are lower for
BObut higher forP M M Sthan those in Table4. It is worth pointing out that the statistical insignificance of the supply variables in the panel regression (4) may be due to ISUit being
a poor proxy, or that the supply effect is not quantitatively large.17
5.2
Dollar roll specialness and MBS returns
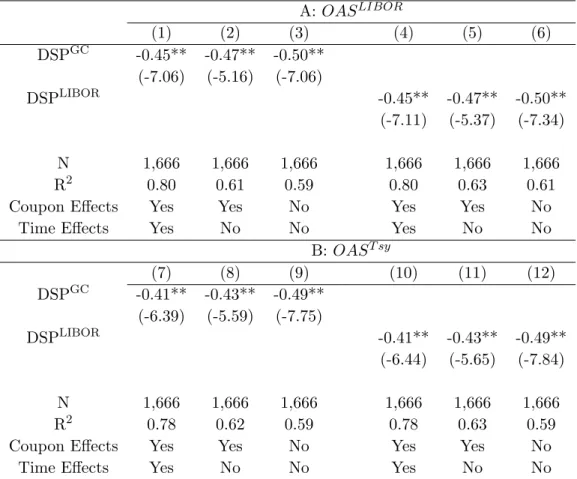
In this subsection, we study the relation between the doll roll specialnessDSP and expected MBS returns. We find a negative relation, as conjectured in Hypothesis4. Our main measure of expected MBS return is OAS, and we check the robustness of the results using a shorter sample of realized returns that we describe shortly.
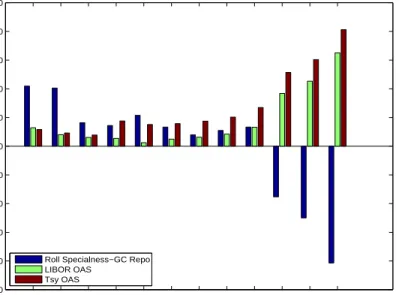
As a motivation, Figure 6 plots the time series averages of OASLIBOR and OAST sy
together with those of DSPGC across coupon rates. A pronounced negative relation can
be observed, with increasing OAS but decreasing dollar roll specialness moving from low to high coupon rates.
To examine whether dollar roll specialness affects OAS across both coupon rates and
16Since the change ofISU
it will miss the payout of the MBS existing ahead of period-t, we also use the
outstanding balance to measure the stock supply. Regression results are similar.
17Interestingly, in the level regression,ISU is the only significant determinant of dollar roll specialness for
Table 5: Determinants of Dollar Roll Specialness: First Difference ∆DSPGC ∆DSPLIBOR ∆PMMS -115.1489+ -119.0819+ (-1.8703) (-1.9404) ∆BO -37.9204+ -39.0663+ (-2.0161) (-2.0605) ∆ISU 0.0002 0.0002 (1.4362) (1.4344) N 1,654 1,654 R2 0.3765 0.3913
Note: This table reports panel regressions based on the following model:
∆DSPit =
∑
t
αtDt+β1∆P M M St+β2∆BOit+β3∆ISUit+ϵit,
where DSPit is either DSPitGC orDSPitLIBOR and Dt is the time dummy. Robust t-statistics are
reported in parentheses based on clustered standard errors at the coupon level. Significance levels: ∗∗ forp <0.01,∗ forp <0.05, and+ forp <0.1, wherepis the p-value. The overall sample period
is July 1998 to July 2013, with variations depending on coupon rates.
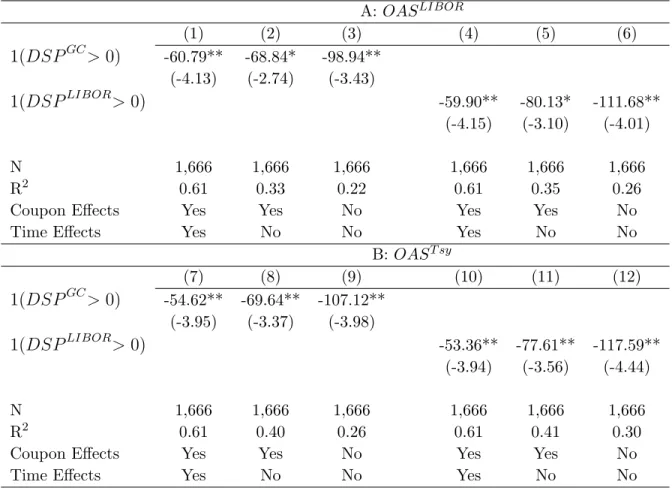
time, Table 6 reports panel regression on the following model:
OASit= ∑ t αtDt+ ∑ i γiDi+β·1(DSPit >0) +ϵit, (5)
where 1(DSPit > 0) is a specialness indicator, taking on the value of 1 if an MBS with
couponCPi is on special in periodtand 0 otherwise, OASit is eitherOASLIBOR orOAST sy,
and Di and Dt are coupon (or security) dummies and time dummies, respectively. Robust
t-statistics are reported in parentheses that correct for serial correlation in the residuals clustered at the coupon level.
Regression results withOASLIBOR and OAST sy are reported in Panels A and B of Table
6, respectively, using bothDSPGC
it and DSPitLIBOR in each panel. We observe from columns
(1) and (4) that the MBS on special has a significant negative premium of 60 basis points relative to the otherwise identical security, whetherDSPGC
it orDSPitLIBORis used to measure
the specialness. The dollar roll special premium is around 54 basis points using OAST sy,