Life Cycle Assessment of coffee
consumption: comparison of single-serve
coffee and bulk coffee brewing
Final Report
Prepared for:
Prepared by:
Quantis
Julie-Anne Chayer, Project Manager
Karine Kicak, Analyst
June 2, 2015
Quantis is a leading life cycle assessment (LCA) consulting firm specialized in supporting companies to measure, understand and manage the environmental impacts of their products, services and operations. Quantis is a global company with offices in the United States, Canada, Switzerland and France and employs close to 70 people, amongst which several are internationally renowned experts in the LCA field.
Quantis offers cutting-edge services in environmental footprinting (multiple indicators including carbon and water), eco design, sustainable supply chains and environmental communication. Quantis also provides innovative LCA software, Quantis SUITE 2.0, which enables organizations to evaluate, analyze and manage their environmental footprint with ease. Fuelled by its close ties with the scientific community and its strategic research collaborations, Quantis has a strong track record in applying its knowledge and expertise to accompany clients in transforming LCA results into decisions and action plans. More information can be found at www.quantis-intl.com.
This report has been prepared by the Canadian office of Quantis. Please direct all questions regarding this report to Quantis Canada.
Quantis Canada 395 Laurier St. West Montreal, Quebec Canada, H2V 2K3 +1 (514) 439-9724 info.canada@quantis-intl.com www.quantis-intl.com
PROJECT INFORMATION
Project title Life Cycle Assessment of coffee consumption: comparison of single-serve
coffee and bulk coffee brewing Contracting
organization
PAC, Packaging Consortium
Liability statement Information contained in this report has been compiled from and/or computed
from sources believed to be credible. Application of the data is strictly at the discretion and the responsibility of the reader. Quantis is not liable for any loss or damage arising from the use of the information in this document.
Version Final report
Project team Julie-Anne Chayer, Project Manager julie-anne.chayer@quantis-intl.com
Edouard Clément, Managing Director edouard.clement@quantis-intl.com Karine Kicak, Analyst karine.kicak@quantis-intl.com
François Charron-Doucet, Quality Control francois.charron@quantis-intl.com Critical review panel Gregory A. Norris, Co-Director, Sustainability and Health Initiative for
NetPositive Enterprise (SHINE), Harvard T.H. Chan School of Public Health (president)
Getachew Assefa, Founder and CEO of Triple Ten Consulting Terrie Boguski, President of Harmony Environmental
Client contacts Alan Blake, Executive Director, PAC NEXT alanblake7@gmail.com
James Downham, President & CEO, PAC, Packaging Consortium jdd@leaderlinx.com
Claudio Gemmiti, Senior VP Innovation & Strategic Growth, Club Coffee LP cgemmiti@clubcoffee.ca
Executive summary
Context
According to the United Nations Environment Programme (UNEP) and the World Resources Institute (WRI), one third of all food produced worldwide is wasted. In an effort to address the issue, PAC launched the PAC FOOD WASTE initiative to investigate the causes of food waste, identify innovative packaging solutions, extend product shelf life and inform and educate the broader community. One of the initiative’s first projects aimed to elucidate the relationships between North American packaging and the causes of food waste along the food value chain through a life cycle assessment (LCA) of coffee systems whose key differences lie in their packaging and coffee brewing process. PAC therefore commissioned Quantis to conduct a formal ISO 14 040-44-compliant LCA study comparing the environmental performances of single-serve coffee using a capsule system and bulk coffee using a drip-brewed system for one 8-oz. serving of filtered coffee in the North American market. The aim was to answer a series of questions, including:
• What is the environmental footprint of single-serve coffee and how does it compare to the footprint of drip-brewed coffee?
• How do consumer habits influence the life cycle impacts (brewing and waste, disposal of the grounds and expired bulk coffee)?
• What is the percentage of each input (including packaging) in the overall footprint, from coffee bean growing to brewing to product and packaging disposal?
Life cycle of a coffee system
The study assessed the life cycle of brewing coffee using single-serve capsules (system 1) or bulk coffee (system 2), from the extraction and processing of all raw materials to the end-of-life management of the coffee and packaging system (see figure i).
The single-serve capsule was modeled to represent a generic capsule based on current designs that uses standard abaca filter. The drip-brewed coffee system was modeled to represent a generic no. 4 standard abaca filter based on current product and packaging designs and a generic bulk coffee packaging system
Figure i: Summary of the life cycle of one serving of coffee and the life cycle impact assessment method IMPACT 2002+ vQ2.21
In order to provide a practical, comprehensive overview of the product system, the LCA considered all identifiable upstream inputs in each life cycle stage. For example, truck transport emissions as well as the impacts of the additional processes and inputs required to produce the fuel were considered when determining the environmental impact of transportation. The production chain of all inputs can
divided into five main life cycle stages: (1) Coffee supply, (2) Materials and production, (3) Distribution, (4) Use, and (5) End-of-life.
The method used to evaluate the environmental impact is the peer-reviewed, internationally recognized IMPACT 2002+ vQ2.21 life cycle impact assessment (LCIA) method adapted by Quantis, which considers 17 different potential impact categories (midpoint) and then aggregates them into four damage (endpoint) categories: climate change, human health, ecosystem quality and resource depletion (see Figure i). They are presented along with the inventory indicator for water withdrawal, which is not yet accounted for in any endpoint category.
A critical review of the study was carried out by a panel of external experts that included Gregory A. Norris (Harvard T.H. Chan School of Public Health), Terrie Boguski (Harmony Environmental) and Getachew Assefa (Triple Ten Consulting) to validate compliance with ISO 14 040-44 standards. The results of the critical review are available in Appendix E.
Consumer behaviours and energy efficiency: key parameters
The coffee systems considered in this study provide very different consumer experiences, and consumer behaviours are vastly different.. Consumers have virtually no control of inputs and outputs of the single-serve system. Conversely the consumer controls all aspects to the drip-brewing process including the amount of coffee brewed, the amount of water used and the amount of time the coffee is left on the hot plate. The results presented in this report indicate that consumer behaviours pertaining to coffee waste and energy use constitute key parameters when determining the environmental performance of a coffee system. Unfortunately, there are few reliable studies or surveys on consumer behaviours in the literature. As a result, this study relied on a series of scenarios tested with sensitivity analyses to pinpoint the tipping points of system comparisons.
It was anticipated that the drip-brewed system would generate two types of coffee waste: coffee waste due to over-preparing (i.e. when the consumer brews more coffee than necessary to avoid shortage) and coffee waste due to inferior freshness (i.e. when the consumer disposes of a certain amount of bulk coffee before it is consumed in its entirety due to lack of freshness since bulk grains are kept over a longer period of time). In addition, certain drip-filter brewers are equipped with a hot plate to keep the coffee warm for a certain period of time—a feature that impacts the energy efficiency of the coffee making process. Certain coffee makers will have an auto shut-off feature that minimizes the time of use
In single-serve systems, the type of capsule and coffee machine determine the amount of coffee used and brewed, virtually eliminating any risk of coffee overconsumption. In addition, the capsules contain a single serving of coffee, which remains fresh until the capsule is inserted into the brewer, thus also considerably limiting the risk of waste due to inferior freshness. For these reasons, neither type of coffee waste was included in the serve system scenarios. However, the energy efficiency of single-serve coffee machines varies according to the type of heater, parts insulation and available features. Flow-type heaters are the most efficient coffee machine water heaters since they are only activated for brewing and switch off immediately afterwards (the automatic shut-off feature is not required). Machines may also have a ready-to-serve mode, which is a preheat function requiring that the coffee machine be equipped with a reservoir of water that is kept at 85°C to 90°C at all times for immediate brewing. In this study, coffee machines equipped with a ready-to-serve mode were considered to be the less efficient option.
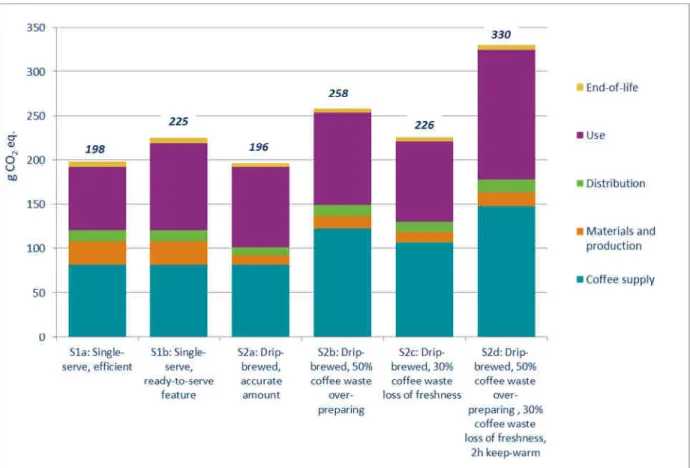
These different behaviours were taken into account when setting out the scenarios in Table i. Table i: Study scenarios
System 1
Single-serve coffee
System 2
Drip-brewed bulk coffee S1a Single-serve, efficient
One serving of single-serve coffee using a machine with a flow-type heater: BEST CASE
S2a Drip-brewed, accurate
One serving of drip-brewed coffee for an accurate amount of coffee and no coffee waste, heated with a
hot plate for 37 minutes: BEST CASE S1b Single-serve, ready to serve feature
One serving of single-serve coffee using a machine with a ready-to-serve feature: WORST CASE
S2b Drip-brewed, 50% coffee waste over- preparing
One serving of drip-brewed coffee with 50% waste due to over-preparing
S2c Drip-brewed, 30% coffee waste, loss of freshness One serving of drip-brewed coffee for an accurate amount of coffeeand30% coffee waste due to inferior
freshness retention
S2d Drip-brewed, 50% coffee waste over- preparing, 30% coffee waste loss of freshness, 2 hours
of heating
One serving of drip-brewed coffee with 50% waste due to overconsumption and 30% coffee waste due to inferior freshness retention, heating with a hot plate for
Results and conclusions
The adoption of a single-serve coffee system by North American consumers would realize significant environmental benefits including coffee waste reduction. Additional benefits could be achieved with the development of coffee machines with better energy-saving capabilities and extended service lives. The single-serve coffee system’s packaging generates more packaging waste. However, when considering the entire life cycles of each system, the amount of coffee required making up for consumer waste and the electricity consumed for brewing (which depend on consumer habits and coffee machine features) drive the differences in impact.
Overall, the single-serve best case scenario posts a better environmental performance than the drip-brew system from the perspective of the systems’ full life cycles. This advantage is specifically attributable to:
• Typical consumer behaviours, including waste due to coffee over-preparation (S2b) and inferior packaging freshness retention (S2c), which cause the drip-brew system to generate greater impacts;
• The amount of coffee required to make up for consumer waste and the electricity consumed for drip brewing, which further increase the overall footprint of the drip system;
• Minimal coffee waste by the single-serve system, which provides an exact serving of coffee even though it creates more packaging waste.
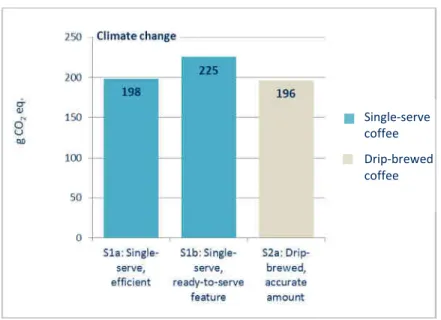
When compared, the best case scenarios for both coffee systems (S1a and S2a) are considered equivalent from the perspective of the climate change indicator (see figure ii). Furthermore, the single-serve coffee system with a ready-to-single-serve feature that keeps the water hot for immediate coffee preparation (S1b) generates a more significant climate change impact than the best case scenario for the drip-brewed coffee system (S2a). But the best case scenario for the drip-brewed coffee system (S2a) is not representative of average consumer behaviours since bulk coffee brewing is not always accurate and consumers tend to make more coffee than necessary to avoid shortage. The climate change scores were sensitive to consumer behaviours, and, when assessing all of the study scenarios, the coffee waste and electricity consumption parameters were found to affect the indicator results:
score for the single-serve best case scenario.
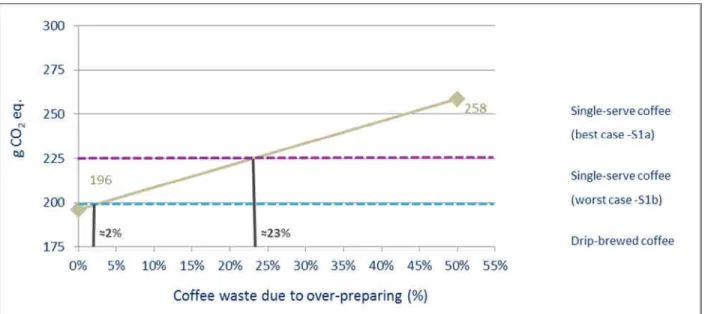
• When compared to the less efficient single-serve coffee machine (ready-to-serve mode, S1b), the tipping points for coffee waste due to overconsumption and inferior freshness retention are 23% and 30%, respectively.
• When both types of coffee waste (50% due to over-preparing and 30% due to inferior freshness) are considered in the same scenario (S2d) along with the longer use of the hot plate (2 hours versus 37 minutes), the gap between the impact scores of the two studied coffee systems widens further.
Contents
Executive summary ... iv
List of figures ... xiv
List of tables ... xv
Abbreviations and acronyms ... xvi
1 Introduction and context ... 17
2 Goal of the study ... 19
2.1 Objectives... 19
2.2 Intended audiences ... 19
2.3 Disclosure and declarations ... 20
3 Scope of the study ... 21
3.1 General description of the studied product systems... 21
3.2 Comparative basis ... 22
3.2.1 Functions and functional unit ... 22
3.2.2 Reference flows ... 24
3.2.3 General description of the system ... 26
3.2.4 Life cycle stages ... 29
3.2.5 Temporal and geographic boundaries ... 30
3.2.6 Cut-off criteria ... 30
4 Approach ... 32
4.1 Allocation methodology ... 32
4.1.1 Incineration with energy recovery ... 32
4.1.2 Recycling ... 34
4.1.3 Freight transport ... 34
4.2.1 Data sources and assumptions ... 35
4.2.2 Data quality requirements and assessment method ... 43
4.3 Impact assessment ... 43
4.3.1 Impact assessment method and indicators ... 43
4.3.2 Limitations of LCIA ... 45
4.4 Calculation tool ... 45
4.5 Contribution analysis ... 46
4.6 Scenarios for sensitivity analyses ... 46
4.7 Uncertainty analysis ... 46
4.7.1 Inventory data uncertainty analysis ... 47
4.7.2 Characterization model uncertainty analysis ... 47
4.8 Coherence analysis ... 47
4.9 Completeness analysis ... 48
4.10 Critical review ... 48
5 Results ... 50
5.1 Influence of consumer habits ... 50
5.1.1 Efficiency of single-serve brewers ... 51
5.1.2 Coffee waste due to over-preparing ... 52
5.1.3 Coffee waste due to inferior freshness retention ... 53
5.1.4 Usage period of the keep-warm mode on a drip-filter brewer ... 55
5.2 Overall comparative results ... 56
5.2.1 Climate change ... 56
5.2.2 Ecosystem quality ... 58
5.4.1 Climate change contribution for the coffee supply stage... 61
5.4.2 Climate change contribution for the materials and production stage ... 62
5.4.3 Climate change contribution for the distribution stage ... 64
5.4.4 Climate change contribution for the use stage... 65
5.4.5 Climate change contribution for the end-of-life stage ... 67
5.5 Summary of key contributors ... 67
5.6 Sensitivity analyses ... 68
5.6.1 Service life of a single-serve brewer and a drip-filter brewer ... 68
5.6.2 Impact assessment with the ReCiPe method ... 69
5.7 Inventory data quality assessment ... 71
5.8 Uncertainty assessment ... 75
6 Discussion and implications ... 79
6.1 Key findings ... 79
6.2 Study limitations ... 81
6.3 Recommendations ... 81
6.3.1 Recommendations for both coffee systems ... 82
6.3.2 Single-serve coffee system recommendations ... 82
6.3.3 Drip-brewed coffee system recommendations ... 82
6.4 Conclusions ... 83
7 References ... 84
8 Appendices ... 88
Appendix A – Equation for the carbon footprint of drip-brewed coffee ... 88
Appendix B – Additional data and assumptions ... 88
List of figures
Figure 1: Studied coffee systems ... 21
Figure 2: Life cycle of a serving of drip-brewed coffee ... 27
Figure 3: Life cycle of a serving of single-serve coffee ... 28
Figure 4: IMPACT 2002+ vQ2.21 midpoint and endpoint categories ... 44
Figure 5: Climate change impact of different brewer types ... 52
Figure 6: Climate change impact as a function of over-preparing waste ... 53
Figure 7: Climate change impact as a function of coffee waste due to inferior freshness retention ... 54
Figure 8: Climate change impact as a function of keep-warm duration... 55
Figure 9: Overall comparative results for climate change ... 56
Figure 10: Overall comparative results for ecosystem quality ... 58
Figure 11: Overall comparative results for water withdrawal ... 59
Figure 12: Climate change contribution (in g CO2 eq.) for the coffee supply stage ... 61
Figure 13: Climate change contribution (in g CO2 eq.) for the materials and production stage ... 63
Figure 14: Climate change contribution (in g CO2 eq.) for the distribution stage ... 64
Figure 15: Climate change contribution (in g CO2 eq.) for the use stage ... 65
Figure 16: Climate change contribution (in g CO2 eq.) for the end-of-life stage ... 67
Figure 17: Climate change impact for different brewer service lives ... 69
Figure 18: Life cycle impacts according to two different LCIA methods... 70
Figure 19: Monte Carlo simulation results for the comparison of the best and worst cases of the two studied coffee systems ... 77
List of tables
Table 1: Study scenarios ... 24
Table 2: Main reference flows ... 25
Table 3: Summary of end-of-life modeling of the different coffee packaging components ... 33
Table 4: Waste electric energy from material incineration (SCLCI, 2010) ... 33
Table 5: Recycling modeling using system expansion ... 34
Table 6: Data and assumptions ... 37
Table 7: Capsule components, materials and weights ... 42
Table 8: Filter packaging ... 42
Table 9: Bulk coffee packaging ... 42
Table 10: Composition of the peer review panel ... 49
Table 11: Main inventory flows in this study ... 60
Table 12: Energy consumption by scenario according to different brewer modes... 66
Table 13: Pedigree matrix used for data quality assessment derived from Weidema and Wesnaes (1996) ... 72
Table 14: Data quality evaluation and importance of data contribution to life cycle impacts ... 73
Table 15: Data background ... 90
Table 16: Transport of raw materials and components ... 91
Table 17: Secondary and tertiary packaging for 12 capsules retail unit ... 92
Abbreviations and acronyms
Al Aluminum
CO2 Carbon dioxide
cm Centimetre
DALY Disability-adjusted life years
EOL End-of-life
EVOH Ethylene vinyl alcohol
FAO Food and Agriculture Organization of the United Nations
FU Functional unit
GHG Greenhouse gas
GWP Global warming potential (generally in g or kg of CO2 eq.)
Ha Hectares
HDPE High-density polyethylene
ISO International Organization for Standardization
kg Kilogram
km Kilometre
kWh Kilowatt-hour
LCA Life cycle assessment LCI Life cycle inventory
LCIA Life cycle impact assessment (method) LDPE Low -density polyethylene
LVF Large volume factor
m Metre
MJ Megajoule
PAC Packaging Consortium
PDF Potentially disappeared fraction
PE Polyethylene
PET Polyethylene terephthalate
PP Polypropylene
PS Polystyrene
R&G Roasted and ground
T Tonne
1
Introduction and context
Heightened concern about environmental sustainability and consumption habits has focused attention on understanding and proactively managing the potential environmental consequences of products and services. Tea and coffee capsules receive a disproportionate focus in such discussions because of their single-use property and contribution to the waste stream. In addition, the estimated penetration of single-serving brewers in US households was over 30% in 2011 and estimated at 23% in 2009, making the sector one of the fastest growing segments in the household industry (ENERGY STAR, 2011).
A leading tool to assess environmental performance is life cycle assessment (LCA), a method defined by the International Organization for Standardization (ISO) 14040-14044 standards (ISO 2006a; ISO 2006b). LCA is an internationally recognized approach that evaluates the relative potential environmental and human health impacts of products and services throughout their life cycle, beginning with raw material extraction and including all aspects of transportation, production, use, and end-of-life treatment. LCA may be used to identify opportunities to improve the environmental performance of products, inform decision-making, and support marketing, communication and awareness-building efforts.
It is important to note that LCA estimates relative potential impacts—limitations that are clearly indicated and accepted in the ISO 14040 series of LCA standards—rather than directly measuring real impacts. Despite these limitations, the concept and need for LCA are sufficiently strong that over the past several decades it has become the principal approach to evaluate a broad spectrum of environmental problems and help optimize the entire sustainability equation. Moreover, LCA is the industry standard for measuring and communicating sustainability.
PAC, Packaging Consortium, a North American not-for-profit corporation, was founded in 1950 and has since become a major voice for the North American packaging industry, driving progressive change in the packaging value chain through leadership, collaboration and knowledge sharing. One of PAC’s core products is the PAC FOOD WASTE initiative that has a vision to be a catalyst for food waste packaging solutions by maximizing the reduction of food waste through packaging solutions that consider strategic retail trends, supply chain implications, life cycle thinking and ecodesign (PAC, 2014).
One of PAC’s three inaugural projects for the PAC FOOD WASTE initiative aims to better understand the relationships between North American packaging and the causes of food waste along the food value
To shed light on the environmental performance of different coffee systems, Quantis was commissioned by PAC to conduct a formal ISO compliant LCA study comparing the environmental performance of single-serve coffee (i.e. a capsule system) and bulk coffee (i.e. a drip-brewed system).
This full LCA was conducted using both primary data from Mother Parkers Tea & Coffee and generic data and considered market-leading single-serve brewers with market-leading coffee capsules, whereas the bulk coffee brewing system results are based on a standard set-up, including the drip filter coffee machine, paper filter and bulk coffee packaging (can and pouch). These data can therefore be used to compare the relative environmental impacts associated with 1) brewing one cup of coffee using a market-leading single-serving capsule and 2) brewing coffee using bulk coffee and a standard drip filter coffee machine.
This LCA should comply with the International Organization for Standardization (ISO) 14040 and 14044 standards (ISO 2006a; ISO 2006b) for public disclosure and was peer-reviewed as a requirement of the ISO LCA standards for the public disclosure of comparative assertions.
2
Goal of the study
This section describes the goal and scope of the study, along with the methodological framework of the LCA. It includes the background and context for this study, the objectives, a description of the product function and product system, the system boundaries, data sources and methodological framework. This section also outlines the requirements for data quality and the review of the analysis.
2.1
Objectives
This study evaluates two coffee systems: 1) single-serve coffee and 2) bulk coffee brewing (drip-brewed).
The specific goals of this study are to:
I. Establish credible and transparent profiles of the potential life cycle environmental impacts of a single-serve coffee system and of a bulk coffee brewing system by utilizing appropriate
databases and accepted LCIA characterization factors and identify the contribution of the different life cycle stages;
II. Identify the magnitude and confidence of the comparative environmental advantages of the studied systems;
III. Identify key data points, uncertainties and methodological choices that might influence comparisons
IV. Ensure that the study complies with the ISO 14044 standards.
This study will provide comparative statements regarding the environmental performance of the two aforementioned systems.
2.2
Intended audiences
The project report is intended to provide results in a clear and useful manner to inform PAC of the environmental performance of the studied systems and may be used for disclosure to external audiences. The results and conclusions presented in this report are subject to a critical review process and may be communicated publicly. According to ISO standards, a critical review of an LCA is mandatory if its results are to be communicated publicly (section 4.10).
2.3
Disclosure and declarations
PAC seeks to evaluate and compare the environmental performance of a single-serve coffee to that of bulk coffee brewing. The project complies with the ISO 14040 and 14044 standards for reports with comparative assertions intended to be disclosed to the public. The only comparisons intended for this study are between the two evaluated scenarios and between life cycle stages and processes within the life cycle of a specific coffee system.
3
Scope of the study
3.1
General description of the studied product systems
Figure 1 illustrates the two studied coffee systems.Figure 1: Studied coffee systems The two studied coffee systems have many common components:
• Arabica coffee from Brazil is considered for both scenarios.
• The single-serve capsule’s filter and the standard no.4 paper filter for drip-brewed coffee are both made out of abaca fibres.
• Direct retail (e.g. supermarket) is considered for both scenarios (Mother Parkers, 2014).
• For both systems, a ceramic mug of 250 ml capacity (mass of 300 g) is considered to be washed after every use and is assumed to have a service life of 500 use cycles.
3.2
Comparative basis
3.2.1 Functions and functional unit
Life cycle assessment relies on a functional unit as a reference to evaluate the components within a single system and or among multiple systems on a common basis. It is therefore critical that this parameter be clearly defined and measurable. The main function of the different products is to provide filtered coffee with two coffee systems.
The functional unit—the quantitative reference used for all inventory calculations and impact evaluations—is:
Provide one 8-oz. serving of filtered coffee from single-serve coffee and from drip-brewed coffee for the North American market
The single-serve coffee system and the drip brewed coffee system with a drip filter machine fulfill the functional unit and are assessed in this project. There may be other types of coffee systems that fulfill this functional unit, such as an espresso machine system, a pad filter system or spray dried soluble coffee with boiler system. These alternative systems are not addressed in this study. Also, although the flavor, mouth feel and overall taste experience of coffee may differ between single-serve and bulk coffee, these aspects will not be covered by the LCA, and the two scenarios are assumed to be functionally equivalent.
Furthermore, consumer behaviours are a key parameter that can affect the way the coffee machine is used throughout its service life (e.g. efficient vs. non-efficient use of the machine) as well as the amount of coffee that is consumed or wasted over a certain period of time. Unfortunately, few reliable studies or surveys on consumer behaviours were identified in this study. Only the assumptions on usage frequency and average use of the warming plate are based on a national survey of US consumers (ENERGY STAR, 2011). Other parameters describing consumer behaviours such as coffee waste are based on assumptions from a previous peer-reviewed article (Humbert et al. 2009) or made by Quantis and PAC. For this reason, certain variations between the two coffee systems, including consumer behaviours, will be assessed in different scenarios or sensitivity analyses. More specifically, variations of the four following behaviour parameters were considered:
1) Efficiency and ready-to-serve mode: The efficiency of a single-serve brewer depends on the type of heater, parts insulation and available features. Flow-type heaters are the most efficient water heaters for coffee machines. This type of brewer is activated only for coffee brewing and switched off immediately when coffee production is finished (Nipkow, 2011) and therefore does not require an auto-power down feature. Brewers may also feature a ready-to-serve mode, which is a pre-heat function requiring that the brewer be equipped with a reservoir of water that is permanently kept at 85°C to 90°C for immediate production. An eco mode may also be available on certain brewers, making it possible to lower the temperature at which the water is kept in the reservoir.
2) Coffee waste due to overpreparation: For drip-brewed coffee, the amount of coffee prepared is not always accurate and to avoid the situation in which the consumer has not prepared enough coffee, the consumer tends to prepare a bit more than necessary. Part of the coffee is therefore prepared in addition to the intended amount, which is referred to as a coffee waste due to over-preparing. The additional amount of coffee prepared is considered to be, in the worst case, 50% of the intended amount. For example, 50% waste means that for 4 cups of coffee consumed, 6 cups are actually prepared.
3) Coffee waste due to inferior freshness retention: Unlike single-serve capsules, which conserve their freshness up until they are inserted in the brewer, drip-brewed coffee is packaged in bulk and therefore consumed over a longer period of time, which ultimately affects the freshness of the product. Consequently, the consumer may discard a certain amount of coffee before it is consumed in its entirety, which is referred to as coffee waste due to inferior freshness retention. The amount of coffee discarded is considered to be, in the worst case, 30% of the coffee contained in the packaging.
4) Period of use of the keep-warm mode: Drip-filter brewers usually feature a warming plate to keep the coffee warm for a certain period of time following its preparation. Certain machines will have an auto-power down feature that minimizes the keep-warm time while other machines or consumers will leave the hot plate active for a long period.
These behaviours are considered in the definition of a series of scenarios that will be assessed. These scenarios are presented in Table 1.
Table 1: Study scenarios
System 1
Single-serve coffee
System 2
Bulk coffee brewing (drip-brewed) S1a Single-serve, efficient
One serving of single-serve coffee using aflow-type heaters: BEST CASE 1
(Quantis assumed the coffee machine model based on Nipkow (2011))
S2a Drip-brewed, accurate
One serving of drip-brewed coffee for an accurate amount of coffee and no coffee waste, heated with a
hot plate for 37 minutes: BEST CASE2 S1b Single-serve, ready to serve feature
One serving of single-serve coffee using a brewer with a ready-to-serve feature: WORST CASE (Quantis assumed the coffee machine model based on
European Commission (2011))
S2b Drip-brewed, 50% coffee waste, overpreparation One serving of drip-brewed coffee with a 50% waste
due to over-preparing
(Quantis assumed 50% waste based on Humbert (2009) ) S2c Drip-brewed, 30% coffee waste, loss of freshness
One serving of drip-brewed coffee for an accurate amount of coffee and 30% coffee waste due to inferior
freshness retention
(Quantis and Mother Parkers assume 30% waste) S2d Drip-brewed, 50% coffee waste
overconsumption, 30% coffee waste loss of freshness, 2 hours of heating
One serving of drip-brewed coffee with 50% waste due to over-preparing and 30% coffee waste due to inferior
freshness retention, heating with a hot plate for 2 hours3: WORST CASE
(Quantis assumed keep-warm times based on ENERGY STAR (2011))
1
The single-serve scenario considering a flow type heater represents the scenario with the lowest energy consumption and will be considered as the reference scenario and best case for the single-serve coffee system.
2
For the drip-brewed coffee system, the reference scenario will also represent the best case, in which no coffee is wasted throughout the entire life cycle and in which the drip-filter coffee maker’s hot plate is used for 37 minutes (average use based on ENERGY STAR 2011).
3
Sensitivity analyses will also be conducted for different coffee waste % due to overpreparation, lack of freshness % and keep-warm times than those considered in the studied scenarios.
Detailed data and assumptions for the studied systems are presented in section 4.2.1. 3.2.2 Reference flows
To fulfill the functional unit, different quantities and types of material and packaging are required for each system. These are known as reference flows. The main reference flows for the studied systems are the following:
Table 2: Main reference flows Material Scenario 1 Single-serve coffee Scenario 2 Drip-brewed coffee Coffee (g) S1a: 10 S1b: 10 S2a: 10 S2b: 15 S2c: 13 S2d: 18 Capsule (unit) 1 -- Filter (unit) -- 1/4 Packaging weight1 (g) Capsule filter: 0.28 Capsule lid: 0.25 Capsule shell: 2.68 Capsule nitrogen: 0.43 Fraction of 12-pack box: 2.76
Filter packaging: 0.063 S2a: Coffee pouch: 0.24
S2a: Coffee can: 0.81 S2a: Coffee pouch: 0.24
S2b: Coffee can: 0.81 S2b: Coffee pouch: 0.36 S2c: Coffee can: 1.06 S2c: Coffee pouch: 0.31 S2d: Coffee can: 1.47 S2d: Coffee pouch: 0.43 Distribution weight (g) 17.9 S2a: 11.3 S2b: 16.9 S2c: 14.7 S2d: 20.2 Brewer (unit) 0.0005 0.0005 Mug (unit) 1/500 1/500
Electricity consumption for
dishwashing (Wh) 30 36
Electricity consumption for coffee preparation and keep-warm mode (Wh) S1a: 34 S1b: 70 S2a:59 S2b: 76 S2c: 59 S2d: 131 End-of-life of coffee (used
or lost due to freshness) (g) S1a: 10 S1b: 10 S2a: 10 S2b: 15 S2c: 13 S2d: 18 End-of-life packaging weight2 (g) 6.0 S2a: 1.1 S2b: 1.6 S2c: 1.4 S2d: 2.0 1
Packaging weights presented in this table do not include production losses.
2
Includes packaging that ends up at consumer. Capsule tertiary packaging and filter and bulk R&G coffee secondary and tertiary packaging represent a small amount of packaging and are not shown in this total. Their end-of-life impacts were, however, compiled in this study.
3.2.3 General description of the system
This study assesses the life cycle of brewing coffee using single-serve capsules or bulk coffee, from the extraction and processing of all raw materials to the end of life of the coffee and its packaging system. In the case of the single-serve capsule, it is modeled to represent a generic capsule that uses a traditional abaca filter based on current designs. In the case of the drip-brewed coffee system, it is modeled to represent a generic no. 4 filter that uses a traditional abaca filter and based on current designs and packaging as well as a generic bulk coffee packaging system based on current designs. The system boundaries identify the life cycle stages, processes, and flows considered in the LCA and should include all activities relevant to attaining the above-mentioned study objectives. Therefore, it is necessary to provide the specified function. The following paragraphs present a general description of the two systems as well as the temporal and geographic boundaries of this study.
As illustrated in Figure 2 and Figure 3, the systems are divided into five principal life cycle stages: (1) coffee supply, (2) materials and production, (3) distribution, (4) use and (5) end of life.
Within each of these stages, the LCA considers all identifiable upstream inputs to provide as comprehensive a view as is practical of the product system. For example, when considering the environmental impact of transportation, not only are the emissions of the truck considered but the impacts of the additional processes and inputs needed to produce the fuel are also included. The production chain of all inputs is therefore traced back to the original extraction of raw materials.
The study focused on the life cycle of a serving of coffee based on two coffee making systems. All system components and production processes were included using either readily available information or a reasonable estimate. In cases in which important information was unknown, uncertain or highly variable, sensitivity analyses were performed to evaluate the potential significance of the data gap(s) or data influence (see section 5 for details).
3.2.4 Life cycle stages
For the purposes of this analysis, the system was grouped into the following principal life cycle stages. 1) Coffee supply: pertaining to the raw and secondary materials required to manufacture coffee.
For instance, it includes the green coffee cultivation, coffee roasting and grinding, etc.
2) Materials and production: including the transport and production of the capsule components (lid, outer shell, filter, etc.), the standard no. 4 filter from abaca paper, the bulk R&G coffee primary packaging as well as secondary and tertiary packaging for the capsules, standard filter and bulk coffee packaging.
3) Distribution: including all stages of transport and storage related to the capsules, filters and bulk coffee from the manufacturing plant to the distribution center and then to the retailer. The distance and mode scenarios were kept equivalent between systems, but since the different packaging systems vary in weight, the impact of their transport is not equivalent.
4) Use: including the energy required for coffee preparation (water heating for a temperature difference of 70°C) for both the single-serve brewer and the drip filter coffee machine. Energy for the use of a hot plate is also considered for the drip filter coffee machine. Also included in this stage for both scenarios is the manufacturing of the coffee brewers and coffee mug as well as the washing of the mug. For the drip-brewed scenario, the washing of the decanter was also
5) End-of-life: including the activities associated with the waste management of coffee and packaging. The capsule and the standard no.4 filter are assumed to be disposed of at the end of their service life, to be picked up at curbside and sent to the landfill or incineration site based on North American waste management statistics. Filter and coffee packaging (primary, secondary and tertiary) and capsule packaging (secondary and tertiary), if recyclable, are considered to be recycled at average North American residential rates. For the drip-brewed coffee system, 3.9% of households will compost the used coffee grounds instead of putting them in the garbage, based on the average percentage of food waste that is composted in the US (EPA, 2011).
The supply and resources sub-system pertains to resource procurement (water, energy, chemicals and materials) including the extraction, treatment and transformation of natural resources and transport to use sites (e.g. polymers, fuels, etc.).
Finally, the waste management and emissions sub-system pertains to activities associated with the transport and treatment of waste generated (e.g. procurement, production of virgin material and distribution) and emissions to air, water and soil over the considered life cycle stages.
3.2.5 Temporal and geographic boundaries
This LCA is representative of the coffee industry and associated processes in North America at the time the study is conducted (2014). The data and assumptions are intended to reflect current equipment, processes and market conditions for distribution and retail. It should be noted, however, that certain processes within the system boundaries may take place anywhere or anytime. For example, the processes associated with the supply chain and waste management may take place in Asia, North America or elsewhere in the world. In addition, certain processes may generate emissions over a longer period of time than the reference year. This applies to landfilling, which causes emissions (biogas and leachate) over a period of time whose length (several decades to over a century/millennium) depends on the design and operation parameters of the burial cells and how the emissions are modeled in the environment.
3.2.6 Cut-off criteria
Processes or elementary flows may be excluded if their contributions to the total system’s mass or energy flow or environmental impact are less than 1%. All product components and production
database is included in the background data (e.g. data indirectly involved in the model) for this study in order to be as comprehensive as possible.
Based on Quantis’ past experience and previous studies (e.g. Humbert et al. 2009) or the relatively low contribution of the life cycle sub-stages to which they pertain, the following processes are excluded from the study due to their contribution, which is expected to be lower than the cut-off criteria, and the lack of readily available data:
• Packaging of the green coffee
• Packaging of bulk raw materials (e.g. plastic sheet roll stock) • Glue on cardboard and paper packaging
• Activities linked to the insertion into the capsules are excluded from the study • Sealing of the lids onto the capsules
• Fuel for lift and other mechanical support used during storage • Distribution and purchase trip for the coffee machine
• Distribution and packaging of the mug
• Cleaning and decalcification agent for machine other than detergent (limescale remover or similar) as well as the distribution and packaging of the detergent
4
Approach
4.1
Allocation methodology
A common methodological decision point in LCA occurs when the studied system is directly connected to a past or future system or produces co-products. This occurs at production (e.g. abaca cultivation yields biomass, co-product of pulping process), manufacturing (e.g. energy use and fuel use are aggregated at the plant level for many production lines) and at end of life (e.g. energy recovery during the incineration of the different coffee packaging components). When systems are linked in this manner, the boundaries of the system of interest must be broadened to include the adjoining system or the impacts of the linking items must be distributed—or allocated—across the systems. While there is no clear scientific consensus on an optimal method to handle this in all cases (Reap et al. 2008), many possible approaches have been developed, and each may have a greater level of appropriateness in certain circumstances.
ISO 14044 prioritizes the methodologies related to applying allocation. It is best to avoid allocation through system subdivision or expansion. If that is not possible, then allocation using an underlying physical relationship should be carried out. If using a physical relationship is not possible or does not make sense, another relationship may be used.
4.1.1 Incineration with energy recovery
An allocation decision must be made regarding the additional functions provided by incineration such as energy recovery, which, by definition, provides an energy source for use by another system. The electricity produced by the incineration of capsules and standard no. 4 filters will be used by another (receiving) life cycle, which may be one of thousands industrial processes. The flow of energy must be allocated (shared) between the emitting and receiving product systems. The flows for each system are modeled according to the system expansion approach, as described in Table 3. This is represented as the net values of the inventory flows associated with the treatment process (i.e. incineration) and credited (negative) inventory flows associated with the production of conventionally-generated energy (electricity).
Table 3: Summary of end-of-life modeling of the different coffee packaging components Impact Credit
Landfill Paper and plastics None
Incineration Paper and plastics Electricity generation
It is important to note that no allocation was made in the foreground processes (i.e. processes directly linked to the studied system). For every multi-output case, the multifunctionality was covered by a system expansion of the boundaries, in keeping with the study objectives. Thus, in the case of waste-to-energy incineration, a functional equivalence was ensured by including the production of electricity. The electrical energy recovered from incinerated waste varies according to the type of material incinerated, as presented in Table 4.
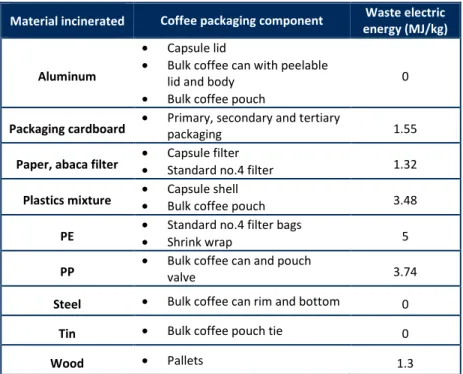
Table 4: Waste electric energy from material incineration (SCLCI, 2010)
Material incinerated Coffee packaging component Waste electric energy (MJ/kg)
Aluminum
• Capsule lid
• Bulk coffee can with peelable lid and body
• Bulk coffee pouch
0
Packaging cardboard • Primary, secondary and tertiary packaging 1.55
Paper, abaca filter •• Capsule filter Standard no.4 filter 1.32
Plastics mixture •• Capsule shell Bulk coffee pouch 3.48
PE •• Standard no.4 filter bags Shrink wrap 5
PP • Bulk coffee can and pouch valve 3.74
Steel • Bulk coffee can rim and bottom 0
Tin • Bulk coffee pouch tie 0
Wood • Pallets 1.3
Although takeback initiatives exist for recycling of capsules and composting of coffee grounds (Nespresso, 2014; Keurig, 2014), the majority of used capsules end up in the waste stream. For the purposes of this study, it was assumed that once a material is sent to disposal, 81% (by mass) of waste is sent to landfill and 19% is sent to incineration with energy recovery (USEPA, 2011).
4.1.2 Recycling
Single-serve capsules, standard no. 4 filters and bulk coffee waste are considered to be thrown out after use. Primary, secondary and tertiary filter packaging as well as bulk coffee secondary and tertiary packaging are considered to be recycled at average North American residential rates (see Table 6 for details). As for R&G coffee packaging, only the plastic lid of the can is considered to be recycled since the composite can and pouch are considered to be non-recyclable. In order to avoid allocation when modeling recycling, the expansion boundary approach was used, meaning that materials recycling contributes to avoiding the production of virgin materials and accounts for the impact of the recycling process itself. Table 5 presents a list of recycled materials and associate virgin materials avoided.
Table 5: Recycling modeling using system expansion
Recycled material Recycling inputs Avoided virgin material1 Cardboard box Corrugated recycled fibre Core board Corrugated box Corrugated recycled fibre Core board
PE wrapping Electricity (N-Am) 0.6 kWh HDPE
1
Recycling inputs and avoided materials were selected based on ecoinvent DB recommendations for recycled materials 4.1.3 Freight transport
As seen in Figure 2 and Figure 3 on system boundaries, the impact of transporting the different coffee system components and their packaging is included in this study. While component and raw materials transport options are treated distinctly for the different systems based on the supplier’s location and assumptions, it was not possible to obtain sufficient information on the distribution profile of different marketed capsules. Moreover, the distribution profile of single-serve capsules production facility to consumers is dependent on market share and size (e.g. network of distribution centers) and consumer behaviours (e.g. online versus retail). Because of the high variability and uncertainty associated with the distribution stage of the two studied systems, distance and transport modes were considered identical. It is important to note that volume limited transportation was considered for several transport stages in the current study.
4.1.4 ecoinvent processes with allocation
Many of the processes in the ecoinvent database also provide multiple functions, and allocation is required to provide inventory data per function (or per process). This study accepts the allocation method used by ecoinvent for these processes. It should be noted that the background allocation methods used in ecoinvent, such as mass or economic allocation, may be inconsistent with the approach used to model the foreground system. While this allocation is appropriate for foreground processes, the continuation of this methodology into the background datasets would add complexity without substantially improving the quality of the study.
4.2
Life cycle inventory
The quality of the LCA results depends on the quality of the data used in the evaluation. Every effort was made to rely on the most credible and representative information available in this study.
4.2.1 Data sources and assumptions 4.2.1.1 Primary and secondary data
Life cycle inventory (LCI) data collection mainly pertains to the materials used, the energy consumed and the waste and emissions generated by each process included in the system boundaries. Primary data was collected directly from Mother Parkers or from direct measurements for the primary materials and material weights and data related to transportation distances, modes and efficiency.
Additional information describing the remaining aspects of the life cycle was collected from a variety of publications and experts and especially studies published by the Food and Agriculture Organization of the United Nations (FAO), the US Environmental Protection Agency (USEPA), ENERGY STAR and scientific journal articles. Several parameters were sourced from Quantis’ internal guidelines, which are based on published and confidential sources as well as expert estimations.
All life cycle inventory data sources were taken from the ecoinvent database v2.2 (SCLCI 2010), which is the main source for secondary LCI data. It should be noted that most, though not all, of the data in ecoinvent is of European origin and produced to represent European industrial conditions and processes. Therefore, several modules were adapted in order to enhance their representativeness of the studied products and contexts. Consequently, for all the activities related to abaca that take place in a specific geographic context, the ecoinvent modules were adapted by replacing the European electricity
• As an estimate, abaca harvesting and pulping processes use grid mixes from Asian countries. The production of abaca fibres uses an Indian grid mix for certain foreground processes (i.e. processes directly linked to the studied system), while the pulping processes use an estimated Thailand grid mix;
• Abaca filter production uses the grid mix for the UK, where the facility is located;
• An average North American grid mix was used for foreground and background processes for the manufacturing of the capsule, standard no.4 filter and bulk coffee can and pouch. This mix represents an average of the different electricity mixes associated with the production locations of the different competing brands;
• The North American grid mix was used for background processes (i.e. all processes directly or indirectly related to foreground processes). In this case, since procurement for the various stages of the life cycle may not only occur in Canada, the North American grid mix was more appropriate. For example, all foreground processes occurring at capsule manufacturing facilities (e.g. shell cutting) required background processes that were adapted to the North American energy context.
The data’s geographic representativeness was taken into account as part of the data quality assessment. 4.2.1.2 Key assumptions
Table 6: Data and assumptions
Life cycle stage Scenario 1: single-serve coffee Scenario 2: Drip-brewed coffee
Coffee supply
• The capsules are used to deliver coffee or tea of many different types and flavours. Thus the numerous varieties of coffee and tea that may be contained in the capsules are considered to be outside the boundaries of the study. Only a generic type and amount of coffee is considered in the full life cycle analysis to estimate its importance.
• Green coffee production is considered to be identical to the production described in Coltro et al. (2006) and Humbert et al. (2009a), and roasting and grinding is as described in De Monte (2003).
• The single-serve capsule contains 10 g of coffee (Mother Parkers, 2012).
• The preparation of an accurate serving of drip filter coffee requires 10 g of coffee (Mother Parkers, 2014).
Materials and
production Capsule production:
• The studied capsule uses a typical filter of abaca fibres and is composed of a multi-layer polystyrene based shell and a multi-layer aluminium lid.
• The studied conventional capsule is the leading design on the market and may be used with any Keurig single-serving brewer or other compatible coffee machines.
• To prevent coffee oxidation, nitrogen is injected into single-serve capsules.
• Capsule components, materials and weights are presented in Table 7.
• An electricity consumption of 0.00288 kWh was used to model shell production by thermoforming, lid cutting, shell cutting, assembly, use of conveyors, filling and packing (Mother Parkers, 2012).
• Shell composition was assumed to be 94.1% PS, 4.3% PE and 1.6% EVOH (Mother Parkers, 2012). The processing of shell plastic sheet was modeled by using generic ecoinvent processes such as extrusion plastic film.
• Lid composition was assumed to be 57.9% PE, 28.5% Al foil and 13.6% PET (Mother Parkers, 2012).
• Processes for lid production were modeled by using generic
ecoinvent processing such as sheet rolling, calendaring as a proxy for lamination of aluminum with PET and HDPE, printing and die cutting.
• The printing area considered per lid is 19.6 cm2 (Mother Parkers,
Filter production and packaging:
• The studied filter for drip filter coffee preparation is a typical no.4 filter of abaca fibres weighing 0.9 g (Quantis measurement).
• The filters are cut and packed at the filter production facility, which is considered to be located in North America.
• The boxed filters are marketed in a box made of solid bleach board. A 19% packaging production loss is considered (Quantis assumption), which is sent to a recycler. They filters are distributed in the same shipment box as the single-serve 12-packs with the same pallet and same amount of LDPE shrink wrap. The shipment box fits 18 boxes of 40 filters and 9 boxes of 100 filters (Quantis assumption, based on calculations).
• The bagged filters are marketed in a bag made of HDPE. A 19% packaging production loss is considered (Quantis assumption). The filters are distributed in the same shipment box as the single-serve 12-packs with the same pallet and same amount of LDPE shrink wrap. The shipment box fits an estimated 100 bags of 100 filters and 50 bags of 200 filters (Quantis assumption, based on calculations).
• Table 8 presents the formats and weights of the filter packaging options.
Table 6: Data and assumptions
Life cycle stage Scenario 1: single-serve coffee Scenario 2: Drip-brewed coffee
• Lids supplied to the capsule production facility were assumed to be precut, preprinted and packaged in cartons (1 000 units/carton) and corrugated shipment boxes (18 cartons/box) based on supplier information for a similar product (Alibaba, 2012).
Capsule packaging:
• The studied capsule is marketed in a 12-unit box made of solid bleach board weighing 33.13 g (Quantis assumption and
measurement). A 19% packaging production loss is considered for the box (Quantis assumption), which is sent to a recycler.
• Tertiary packaging includes a corrugated shipment box weighing 145.04 g that fits six 12-unit boxes, LDPE wrapping weighing 150 g and a wood pallet weighing 26.2 kg that fits 120 boxes (8 640 capsules) (Mother Parkers, 2012).
• The service life of the pallet is assumed to be 50 years.
• The pouch is a 4-ply structure: 0.48 mil PET / ink / adhesive / 0.35 mil Foil / adhesive / 0.48 mil PET / adhesive / 3 mil PE (Mother Parkers, 2014).
• Coffee cans are distributed on a corrugated shipment tray weighing 119 g that fits 6 cans with 30 g of LDPE shrink wrap per tray. Tertiary packaging for the cans includes a wooden pallet that can hold 49 trays and 88 g of shrink wrap (Mother Parkers, 2014).
• Coffee pouches are distributed on a corrugated shipment box weighing 300 g that fits 12 pouches. Tertiary packaging for the pouches includes a wooden pallet that can hold 60 boxes and 88 g of shrink wrap (Mother Parkers, 2014).
• Table 9 presents the bulk packaging formats and weights.
Materials and production
Abaca and pulp production for filters:
• Abaca production is considered to be 14% from Ecuador and 86% from the Philippines. Based on FAO statistics, the average production share of abaca from 2004 to 2010 is 14% Ecuador, 83% Philippines and 3% other countries (FAO 2010). Since abaca from countries other than Ecuador and the Philippines are unknown and of little importance, the share was modeled as a Philippines production (Quantis assumption).
• A correction factor was applied to take into account differences in yield between jute and abaca production. Average yields are considered as follows: jute 1.8 T/ha; abaca from Ecuador 1.4 T/ha (El Telégrafo, 2012); abaca from the Philippines 0.53 T/ha (Bureau of Agricultural Statistics, 2009). To the authors’ knowledge, Abaca production yield in Ecuador is not available from FAO documents or other publications by the Ecuadorian government. However, an online publication from the Bureau of Agricultural Research of the Republic of the Philippines states that the Ecuador yield ranges from 1 to 1.5 T/ha (Cuevas, 2002), which is coherent with the selected yield reported by a local Ecuadorian
newspaper.
• A 60% rate for mechanical abaca harvesting in the Ecuador and 10% in the Philippines were estimated. The Philippines production is mostly done manually, while some mechanical support is used in Ecuador (CFC/UNIDO/FIDA, 2009).
• Fuel and water consumption to operate mechanical decorticators were taken for a technical document based on a field trial (UNEP, 2009).
Table 6: Data and assumptions
Life cycle stage Scenario 1: single-serve coffee Scenario 2: Drip-brewed coffee
• Transport of abaca pulp to the filter production facility was assumed to be by freight ship and truck (Quantis assumption based on research).
• A small distance (2 km) of tractor use was estimated for displacement within the Philippines farms (Quantis assumption).
• The ecoinvent process sulphate pulp, from eucalyptus, unbleached, at pulp mill in Thailand was used to approximate abaca pulp production in the local context by substituting eucalyptus fibre with abaca fibre. A yield of 70% was used to model the pulping of abaca fibre (Jiménez, E. et al., 2005).
• Composition of abaca filter was assumed to be: abaca 72%, wood pulp 8%, PE 20% (HunterConsult Incorporated, 1997; Mother Parkers, 2012).
• HDPE was used to model polyethylene since it is a form of PE often used in the food industry (PlasticEurope, 2010). Film extrusion was used as a proxy for the processing of HDPE granulates.
• The process for production of Kraft paper was used as a proxy for the wet laid process, which is similar to paper production except that it is made from synthetic fibres blended with the natural fibres (Edana, 2008). Thus, the processes for paper production would account for the abaca filter production step.
• The Kraft paper, bleached, in Europe database process was adapted to approximate the abaca portion of the filter and was modified by substitution of softwood by abaca pulp. Pulp to paper ratio for abaca was assumed equivalent to softwood’s.
• 5% losses were assumed for abaca filter production (Quantis assumption).
• The supply of filters to the capsule production facility was assumed to be precut and packaged in cartons (1 000 units/carton) and corrugated shipment boxes (18 cartons/box). No data were available for filter supply packaging. Thus, these reference flows were calculated based on lids supply packaging.
• The supply of no. 4 filters to the filter production facility was assumed to be shipped in roll stocks (Quantis assumption).
• The energy requirements for die cutting were estimated based on technical information on a YIZHAN Model ZBS-350 machine assuming 75% of power in operation (Quantis assumption). It was assumed that one punch cuts 100 filters at once (Quantis assumption).
Distribution • Direct retail (e.g. supermarket) is considered for both scenarios (Mother Parkers, 2014).
• Truck transport is modelled using ecoinvent v2.2 with data adaptation for a North American context.
• Storage time in distribution centre is considered to be of 3 months on average (Quantis assumption) for capsules, bulk coffee and coffee filters. Shelving duration for capsules, bulk coffee and coffee filters is considered to be of 1 month on average.
• The average electricity consumption for storage and shelving at distribution centres and supermarkets is 6 kWh/m3·yr and is based on Quantis internal knowledge.
• For transport from the manufacturing facility to the distribution centre, a transport distance of 1 007 km was considered for both scenarios and is based on single-serve manufacturing plants and warehouses locations (Quantis assumption based on research). It was assumed that 60% of the transport is by freight train and 40% by truck (Quantis assumption).
• For the transport from the distribution centre to the supermarket, an average transport distance of 720 km was considered. This distance is based on Quantis internal knowledge. Transport is by truck only (Quantis assumption).
Table 6: Data and assumptions
Life cycle stage Scenario 1: single-serve coffee Scenario 2: Drip-brewed coffee
Use • Usage frequency of single-serving brewer is assumed to be 275 coffees per year based on US use profiles (ENERGY STAR, 2011).
• Bill of material and service life of the brewer is assumed to be similar to the hard cap espresso maker (European commission, 2011), which is estimated at 7 years (ENERGY STAR, 2011). It is assumed that manufacturing and assembly occur in China (Quantis assumption). A sensitivity analysis on machine service life will be conducted.
• The brewer considered in scenario 1.a) is assumed to have a flow-type heater, the most efficient water heaters for coffee machines. This type of brewer is activated only for coffee brewing and switched off immediately when coffee production is finished (Nipkow, 2011) and therefore does not require an auto-power down feature. Electricity consumption includes warm-up only, for a temperature difference of 70°C. Measured values according to
TopTen-measurements (Josephy, 2011) range from 8.1 to 14.7 Wh for 80 ml of heated water. Median value was used to model energy
consumption. No ready-to-serve mode (i.e. the water is kept hot for immediate production), standby mode (i.e. electronics and display are active) or off mode (i.e. the machine is inactive but is not out of tension, where residual electricity consumption usually occurs over long periods of time) were considered for this scenario.
• Scenario 1.b) represents the use of a coffee machine with an additional feature, the ready-to-serve mode. The brewer that is considered includes a pre-heat feature, which consists of a reservoir of water kept at 85°C to 90°C for immediate production as long as the ready-to-serve mode is activated. It was assumed that the auto-power-down feature and the eco mode that reduces the
temperature that the water is kept at in the reservoir are not used by the consumer. The energy consumption to initially get the water to 85°C to 90°C is the same as for the scenario 1.a) brewer. The ready-to-serve mode is assumed to consume 10 W and used on average 11 hours a day when considering 3 coffees of 240 ml a day
• Usage frequency of drip filter coffee machine was assumed to be 338 coffees per year based on US use profiles (ENERGY STAR, 2011).
• Each preparation of bulk brewing coffee provided 1 servings of 8 oz.
• Bill of material of a typical drip coffee machine was used (European commission, 2011). Service life of the drip coffee machine is estimated at 6 years (ENERGY STAR, 2011). It was assumed that manufacturing and assembly occur in China (Quantis assumption). A sensitivity analysis on machine service life will be conducted.
• Electricity consumption of a drip coffee machine includes warm-up for a temperature difference of 70°C and keep-warm mode. Measured values according to TopTen-measurements (Josephy, 2011) range from 8.1 to 14.7 Wh for 80 ml of heated water. Median value was used to model energy consumption. Keep-warm mode is reported to be 40 W on average (Nipkow, 2006). No standby mode (i.e. electronics and display are active) or off mode (i.e. the machine is inactive but is not out of tension, where residual electricity consumption usually occurs over long periods of time) were considered. Average use of the warming plate is of 37 minutes (ENERGY STAR, 2011). A sensitivity analysis on keep-warm mode duration will be performed.
• A ceramic mug of 250 ml capacity (mass of 300 g) is considered to be washed after every use and is assumed to have a service life
estimated at 500 use cycles.
• The drip filter machine also includes a decanter that is rinsed (2 l of cold water on average) between every preparation and dish-washed every 10 preparations. The decanter is assumed to occupy 1/20 of the dishwasher.
• Only mechanical dishwashing is considered for washing mugs. Lifetime, loading, detergent use and water and electricity
consumption was modeled according to use phase data published by Humbert et al., 2009.