ASSESSMENT OF SOIL EROSION HAZARD AND PRIORITIZATION FOR
TREATMENT AT THE WATERSHED LEVEL: CASE STUDY IN THE
CHEMOGA WATERSHED, BLUE NILE BASIN, ETHIOPIA
W. BEWKET1* AND E. TEFERI2 1
Department of Geography and Environmental Studies, Addis Ababa University, P.O. Box 150372, Addis Ababa, Ethiopia
2Department of Land Resources Management and Environmental Protection, Mekelle University, P.O. Box 3194, Mekelle, Ethiopia
Received 3 January 2009; Revised 24 June 2009; Accepted 29 June 2009
ABSTRACT
Soil erosion by water is the most pressing environmental problem in Ethiopia, particularly in the Highlands where the topography is highly rugged, population pressure is high, steeplands are cultivated and rainfall is erosive. Soil conservation is critically required in these areas. The objective of this study was to assess soil erosion hazard in a typical highland watershed (the Chemoga watershed) and demonstrate that a simple erosion assessment model, the universal soil loss equation (USLE), integrated with satellite remote sensing and geographical information systems can provide useful tools for conservation decision-making. Monthly precipitation, soil map, a 30-m digital elevation model derived from topographic map, land-cover map produced from supervised classification of a Land Sat image, and land use types and slope steepness were used to determine the USLE factor values. The results show that a larger part of the watershed (>58 per cent of total) suffers from a severe or very severe erosion risk (>80 t ha1y1), mainly in the midstream and upstream parts where steeplands are cultivated or overgrazed. In about 25 per cent of the watershed, soil erosion was estimated to exceed 125 t ha1y1. Based on the predicted soil erosion rates, the watershed was divided into six priority categories for conservation intervention and 18 micro-watersheds were identified that may be used as planning units. Finally, the method used has yielded a fairly reliable estimation of soil loss rates and delineation of erosion-prone areas. Hence, a similar method can be used in other watersheds to prepare conservation master plans and enable efficient use of limited resources. Copyright#2009 John Wiley & Sons, Ltd.
key words: soil erosion; watershed treatment; USLE; Ethiopia; rusle
INTRODUCTION
Soil erosion constitutes a global environmental and economic problem (Pimentelet al., 1993, 1995; Lal, 2001). It causes loss of fertile topsoil and reduces the productive capacity of the land and thereby creates risk to global food security. It also affects negatively the natural water-storage capacity of catchments, design-life of man-made reservoirs and dams, quality of surface water resources, aesthetic landscape beauty and ecological balance in general. The fact that soil is almost a non-renewable natural resource over the human time-scale makes soil erosion a critical problem. Although many countries of the world suffer from the problem of accelerated soil erosion, the developing countries suffer more because of the inability of their farming populations to replace lost soils and nutrients (Erenstein, 1999). In Ethiopia, one of the least developed countries of the world, soil erosion by water constitutes a severe threat to the national economy (Hurni, 1993; Sutcliffe, 1993; Sonneveld, 2002; MoARD and World Bank, 2007). According to Sonneveld (2002), the economic cost of soil erosion is around US$ 10 billion per year; while MoARD and World Bank (2007) state that the minimum annual cost of soil erosion ranges between 2 and 3 per cent of the national agricultural GDP. This clearly shows the extent to which soil erosion is a contributory factor to the country’s structural food insecurity problem. The underlying cause for the excessive rate of soil loss is the unsustainable
land degradation & development
Land Degrad. Develop.20: 609–622 (2009)
Published online 6 August 2009 in Wiley InterScience (www.interscience.wiley.com)DOI: 10.1002/ldr.944
* Correspondence to: W. Bewket, Department of Geography and Environmental Studies, Addis Ababa University, P.O. Box 150372, Addis Ababa, Ethiopia.
exploitation of the land resource which is manifested by extensive de-vegetation for fuelwood and other uses and expansion of cultivation and grazing into steepland areas (Tekele and Hedlund, 2000; Zeleke, 2000; Bewket, 2002; Amsaluet al., 2007). On the other hand, despite the considerable efforts made to develop and promote different types of soil and water conservation technologies, acceptance, adoption and sustained use by the land users have not been widespread for various reasons (Shiferaw and Holden, 1999; Bekele and Drake, 2003; Amsalu and de Graaff, 2007; Anleyet al., 2007; Bewket, 2007). Soil erosion thus largely remains a problem to be tackled as part of the government’s efforts at ensuring food security, poverty reduction and environmental sustainability.
Planning for and implementation of effective soil and water conservation measures in a site require, among other things, a detailed understanding of the extent, risk and spatial distribution of the problem; that is, soil erosion. It has immediate significance to conservation agencies, development agents and field technicians for a targeted and cost-effective conservation intervention by identifying most vulnerable landscapes and setting of priorities. The objective of this study was to assess soil erosion hazard in a typical highland watershed (the Chemoga watershed) in the Blue Nile basin and demonstrate that a simple erosion assessment model, the universal soil loss equation (USLE), integrated with satellite remote sensing and geographical information systems can provide useful information for conservation decision-making.
The USLE is an empirical equation that was developed to predict soil erosion rates from agricultural fields in the United States of America (Renardet al., 1994). It has, however, been used widely all over the world either in the original or modified form (Mellerowicz et al., 1994), including in Ethiopia (Hurni, 1985a,b; Helden, 1987; BCEOM, 1998), basically because of its simplicity and limited data requirement. Even though the equation was originally meant for predicting soil erosion at the field scale, its use in a GIS environment has enabled application for large areas and satisfactory results have been reported (Mellerowiczet al., 1994), for delineation of erosion-prone areas and prioritization of micro-watersheds for a targeted and cost-effective conservation planning purposes.
THE CASE STUDY SITE: THE CHEMOGA WATERSHED
The Chemoga watershed lies within 108180N to 108390N and 378440E to 378530E, and covers a total area of 3469 km2. It forms part of the Blue Nile basin in the northwestern highlands of Ethiopia, and it is characterized by diverse topographic conditions. The elevation ranges from 2420 to 3980 m (Figure 3). A mountainous and dissected terrain with steep slopes characterizes the upstream part; and an undulating topography and gentle slopes characterize the downstream part. The climatic condition is generally humid. The average annual total rainfall ranges from1216 mm in the downstream part to over 1470 mm in the upstream part of the watershed (Figure 1). As measured at Debre-Markos (108200N, 378400E and elevation 2411 m), the mean annual temperature is 1458C and it is much less than that in the upstream part owing to the high elevation, although measured data are unavailable. The temporal distribution of the rainfall is highly uneven and this gives rise to a serious shortage of water during the dry season in some parts of the watershed (Bewket and Sterk, 2005).
Subsistence agriculture is the source of livelihood to the population in the watershed. The farming system is a typical mixed crop–livestock system of the Ethiopian highlands. Land and livestock are therefore the most important assets to the people, with which they lead a sedentary life. Livestock provide the draught power and household members the labour that is needed for the farming operation. A variety of crops are produced by a household because of the strong orientation towards self-sufficiency. Barley (Hordeum vulgare), wheat (Triticum vulgare), oats (Avena sativa), horse beans (Vicia faba), potato (Solanum tuberosum) and onion (Allium cepa) are grown in the upstream part of the watershed; andtef(Eragrostis tef) is additionally cultivated in the downstream part. Crop production is the major source of income to the households. Incomes from off-farm employment, where the definition of off-farm employment included all activities outside of one’s own farm: working on another farmer’s farm, petty trading, weaving, carpentry, smithing and pottery are scanty (Bewket and Stroosnijder, 2004). There are two fundamental reasons for selection of the Chemoga watershed as the site for this study. First, it is typical of the northwestern highlands of the country in terms of the various environmental attributes such as topography, soils, climate and the socioeconomic environment. Second, the watershed is part of the highlands that are known to be surplus producing regions, but presently threatened by resource degradation and impending food
insecurity (Zeleke, 2000). Moreover, the Chemoga watershed is part of the Blue Nile basin, where soil erosion is a major problem with trans-boundary consequences. The trans-boundary environmental analysis for the Nile River basin undertaken under the auspices of the Nile Basin Initiative (NBI, 2001) has shown that the major environmental problem in the Ethiopian portion of the basin is watershed degradation due to soil erosion by water. Besides the on-site implications on local food security and sustainability of rural livelihoods, soil erosion has several off-site and downstream consequences. NBI (2001) stressed that watershed degradation from the Ethiopian highlands was a major contributor to the problems of flooding and reservoir siltation in the Sudan and Egypt. In other words, soil and water conservation and watershed management in this part of the basin will have positive downstream impacts, thus promoting cooperation among the Nile riparian states. Hurniet al. (2005) have shown empirically that watershed management in the Ethiopian highlands has potential benefits to downstream countries of the Sudan and Egypt in terms of both reduced sediment loads and regulated and more even water flows.
DETERMINING USLE FACTOR VALUES
The USLE estimates average soil loss for a given site as a product of six major factors (Equation 1), whose values can be expressed numerically. The equation was originally not intended to be used for a large area; however, satisfactory results were reported by various studies that used it on a large scale such as for watersheds (Mellerowiczet al., 1994; Matiet al., 2000). Also, it has often been used with some adjustments made in the estimation of the factors of erosion so as to obtain location-specific results. It was here used in a GIS environment to estimate average annual soil loss and the spatial distribution of erosion hazard in the watershed studied. The USLE is given as
A¼RKLSCP (1) Figure 1. Mean annual rainfall (a) and rainfall erosivity (b) distribution in the Chemoga watershed. This figure is available in colour online at
www.interscience.wiley.com/journal/ldr
whereAis the annual soil loss (t ha1y1),Ris the rainfall erosivity factor,Kis the soil erodibility factor,Lis the slope length factor,S is the slope steepness factor,Cis the crop management or land cover factor andPis the erosion control practice factor.
Rainfall Erosivity (R) Factor
Monthly rainfall records from three meteorological stations (Aneded, Debre-Markos and Rob-Gebeya) covering the period 1993–2007 were used to calculate the erosivity index. In the original equation of USLE, the value forR
measures the kinetic energy of the rain and it requires measurements of rainfall intensity with autographic recorders; however, intensity data are not commonly available. Different empirical equations have been developed that estimateRvalues from rainfall totals, which is easily available. In the study area, there is no intensity data. Hence, an empirical equation developed by Hurni (1985a) that estimatesRfactor value from annual total rainfall was used. It is given as
R¼ 812þ0562P (2) whereRis the rainfall erosivity factor, andPis the mean annual rainfall (mm). Similar methods of determiningR
factor values from rainfall totals have been used in previous studies from different countries (Morgan, 2005). Figure 1 shows the three rainfall stations, areal mean annual rainfall and distribution of rainfall erosivity in the study watershed.
Soil Erodibility (K) Factor
Soil map of the watershed was extracted from the master plan of the Blue Nile river basin (scale 1:250 000), which was obtained from the Ministry of Water Resources, and it was used to determine the K factor values. Soil erodibility depends on the physical and biochemical properties of soils and ranges from 0 to 1. Hence, determination ofKfactor values requires data on these parameters. To overcome unavailability of such data, Helden (1987) suggestedKfactor values for use in Ethiopia based on soil colour, which is believed to be a reflection of soil properties. Four different colours are recognized: black, brown, red and yellow, and their correspondingKfactor values are 015, 02, 025 and 03, in order of sequence. A similar method of determiningKfactor values from colour of soils has also been suggested by the Soil Conservation Research Project (SCRP, 1996). Soil erodibility map of the watershed is shown in Figure 2.
Topographic (L and S) Factors
The L andS factors were generated from a digital topographic database that was created by digitizing three toposheets (1037-D1, 1037-D2 and 1037-B4), obtained from the Ethiopian Mapping Agency, covering the watershed at 1:50 000 scale and contour interval of 20 m, from which the watershed boundary and the drainage system were also derived. From the elevation information, slope and digital elevation model (DEM) with 30 m output cell size were prepared using grid-based GIS analysis. The resulting DEM was used to determine the slope length (L) and slope steepness (S) factors as follows:
L¼ l 2213
m
(3)
S¼ ð0065þ0045xþ00065x2Þ (4) wherelis the projected horizontal distance in metres between the onset of runoff and the point where runoff enters a channel larger than a rill or deposition occurs,mis an exponent that depends on slope steepness, being 05 for slopes exceeding 5 per cent, 04 for slopes 3–5 per cent and 03 for slopes 1–3 per cent, and 02 for slopes<10 per cent, and xis the slope in per cent.
In GIS-based application of USLE and its revised version RUSLE, theLandSfactors are commonly quantified together as a product of the 2, as LS factor value (Moore and Burch, 1986; Moore and Wilson, 1992). Figure 3
shows the map of the topographic factors in the study watershed, which was determined as follows:
LS¼ l
2213
m
ð0065þ0045xþ00065x2Þ (5)
Cropping and Land-Cover (C) Factor
To determine theCfactor values, a land-use and land-cover map of the watershed was prepared from a Landsat ETMþimagery acquired on 8 March 2003 (path 169/row 053). Supervised digital image classification technique was employed, complemented with field surveys that provided on-the-ground information about the types of land-use and land-cover classes. Eight land-land-use and land-cover classes were recognized, and the correspondingCfactor values were mapped (Figure 4). The identified land-use and land-cover classes were: afroalpine vegetation, forest, degraded forest, open woodland, grassland, cultivated, bareland and marshland. The C factor values for the different land-use and land-cover types as suggested in previous literature and used in the present study are shown in Table I. In the case of cultivated fields, theCfactor values vary annually. The dominant crops in the watershed remain the same, however, and these are barely, oats and wheat, with sometefgrown in the downstream part of the watershed. Hence, a value of 015 was used for all cropped areas.
Conservation Practices (P) Factor
The conservation practices factor values depend on the type of conservation measures implemented, and requires mapping of conserved areas for it to be quantified. In the study watershed, there is only a small area that has been treated withfanya juubunds through the agricultural extension programme of the government, and these are poorly maintained as implementation was carried out in a top-down approach. The traditional conservation measure Figure 2. Major soil types (a) and soil erodibility (b) in the Chemoga watershed. This figure is available in colour online at www.interscience.
wiley.com/journal/ldr
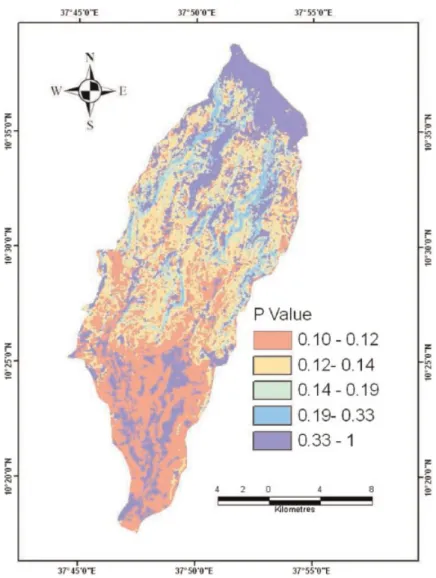
widely used is drainage ditch, locally known asfeses, which is meant to safely drain excess runoff from croplands during rainstorms. The entire watershed area is therefore not treated with improved soil and water conservation measures. Hence,Pfactor values suggested by Wischmeier and Smith (1978) that considers only two types of land uses—agricultural and other—and land slopes were used in this study (Figure 5). As shown in Table II, the agricultural lands are classified into six slope categories and assignedPfactor values, while all non-agricultural lands are assigned aP factor value of 100.
SOIL EROSION HAZARD
Soil erosion hazard was determined by multiplying the respective USLE factor values interactively in ArcGIS1 using Equation (1), resulting in the erosion hazard map shown in Figure 6. Annual soil loss ranged from 0 in the downstream part of the watershed to over 80 t ha1y1in much of the midstream and upstream parts, and to well over 125 t ha1y1in some erosion hotspot areas (Figure 7). Average annual soil loss for the entire watershed was estimated at 93 t ha1y1. The estimated soil loss rate and the spatial patterns are generally realistic, compared to what can be observed in the field as well as results from previous studies. Based on field assessment of rill and inter-rill erosion, Bewket and Sterk (2003) estimated annual soil loss to range from 18 to 79 t ha1y1in parts of the same watershed. In 5 years of monitoring in a nearby experimental micro-watershed (the Anjeni) located40 km to the northwest, soil erosion from cultivated fields under the traditional land-use practices ranged from 17 to 176 t ha1y1(Herweg and Ludi, 1999). According to Herweg and Stillhardt (1999), soil erosion rates as high as 130–170 t ha1y1are not uncommon in cultivated fields in the Anjeni catchment, which has similar physical environmental and land-use conditions. FAO (1986) estimated average soil loss from croplands in the highlands as a Figure 3. DEM (a) and topographic (LS) factors (b) in the Chemoga watershed. This figure is available in colour online at www.interscience.
whole at 100 t ha1y1. Accounting for re-deposition of mobilized sediment, Hurni (1993) estimated mean soil loss from cultivated fields at 42 t ha1y1.
Based on the estimated annual soil loss rates, the watershed was classified into six erosion severity classes (Table III). Accordingly, most of the area of the watershed (>58 per cent) was predicted to suffer from a severe or very severe erosion risk, which is in excess of 80 t ha1y1. In about 25 per cent of the watershed, soil erosion was estimated to exceed 125 t ha1y1. Severe or very severe erosion was found in the midstream and upstream parts of the watershed where steeplands are cultivated or overgrazed. In the midstream part of the watershed, it was observed in the field that the highest erosion damage was through gullies. The actual soil loss rates in this part of the watershed can therefore be much higher than estimated here by the USLE or those measurements from experimental plots of the SCRP, as both test plots and the USLE do not measure gully erosion. On the other hand, as Figure 4. Land-use and land-cover types (a) and the cover factor (C) (b) values in the Chemoga watershed. This figure is available in colour
online at www.interscience.wiley.com/journal/ldr
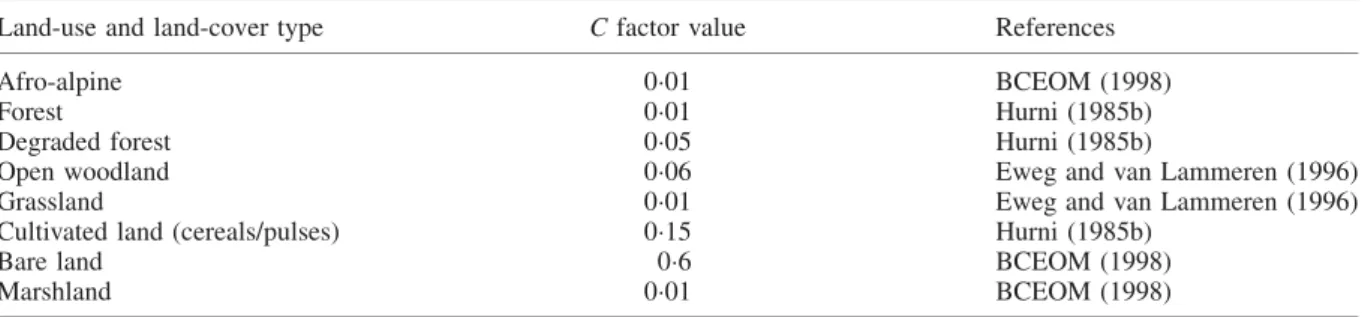
Table I. Cropping and land-cover (C) factor values used in different studies
Land-use and land-cover type Cfactor value References
Afro-alpine 001 BCEOM (1998)
Forest 001 Hurni (1985b)
Degraded forest 005 Hurni (1985b)
Open woodland 006 Eweg and van Lammeren (1996) Grassland 001 Eweg and van Lammeren (1996) Cultivated land (cereals/pulses) 015 Hurni (1985b)
Bare land 06 BCEOM (1998)
Marshland 001 BCEOM (1998)
Figure 5. Conservation practices (P) factor values in the Chemoga watershed. This figure is available in colour online at www.interscience. wiley.com/journal/ldr
Table II. ThePfactor values suggested by Wischmeier and Smith (1978)
Land-use type Slope (per cent) Pfactor
Agricultural land 0–5 01 5–10 012 10–20 014 20–30 019 30–50 025 50–100 033
gullies are localized features, rill and inter-rill erosion still remain the dominant processes in most parts of the watershed making the USLE results useful.
In the downstream part (25 per cent of total area), soil erosion was moderate or low. Indeed, a previous study has noted that a major erosion-related problem in this part of the watershed was deposition of eroded materials coming from the upstream part (Bewket, 2002). According to the same study, local people even constructed mud levees by their own initiative to contain the sediment within the stream channel, but without success. The relatively low soil loss value in the downstream part of the watershed was therefore mainly due to the low LS factor values (Figure 3). Erosion hazard was also relatively lower in the areas under natural vegetation cover, which is in agreement with plot level data that showed that annual soil loss rates in forested areas rarely exceeded 1 t ha1y1 (Hurni, 1985b).
Prioritization for Watershed Treatment
The soil erosion hazard map (Figure 6) clearly shows that nearly the entire watershed requires implementation of different types of soil and water conservation measures for a sustainable land use. Resource considerations or Figure 6. Soil erosion hazard in the Chemoga watershed. This figure is available in colour online at www.interscience.wiley.com/journal/ldr
practicability of participatory watershed development may, however, limit implementation of soil and water conservation technologies to a few priority micro-watersheds only. Even where resource constraints are limited, implementing conservation measures in only selected micro-watersheds that are hotspots of erosion can significantly reduce total sediment yield of a watershed. Studies have shown that, for many watersheds, a few Figure 7. Soil erosion hotspots and micro-watersheds for conservation planning in the Chemoga watershed. This figure is available in colour
online at www.interscience.wiley.com/journal/ldr
Table III. Annual soil erosion rates and severity classes
Soil loss (t ha1y1) Severity classes Area (ha) Per cent of total
<12 Low 43513 125 12–25 Moderate 41823 121 25–50 High 37313 108 50–80 Very high 22193 64 80–125 Severe 11 6504 336 >125 Very severe 85522 247
critical areas are responsible for a disproportionate amount of sediment yields (Matiet al., 2000; Tripathiet al., 2003). Thus, it is necessary and strategic to prioritize micro-watersheds for treatment with appropriate soil and water conservation measures. Prioritization of watersheds involves ranking of the different micro-watersheds according to the order in which they ought to be taken up for treatment with conservation technologies by considering the amount of soil loss occurring.
In this study, a total of 18 micro-watersheds were delineated based on drainage systems and coded as SW_1 to SW_18 and the erosion hazard map was reclassified for the prioritization (Figure 7). Based on the spatial distribution of the erosion hazard, 11 out of 18 micro-watersheds fell under severe or very severe soil erosion categories of the soil loss severity classes (>80 t ha1y1), of which five and six were in the very severe and severe categories, respectively. These two groups of micro-watersheds were hence assigned the first and second priorities, in order of mention, for conservation planning (Table IV). The 11 micro-watersheds in the two erosion severity classes —severe and very severe—account for about 87 per cent of the total soil loss from the watershed, but cover only about 58 per cent of the total area of the watershed. Only five of the micro-watersheds in the very severe soil loss category account for about 51 per cent of the total soil loss from the watershed while accounting for only about 25 per cent of the total area of the watershed. This is in agreement with research results elsewhere that much of the total soil loss from a watershed comes from a small proportion of watershed areas (Matiet al., 2000; Tripathiet al., 2003). Of the 18 micro-watersheds, nine were predicted to experience annual soil loss of more than the watershed’s average (93 t ha1y1), whereas in two other micro-watersheds (SW_6 and SW_18) estimated annual soil losses were close to the average (Table V).
Table IV. Prioritization of micro-watersheds Soil loss (t ha1y1) Priority classes Micro-watershed Area (ha) Per cent of total area Per cent of total soil loss
>125 I SW_8, SW_9, SW_10, SW_12, SW_14 85522 247 509 80–125 II SW_6, SW_13, SW_15, SW_16, SW_17, SW_18 11 6504 336 357 50–80 III SW_7, SW_11 22193 64 46 25–50 IV SW_4, SW_5 37313 108 47 12–25 V SW_3 41823 121 30 <12 VI SW_1, SW_2 43513 125 11
Table V. Mean annual soil loss at micro-watershed level in the Chemoga watershed
Micro-watershed Area (ha) Per cent of total Soil loss (t ha1y1) Per cent of total
SW_1 20115 58 92 06 SW_2 23398 67 73 05 SW_3 41823 121 228 29 SW_4 21174 61 366 24 SW_5 16139 46 463 23 SW_6 21559 62 923 62 SW_7 14035 40 680 29 SW_8 18713 54 1336 78 SW_9 16269 47 1259 64 SW_10 9706 28 2285 69 SW_11 8158 23 667 17 SW_12 12666 36 2215 87 SW_13 17561 51 996 54 SW_14 28168 81 2427 212 SW_15 15038 43 1028 48 SW_16 21389 62 1029 68 SW_17 17008 49 1070 56 SW_18 23949 69 915 68
The micro-watersheds SW_1, SW_2 and SW_3 that are predicted to experience low or moderate soil loss together cover about 25 per cent of the watershed area, but account for only 41 per cent of the total watershed soil loss. In prioritizing for conservation intervention, micro-watersheds SW_1 and SW_2 can be considered in the last (sixth) stage, and SW_3 can be considered in the fifth stage. The micro-watersheds SW_4 and SW_5, and SW_7 and SW_11 in the erosion severity classes of high and very high, respectively, were accorded conservation priorities of fourth and third in order of sequence.
DISCUSSION AND CONCLUSIONS
Soil erosion is a major contributor to the prevailing food insecurity in Ethiopia. Soil conservation is vital to the achievement of food security, poverty reduction and environmental sustainability in the country. The objective of this study was to assess soil erosion hazard in a typical highland watershed (the Chemoga watershed) in the Blue Nile basin and demonstrate that a simple erosion assessment model, the USLE, integrated with satellite remote sensing and geographical information systems can provide useful information for conservation decision-making. The important results of the study include soil erosion hazard map of the watershed and the prioritization of micro-watersheds into conservation priority categories, which can be used for preparation of a master plan for management of the watershed.
In selecting and implementing conservation measures for the different micro-watersheds, the concepts of soil loss tolerance and critical soil loss values can provide useful frameworks. Soil loss tolerance refers to the maximum soil loss that can occur from a given land without leading to degradation of the soil (Hurni, 1983; Morgan, 2005). For conservation planning, soil loss tolerance values can be set at rates of soil formation; unfortunately, however, it is not practically possible to determine the rate at which soil loss equals the rate of soil formation. Different values of soil loss tolerance have been proposed by different authors (Morgan, 2005), but a mean annual soil loss of 11 t ha1is generally considered acceptable while it may be as low as 2 t ha1in sensitive areas (Hudson, 1981). The other important concept is that of critical soil loss, which refers to a value from which it is no more possible to reduce soil erosion no matter what conservation measure will be used. In such cases, the available option for sustainable land use will be to change the land-use type itself; for instance, from cropland to forest.
Finally, the study demonstrates that the USLE together with satellite remote sensing and geographical information systems provide useful tools to estimate erosion hazard over watersheds and facilitate sustainable land management. It has given a fairly reliable estimation of soil loss and delineation of erosion-prone areas. But it is important to note that the estimated soil loss rates are not precise because of the well-known limitations of the model (cf. Morgan, 2005). For instance, the basic equation implies that each factor is derived independently, while in reality, there is obvious interdependence between the variables. The practical problems in estimating USLE factor values in the eastern and western African contexts have been discussed by Mati and Veihe (2001). Morgan (2005) notes that USLE was developed as ‘a tool to guide soil conservation planning, and not for use as a research technique’. In this sense, the results of this study and the method used are quite useful given the fact that measured data are unavailable, and physically based distributed models are difficult to apply due to lack of input data, which is the case in many developing countries. On the other hand, obtaining the same information by field surveys would take a long time and considerable human resources. The method can thus be applied in other watersheds for assessment and delineation of erosion-prone areas for prioritization of micro-watersheds for conservation intervention and enable efficient use of limited resources.
acknowledgements
This study was made possible by a research grant awarded to the first author by the International Foundation for Science (IFS). We would also like to express our gratitude to the two anonymous reviewers for their valuable comments and suggestions.
references
Amsalu A, de Graaff J. 2007. Determinants of adoption and continued use of stone terraces for soil and water conservation in an Ethiopian highland watershed.Ecological Economics61: 294–302.
Amsalu A, Stroosnijder L, de Graaf J. 2007. Long-term dynamics in land resource use and the driving forces in the Beressa watershed, highlands of Ethiopia.Journal of Environmental Management83: 448–459.
Anley Y, Bogale A, Haile-Gabriel A. 2007. Adoption decision and use intensity of soil and water conservation measures by smallholder subsistence farmers in Dedo district, western Ethiopia.Land Degradation & Development18: 289–302.
BCEOM. 1998.Abbay River Basin Integrated Development Master Plan, Main Report. Ministry of Water Resources: Addis Ababa. Bekele W, Drake L. 2003. Soil and water conservation decision behaviour of subsistence farmers in the eastern highlands of Ethiopia: A case
study of the Hunde-Lafto area.Ecological Economics46: 437–451.
Bewket W. 2002. Land cover dynamic since the 1950s in Chemoga watershed, Blue Nile basin, Ethiopia.Mountain Research and Development 22: 263–269.
Bewket W. 2007. Soil and water conservation intervention with conventional technologies in northwestern highlands of Ethiopia: Acceptance and adoption by farmers.Land Use Policy24: 404–416.
Bewket W, Sterk G. 2003. Assessment of soil erosion in cultivated fields using a survey methodology for rills in the Chemoga watershed, Ethiopia.Agriculture, Ecosystems and Environment97: 81–93.
Bewket W, Sterk G. 2005. Dynamics in land cover and its effect on stream flow in the Chemoga watershed, Blue Nile basin, Ethiopia.
Hydrological Process19: 445–458.
Bewket W, Stroosnijder L. 2004. Resource scarcity and degradation and farm household circumstances in the northwestern highlands of Ethiopia: A case study in the Chemoga watershed.Ethiopian Journal of the Social Sciences and HumanitiesII: 69–96.
Erenstein OCA. 1999.The Economics of Soil Conservation in Developing Countries: The Case of Crop Residue Mulching. Wageningen University: Wageningen.
Eweg HPA, van Lammeren R. 1996.The application of geographic information system at the rehabilitation of degraded and degrading areas of Tigray, Ethiopia. Research Report, Wageningen Agricultural University, Wageningen.
FAO. 1986.Ethiopian highlands reclamation study, Ethiopia. Final Report, FAO, Rome.
Helden U. 1987.An assessment of woody biomass, community forests, land use and soil erosion in Ethiopia. Research Report, Lund University Press, Lund.
Herweg K, Ludi E. 1999. The performance of selected soil and water conservation measures—Case studies from Ethiopia and Eritrea.Catena 36: 99–114.
Herweg K, Stillhardt B. 1999.The variability of soil erosion in the highlands of Ethiopia and Eritrea. Average and extreme erosion patterns.
Research Report 33, University of Berne, Berne. Hudson NW. 1981.Soil Conservation. Batsford: London.
Hurni H. 1983. Soil erosion and soil formation in agricultural ecosystems: Ethiopia and Northern Thailand. Mountain Research and Development3: 131–142.
Hurni H. 1985a.Soil Conservation Manual for Ethiopia. Ministry of Agriculture: Addis Ababa.
Hurni H. 1985b. Erosion–productivity–conservation systems in Ethiopia. Paper Presented at the 4th International Conference on Soil Conservation, 3–9 November 1985, Maracacy, Venezuela.
Hurni H. 1993. Land degradation, famine, and land resource scenarios in Ethiopia. InWorld Soil Erosion and Conservation, Pimentel D (ed.). Cambridge University Press: Cambridge; 27–62.
Hurni H, Tato K, Zeleke G. 2005. The implications of changes in population, land use and land management for surface runoff in the upper Nile basin area of Ethiopia.Mountain Research and Development25: 147–154.
Lal R. 2001. Soil degradation by erosion.Land Degradation & Development12: 519–539.
Mati BM, Veihe A. 2001. Application of the USLE in a savannah environment: Comparative evidences from east and west Africa.Singapore Journal of Tropical Geography22: 138–155.
Mati BM, Morgan RPC, Gichuki FN, Quinton JN, Brewer TR, Liniger HP. 2000. Assessment of erosion hazard with the USLE and GIS: A case study of the Upper Ewaso Ng’iro North basin of Kenya.International Journal of Applied Earth Observation and Geoinformation2: 1–9. Mellerowicz KT, Ress HW, Chow TL, Ghanem I. 1994. Soil conservation planning at the watershed level using the Universal Soil Loss Equation
with GIS and microcomputer technologies: A case study.Journal of Soil and Water Conservation49: 194–200.
Ministry of Agriculture and Rural Development (MoARD) and World Bank. 2007.Ethiopia: Thematic Papers on Land Degradation in Ethiopia. MoARD and World Bank Publication: Addis Ababa.
Moore ID, Burch G. 1986. Physical basis of the length-slope factor in the universal soil loss equation.Soil Science Society of America Journal50: 1294–1298.
Moore ID, Wilson JP. 1992. Length-slope factors for the revised universal soil loss equation: Simplified method of estimation.Journal of Soil and Water Conservation47: 423–428.
Morgan RPC. 2005.Soil Erosion and Conservation(3rd edn). Blackwell Science: Oxford.
Nile Basin Initiative (NBI). 2001.Nile River Basin Transboundary Environmental Analysis. NBI: Entebbe.
Pimentel D, Allen J, Beers A, Guinand L, Hawkins A, Linder R, Mclaughlin P, Meer B, Musonda D, Perdue D, Poisson S, Salazar R, Siebert S, Stoner K. 1993. Soil erosion and agricultural productivity. InWorld Soil Erosion and Conservation, Pimentel D (ed.). Cambridge University Press: Cambridge; 277–292.
Pimentel D, Harvey C, Resosudarmo P, Sinclair K, Kurz D, McNair M, Crist S, Shpritz L, Fitton L, Saffouri R, Blair R. 1995. Environmental and economic costs of soil erosion and conservation benefits.Science267: 1117–1123.
Renard K, Foster GR, Wessies GA, Porter JP. 1994. RUSLE—Revised universal soil loss equation.Journal of Soil and Water Conservation46: 30–33.
Soil Conservation Research Project (SCRP). 1996.Soil erosion hazard assessment for land evaluation. Research Report, SCRP, Addis Ababa.
Shiferaw B, Holden S. 1999. Soil erosion and smallholders’ conservation decisions in the highlands of Ethiopia.World Development27: 739– 752.
Sonneveld BGJS. 2002.Land Under Pressure: The Impact of Water Erosion on Food Production in Ethiopia. Shaker Publishing: Maastricht. Sutcliffe JP. 1993.Economic Assessment of Land Degradation in the Ethiopian Highlands: A Case Study. Ministry of Planning and Economic
Development: Addis Ababa.
Tekele K, Hedlund L. 2000. Land cover changes between 1958 and 1986 in Kalu district, southern Wello, Ethiopian.Mountain Research and Development20: 42–51.
Tripathi MP, Panda RK, Raghuwanshi NS. 2003. Identification and prioritization of critical sub-watersheds for soil conservation management using the SWAT model.Biosystems Engineering85: 365–379.
Wischmeier WH, Smith DD. 1978. Predicting Rainfall Erosion Loss. USDA Agricultural Research Service Handbook 537.
Zeleke G. 2000.Landscape Dynamics and Soil Erosion Process Modeling in the North-Western Ethiopian Highlands. African Studies Series A16. Geographica Bernensia: Berne.