FACILITATING ALGORITHM VISUALIZATION
CREATION AND ADOPTION IN EDUCATION
Doctoral Dissertation
Ville Karavirta
Dissertation for the degree of Doctor of Science in Technology to be presented with due permission of the Faculty of Information and Natural Sciences for public examination and debate in Auditorium AS1 at Helsinki University of Technology (Espoo, Finland) on 14th
of December, 2009, at 12 noon.
Helsinki University of Technology
Faculty of Information and Natural Sciences Department of Computer Science and Engineering Teknillinen korkeakoulu
Informaatio- ja luonnontieteiden tiedekunta Tietotekniikan laitos
Faculty of Information and Natural Sciences Department of Computer Science and Engineering P.O.Box 5400 FI-02015 TKK FINLAND URL: http://www.cse.hut.fi/ Tel: +358-9-470 23228 Fax: +358-9-470 23293 E-mail: [email protected] © Ville Karavirta
Cover photo©iStockphoto.com/Viorika ISBN 978–952–248–169–6 ISBN 978–952–248–170–2 (PDF) ISSN 1797–6928 ISSN 1797–6936 (PDF) URL: http://lib.tkk.fi/Diss/isbn9789522481702/ Multiprint Oy Espoo 2009
AB
ABSTRACT OF DOCTORAL DISSERTATION HELSINKI UNIVERSITY OF TECHNOLOGYP. O. BOX 1000, FI-02015 TKK http://www.tkk.fi
Author Ville Karavirta Name of the dissertation
Manuscript submitted 29.5.2009 Manuscript revised 6.11.2009
Date of the defence 14.12.2009
Article dissertation (summary + original articles) Monograph Faculty Department Field of research Opponent(s) Supervisor Instructor Abstract
Keywords algorithm animation, effortlessness, algorithm animation language, XAAL ISBN (printed) 978–952–248–169–6
ISBN (pdf) 978–952–248–170–2 Language English
ISSN (printed) 1797–6928
ISSN (pdf) 1797–6936
Number of pages 120 + app. 100 Publisher Department of Computer Science and Engineering
Print distribution Department of Computer Science and Engineering The dissertation can be read at http://lib.tkk.fi/Diss/isbn9789522481702/ Facilitating Algorithm Visualization Creation and Adoption in Education
X Faculty of Information and Natural Sciences Department of Computer Science and Engineering Software Systems
Professor Susan Rodger Professor Lauri Malmi Docent Ari Korhonen
X
The research question of this thesis is:How can we develop algorithm animations (AA) and AA systems further to better facilitate the creation and adoption of AA in education?
The motivation for tackling this issue is that algorithm animation has not been widely used in teaching computer science. One of the main reasons for not taking full advantage of AA in teaching is the lack of time on behalf of the instructors. Furthermore, there is a shortage of ready-made, good quality algorithm visualizations.
The main contributions are as follows:
• Effortless Creation of Algorithm Animation. We define a Taxonomy of Effortless Creation of Algorithm Animations. In addition, we introduce a new approach for teachers to create animations by allowing effortless on-the-fly creation of algorithm animations by applying visual algorithm simulation through a simple user interface.
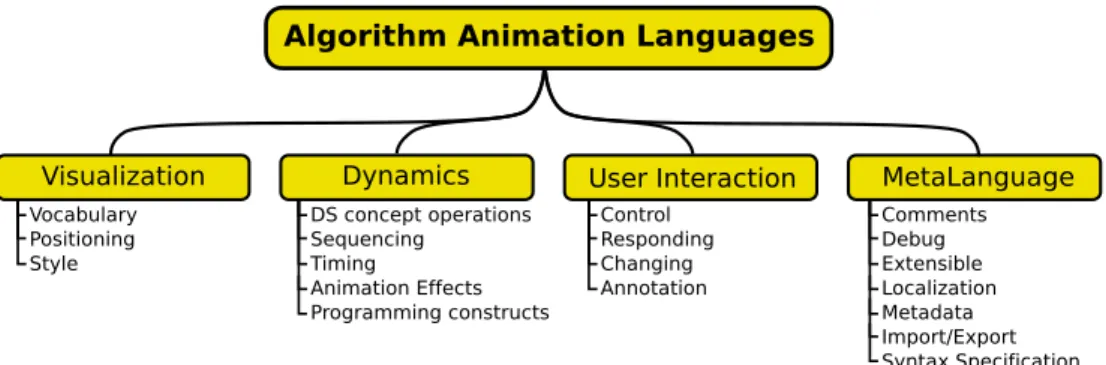
• Proposed Standard for Algorithm Animation language. We define a Taxonomy of Algorithm Animation Languages to help comparing the different AA languages. The taxonomy and work by an international working group is used to define a new algorithm animation language, eXtensible Algorithm Animation Language, XAAL.
• Applications of XAALin education. We provide two different processing approaches for using and producing XAALanimations with existing algorithm animation systems. In addition, we have a framework aiding in this integration as well as prototype implementations of the processes. Furthermore, we provide a novel solution to the problem of seamlessly integrating algorithm animations with hypertext. In our approach, the algorithm animation viewer is implemented purely with JavaScript and HTML. Finally, we introduce a processing model to easily produce lecture slides for a common presentation tool of XAALanimations.
AB
VÄITÖSKIRJAN TIIVISTELMÄ TEKNILLINEN KORKEAKOULU
PL 1000, 02015 TKK http://www.tkk.fi Tekijä Ville Karavirta
Väitöskirjan nimi
Käsikirjoituksen päivämäärä 29.5.2009 Korjatun käsikirjoituksen päivämäärä 6.11.2009 Väitöstilaisuuden ajankohta 14.12.2009
Yhdistelmäväitöskirja (yhteenveto + erillisartikkelit) Monografia Tiedekunta Laitos Tutkimusala Vastaväittäjä(t) Työn valvoja Työn ohjaaja Tiivistelmä
Asiasanat algoritmianimaatio, vaivattomuus, algoritmianimaatiokieli, XAAL ISBN (painettu) 978–952–248–169–6 ISBN (pdf) 978–952–248–170–2 Kieli Englanti ISSN (painettu) 1797–6928 ISSN (pdf) 1797–6936 Sivumäärä 120 + liit. 100 Julkaisija Tietotekniikan laitos
Painetun väitöskirjan jakelu Tietotekniikan laitos
Luettavissa verkossa osoitteessa http://lib.tkk.fi/Diss/isbn9789522481702/ Algoritmivisualisaatioiden luomisen ja käyttöönoton helpottaminen opetuksessa
X Informaatio- ja luonnontieteiden tiedekunta Tietotekniikan laitos
Ohjelmistojärjestelmät Professori Susan Rodger Professori Lauri Malmi Dosentti Ari Korhonen
X
Tämän työn tutkimuksen lähtökohtana oli tutkimuskysymys:Miten algoritmivisualisaatioiden luomista ja
käyttöönottoa opetuksessa voidaan helpottaa visualisaatioita ja niiden tuottamiseen käytettyjä välineitä kehittämällä?
Motivaationa tutkimukseen on, että algoritmianimaatio ei ole saavuttanut suurta suosiota opettajien keskuudessa. Pääsyy tähän on, että opettajilla ei ole tarpeeksi aikaa animaatioiden luomiseen. Lisäksi valmiista, korkealaatuisista animaatioista on pulaa.
Työn keskeiset tulokset ovat seuraavat:
• Algoritmianimaatioiden vaivaton luonti. Ensin työssä tutkitaan miten animaatioiden tekemisestä saataisiin
vähemmän vaivalloista. Tähän kysymykseen etsitään ratkaisua määrittämällä tapa mitata
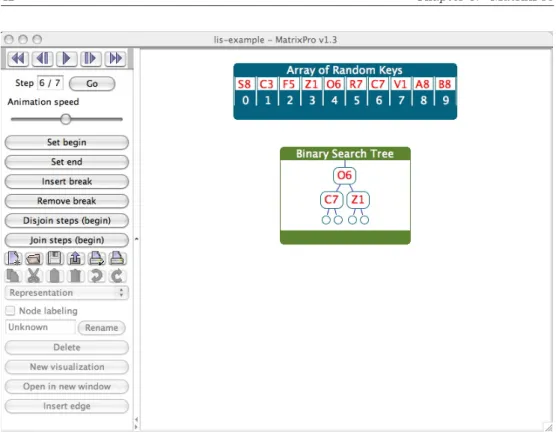
animaatiojärjestelmien vaivattomuutta. Lisäksi esitellään järjestelmä, MatrixPro, joka on vaivaton luentotyökalu opettajille.
• Ehdotus standardiksi algoritmianimaatiokieleksi. Työkaluksi järjestelmien yhteisen
algoritmianimaatiokielen kehittämiseen määrittelemme taksonomian algoritmianimaatiokielten arvioimiseen. Tätä taksonomiaa käytetään hyödyksi määriteltäessä laajennettava algoritmianimaatiokieli (XAAL, eXtensible Algorithm Animation Language). Kielen määrittelyssä käytetään hyväksi myös kansainvälisen työryhmän visiota yhteisestä algoritmianimaatiokielestä.
• XAAL-kielen käyttö opetuksessa. Työssä esittelemme toteutuksen joukolle työkaluja, joka mahdollistaa
XAAL-animaatioiden käytön ja luomisen algoritmianimaatiojärjestelmillä. Lisäksi esittelemme uuden tavan liittää animaatioita hyperdokumentteihin. Lopuksi esittelemme mallin tuottaa helposti luentokalvoja yleiselle esitystyökalulle XAAL-animaatioista.
“
A book like this is largely the work of one person. There’s no other single human beingwho’s spent as much time as I have thinking about it, persevating over it, changing the same sentence back and forth between two different versions over and over.”
– Steve Krug, Don’t make me think! While the above quote from Steve Krug is spot on, there are a number of people without who this thesis would never have been done. First and foremost I would like to thank my supervisor Professor Lauri Malmi and instructor Docent Ari Korhonen for providing the facilities to do this work. Their input and feedback to the work during this process has been highly valuable. Ari was also the one who hired me as a research assistant back in 2002. This work has been done in the Software Visualization Group and Computer Science Education Research Group and I would like to thank all former, current, and future colleagues.
I am also grateful to the participants of the ITiCSE XML Working Group for the discussions and ideas during the intensive five-day spell in Portugal. I would especially want to thank Tom Naps and Guido R¨oßling for giving me the chance to be part of the group. Tom also read and gave insightful comments on an early draft.
Furthermore, I wish to thank my friends and family for the tremendous support over the years. My greatest gratitude goes to Linda for being special. Finally, I would like to thank the pre-examiners Professor Scott Grissom and Professor Pierluigi Crescenzi for their comments to improve this work. And it is an honor to have Professor Susan Rodger as my opponent.
Otaniemi, 6.11.2009
Ville Karavirta
contributions of the author
This thesis consists of an introduction and the following publications [P1] - [P7] [P1] Petri Ihantola, Ville Karavirta, Ari Korhonen, and Jussi Nikander. Tax-onomy of effortless creation of algorithm visualizations. In Proceedings of the 2005 International workshop on Computing Education Research (ICER), pages 123–133, New York, NY, USA, 2005.
This paper introduces a taxonomy of effortless creation of algorithm visu-alizations and evaluates some of the existing AV systems. All the authors of the paper contributed evenly on all parts of the paper.
[P2] Ville Karavirta, Ari Korhonen, Lauri Malmi, and Kimmo St˚alnacke. MatrixPro - A tool for on-the-fly demonstration of data structures and algo-rithms. In Proceedings of the Third Program Visualization Workshop (PVW), pages 26–33, The University of Warwick, UK, 2004.
In this paper, an algorithm animation system called MatrixPro is intro-duced. The system supports on-the-fly creation of animations using visual algorithm simulation. The work presented in this paper included significant constructive part. The author of this thesis implemented the system based on the Matrix algorithm simulation framework. The authors of the paper contributed evenly in writing of the paper, while the main contribution of Karavirta was in the section describing the system.
[P3] Ville Karavirta, Ari Korhonen, Lauri Malmi, and Thomas Naps. A Comprehensive Taxonomy of Algorithm Animation Languages. Journal of Visual Languages and Computing (accepted).
This paper introduces a taxonomy of algorithm animation languages. In addition, there is an evaluation of several existing AA languages.
A first version of the taxonomy was presented in the Master’s thesis of the author of this thesis. Karavirta, Korhonen, and Malmi published a pol-ished version of the taxonomy in a conference paper. Finally, this paper was extended significantly to the current version by all the authors.
ford J. Ross, and Jaime Urquiza-Fuentes. Development of XML-based tools to support user interaction with algorithm visualization. SIGCSE Bulletin, 37(4):123–138, 2005.
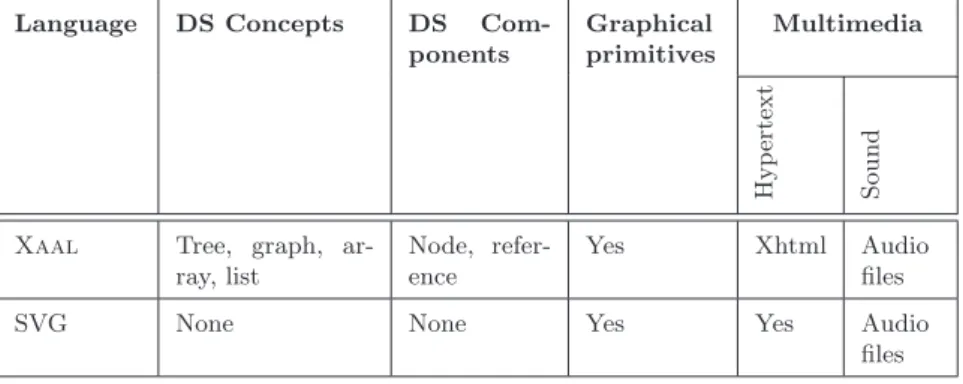
This paper discusses requirements for a common algorithm animation lan-guage to be used by multiple AA systems. It gives examples and specifications for the different elements of AA. The author’s main contributions were in the specification of the graphical primitives and transformations on them, as well as the parts of the paper discussing them.
[P5] Ville Karavirta. Integrating algorithm visualization systems. In Pro-ceedings of the Fourth Program Visualization Workshop (PVW), volume 178 of Electronic Notes in Theoretical Computer Science, pages 79–87, 2007.
This paper describes a new algorithm animation language called Extensible Algorithm Animation Language, Xaal. In addition, the paper shows how Xaal can be used to transfer algorithm animations between AA systems. The work presented in this paper included significant constructive part. The author of this thesis is the sole author of this work.
[P6] Ville Karavirta. Seamless merging of hypertext and algorithm anima-tion. ACM Transactions on Computing Education, 9(2):1–17, 2009.
This paper presents an algorithm animation viewer implemented purely using HTML and JavaScript making this solution suitable to be used in hy-pertext learning material due to the advanced interaction possibilities between learning material (HTML) and the animation. The work presented in this pa-per included significant constructive part. The author of this thesis is the sole author of this work.
[P7] Ville Karavirta, Guido R¨oßling, and Otto Sepp¨al¨a. Automatic gener-ation of algorithm animgener-ations for lecture slides. TKK Technical Reports in Computer Science and Engineering, B, TKK-CSE-B7, 2009.
In this paper, we present a process to easily generate algorithm animations in lecture slide format with an existing AV system. The work presented in this paper included significant constructive part.
Karavirta and Sepp¨al¨a presented the initial idea of automatic lecture slide generation in a previous paper where both of the authors contributed equally. For this version, the author of this thesis implemented theXaallanguage to
Animal with the help of R¨oßling, as well as the Xaal to Open Document
Format transformation. The writing of the paper was done collaboratively among the authors.
I Introduction and Background 1
1 Introduction 3
1.1 The Problem and Research Questions . . . 4
1.2 Main Contributions and Structure of this Thesis . . . 7
2 Software Visualization 9 2.1 Information Visualization . . . 9
2.2 Software Visualization and Algorithm Animation . . . 11
2.2.1 Roles in Software Visualization . . . 12
2.2.2 Algorithm Animation Language . . . 14
2.3 Taxonomies of Software Visualization Systems . . . 14
3 Algorithm Animation 17 3.1 History of Algorithm Animation . . . 17
3.2 Research Questions in Algorithm Animation . . . 18
3.2.1 Scope: What Platform Should be used? . . . 19
3.2.2 Content: What is visualized? . . . 21
3.2.3 Form: How to integrate the use of animations to teaching? 22 3.2.4 Method: How the animation is generated? . . . 23
3.2.5 Interaction: How to make animations interactive? . . . . 26
3.2.6 Effectiveness: Are Algorithm Animations Effective? . . . 28
3.3 Visualizations and Teachers . . . 32
II Effortless Algorithm Animation 35 4 Taxonomy of Effortless Creation of Algorithm Visualizations 37 5 MatrixPro 41 III Algorithm Animation Languages 45 6 Features of Algorithm Animation Languages 47 6.1 Representation Format . . . 48
6.2 Level of Abstraction . . . 48
6.3 Animation . . . 49
7 Taxonomy of Algorithm Animation Languages 53 8 Proposal for Standard Algorithm Animation Language 57
8.1 ITiCSE XML Working Group . . . 57
8.2 Xaal . . . 60
8.2.1 Taxonomic Evaluation . . . 62
IV Applications of Xaal in Education 69 9 Xaal in Algorithm Animation Systems 71 9.1 Implementation Approaches . . . 71
9.2 UsingXaalAnimations . . . . 73
9.3 Producing Xaal Animations . . . 75
9.4 Implementation-based Evaluation . . . 76
10 Algorithm Animations as Online Learning Material 79 10.1 Main Features . . . 80
10.2 Underlying Technologies . . . 82
11 Algorithm Animations as Lecture Material 85 11.1 First Prototype . . . 85
11.2 The Process of Generating Slides . . . 86
V Discussion and Conclusions 89 12 Discussion 91 12.1 Research Questions Revisited . . . 91
12.1.1 Effortless creation of AV . . . 91
12.1.2 System independent description of AVI . . . 92
12.1.3 Processes to use the AVI in AA systems . . . 92
12.1.4 Processing the AVI for different learning situations. . . . 94
12.2 Critical Overview . . . 95
13 Conclusions 99 13.1 Benefits of This Work . . . 99
13.2 Future Work . . . 100
Introduction and Background
Introduction
Due to the rapidly increased performance of computerized devices, software products have grown to be more and more complex. As a result, software developers need to understand very large parts of the software. At the same time, people are constantly required to be more efficient at whatever they do. To help software developers achieve this, variousSoftware Visualization (SV) tools have been developed. Software Visualization can be defined as“the visualization of artifacts related to software and its development process” [32]. Many different areas of software engineering can apply and benefit from Software Visualization. Software developers can get insights on the class or package structures of an object-oriented software. UML diagrams are a good example of an often used visualization [99]. SV tools can also provide detailed information of the state of the program through visual debuggers. In addition, developers can test their software usingvisual testing[78]. On the other hand, algorithm developers and researchers can get a better view of the behaviour of algorithms through visualizations. In education, students can use visualiza-tions to help them understand and learn new concepts in software development and algorithmics. Project managers can get an overview of the progress of a software project from visualizations of the software evolution.
In general, SV can be divided into visualizing thestructure,behaviour, and evolutionof software. Structure is the visualization of static parts and relations of the system. Behaviour is the visualization of the program execution with real or abstract data. Finally, evolution is the visualization of the development process of the software. [32]
Algorithm animation(AA)1is one form of visualization of behaviour where
the goal is to visualize the execution of an algorithm [32]. The main purpose of algorithm animation development is aimed toward use in educational context. This is also the focus in this thesis, although the ideas can be applied to different areas of SV, as well.
1.1
The Problem and Research Questions
Algorithm animation has been used in education for a few decades with the goal of helping students to learn the difficult concepts of data structures and algorithms. In a survey by Naps et al. [95], most of the 93 respondents stated that they believe visualizations to help students learn computing concepts. Only five indicated neutral or no opinion whilenone disagreed with the helpful effect of visualizations.
Recent studies indicate that to beeducationally effective (i.e. aid students’ learning) algorithm visualizations cannot be merely passive animations, the users must interact with the animation [50, 95]. This discovery has led to the development of a wide variety of interactive visualization tools.
The confidence of teachers and the demonstrated learning benefits of ani-mations have not helped AV to reach a wide audience. To the disappointment of the AV system developers, most of the AV tools have been used only in the institutions they were developed in. According to the survey by Naps et al. [95], the key reasons for not adopting AV are the following.
• Teachers do not have time to search for good examples. • Teachers do not have time to learn the new tools. • Teachers do not have time to develop visualizations. • Teachers feel there is a lack of effective development tools.
Furthermore, there is a shortage of ready-made, good quality algorithm visu-alizations usable in teaching [125].
As the hope of the AV developer community is to get visualizations more widely into use among educators, the main research question we will tackle in this work is:
1Another term widely used is Algorithm Visualization (AV). Some see this as a wider topic, but in this
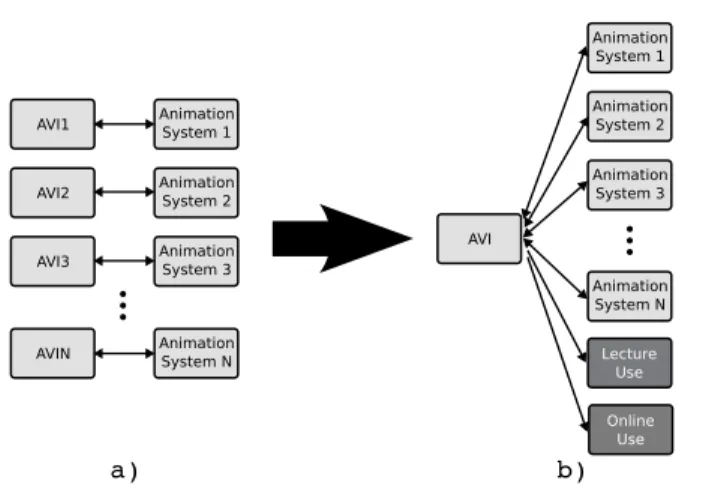
Figure 1.1: a)The current situation of AV systems where every system has its own format for describing the algorithm visualization information (AVI).b)The wanted situation where every system is using the same AVI format.
How can we develop algorithm animations and AA systems fur-ther to better facilitate the creation and adoption of AA in education? As the main problems with disseminating the use of visualizations we see the large number of separate visualization applications and the lack of reuse of existing visualization. This is also partly the reason for the current shortage of good quality ready-made visualizations. The visualization applications provide different approaches to creating animations. In addition, for students using these animations, the systems provide different interaction methods. Each of these systems has its own internal format for storing the animations and the same visualization cannot be used in many systems (see Figure 1.1a). The reuse of created resources between applications is a natural requirement in many environments. For example, sharing presentation slides is common. A situation where all the presentation tools would only read/write their own format would make everyday usage more difficult. Thus, we will approach the research question by examining the description and usage of algorithm visualization information (AVI), that is, the information needed to visualize an algorithm. This takes four forms and divides the research to aim at answering four questions:
• What is effortless creation of AVI? As one of the main reasons for not using visualizations is the lack of effective tools, we will explore what
makes an algorithm animation system effortless. With this information, novel approaches to AV production can be introduced. The aim is, that although creating good examples will remain difficult, it should be difficult because of pedagogical considerations instead of the limitations of the available tools.
We will start by exploring what makes an algorithm animation system ef-fortless and introduce a taxonomy of effortless creation of AV (Formulative-taxonomy, FT2). This was carried out by thoroughly analyzing responses
on a survey to users of AV systems. We will also introduce a new approach for teachers to create algorithm visualization using visual algorithm sim-ulation, thus allowing effortless use in a limited application area (Descrip-tive system, DS and Concept implementation, CI).
• How to specify a system independent description of AVI? The introduction of a system independent format to describe AVI would allow all the AV systems to use the same visualizations (see Figure 1.1b). In the second part of this work, we will analyze the languages used by the existing AV systems to store the visualizations and aim at identifying the key features of algorithm animation languages (Review of literature, DR). We summarize the results of the analysis by introducing a taxonomy of algorithm animation languages (FT). This taxonomy together with the work of an international working group is used to specify a proposal for a standard algorithm animation language, Xaal (eXtensible Algorithm Animation Language) (Formative-standards, FG). Furthermore, we use the newly defined taxonomy to evaluate theXaallanguage (Evaluative-other, EO).
• How can we process the AVI to use in AA systems? A survey by Bassil and Keller concluded that integration of SV tools and import-ing/exporting visualizations from SV tools are the main challenges for the future of SV tool builders [6]. Understandably, merely having a stan-dard language for AVI is not enough. Thus, we need to provide processes that enable importing/exporting visualizations. Evidently, all the created visualizations would then be available for all the AV systems.
2For each part of this work, we will refer to the applied research approaches and methods in software
For the proposed standard to be useful, we will introduce two different processes on how to add Xaal import/export to existing AV systems (Formulative-process, FP). In addition, we introduce a framework that implementing this in AV systems (Formulative-framework, FF).
• How can we process the AVI for different learning situations? According to R¨oßling et al., merging visualizations into hypertext is an important step in allowing online learning and promoting the use of AV [119]. Our aim is to make this merging as seamless as possible for the students. Another learning situation (where AV is used) is lectures. Typically, this requires the teacher to switch between lecture slides and an AV system. Here, we aim at providing the teacher with the possibility to use the animations in the lecture slides, thus ensuring the coherency of the learning materials.
For the hypertext merging, we will first do a literature review on require-ments of a visualization system (DR). Based on these requirerequire-ments, we will introduce a proof of concept implementation of a seamless way to merge visualizations into hypertext (DS and CI). For the lecture use, we apply the Xaal framework to introduce an approach to use Xaal ani-mations in lecture slides (DS and CI).
It has to be mentioned that this is a software engineering thesis, although the main application area is in education. So we are not as much considering the pedagogical aspects as we are interested in software to be used in educa-tion. Furthermore, this thesis incorporates a significant amount of constructive work. The applicability of the framework and the introduced integration ap-proaches have been tested by proof of concept implementations with enough functionality to see that the ideas could be thoroughly implemented.
1.2
Main Contributions and Structure of this Thesis
The following points summarize the main contributions of this work as well as introduces the contents of the different parts of this thesis.
• Part II: Effortless Creation of Algorithm Animation. In Publica-tion [P1], we define a Taxonomy of Effortless Creation of Algorithm Ani-mations. This work is summarized in Chapter 4. In Publication [P2]
(sum-marized in Chapter 5), we introduce a new approach for teachers to create animations by allowing effortless on-the-fly creation of algorithm anima-tions by applying visual algorithm simulation through a simple user in-terface.
• Part III: Proposed Standard for Algorithm Animation language. We define a Taxonomy of Algorithm Animation Languages to help com-paring the different AA languages (Publication [P3] and Chapter 7). The taxonomy and work by an international working group (Publica-tion [P4] and Sec(Publica-tion 8.1) is used to define a new algorithm anima(Publica-tion language, eXtensible Algorithm Animation Language, Xaal. Xaal is introduced in Publication [P5] and in Section 8.2.
• Part IV: Applications of Xaal in education. We provide two diff er-ent processing approaches for using and producingXaalanimations with existing algorithm animation systems. In addition, we have a framework aiding in this integration as well as prototype implementations of the pro-cesses (Publication [P5] and Chapter9). Furthermore, we provide a novel solution to the problem of seamlessly integrating algorithm animations with hypertext (Publication [P6] and Chapter 10). In our approach, the algorithm animation viewer is implemented purely with JavaScript and HTML. Moreover, we introduce a processing model to easily produce lec-ture slides for a common presentation tool fromXaalanimations (Pub-lication [P7] and Chapter 11).
Software Visualization
This chapter briefly defines the concepts used in the rest of this thesis. We start by defining the field of Information Visualization and proceed to Soft-ware Visualization (SV) and Algorithm Animation (AA). Furthermore, we discuss the different roles in the SV production process as well as taxonomies to characterize SV systems.
2.1
Information Visualization
Information visualization (IV) is “the use of computer-supported, interactive, visual representations of abstract data” [25]. The goal of IV is to amplify cognition, that is, aid the understanding of some aspects of the data. Without going into too much details about human perception, some of the reasons why visualizations can amplify cognition were explained by Larkin and Simon [73]: • Visualizations group related information together, reducing the searching
for needed elements.
• Visualizations use location to group information, reducing the required matching of symbolic labels.
• Visualizations support large number of perceptual inferences, which are easy for humans.
Information visualization can also be considered as an adjustable process of mapping data to visual views. This process can be modeled by the reference model of Figure 2.1 [25]. In the reference model,raw data is data typically in some domain specific format. By applying data transformations on the raw
data, relational descriptions in the form of data tables are achieved. Through visual mappings, these data tables are mapped to visual structures. Visual structures combine the spatial substrates, graphical primitives, and graphical properties. Finally, afterview transformations, theview intended for a human observer is achieved. Throughout this thesis, this will be the underlying model when discussing the creation process of algorithm visualizations.
Figure 2.1: Information Visualization reference model [25].
To better convey the steps of the reference model, Figure 2.2 gives an ex-ample from the educational world. In the exex-ample, raw data is a pile of exams and assignment solutions done by students. This data can be transformed through a possibly laborious data transformation to a data table that con-tains the exam points, assignment points, and course grades of the students. The data table is useful when the teacher publishes the results for students. However, if the teacher wants to see how the final examination points corre-late with the assignment points, a visual mapping to a scatter plot is useful. Finally, through view transformations, interaction can be added by adjusting the visualization to highlight students who got a certain grade from the course.
Figure 2.2: Example of the Information Visualization reference model. The process illus-trated is from exams on paper→exam and assignment points→visualization of points→
2.2
Software Visualization and Algorithm Animation
Software Visualization can be defined as“the visualization of artifacts related to software and its development process”[32]. As mentioned earlier, SV can be divided in visualizing the structure,behaviour, and evolution of software [32]: • Structure is the visualization of static parts and relations of the system. The information visualized is available by statically analyzing the source code without executing it. Examples of structure visualization are pretty printing, control flow graphs, and UML class diagrams, just to mention a few.
• Behaviour is the visualization of the program execution with real or ab-stract data. Topics of behaviour visualization are dynamic architecture visualization, algorithm animation, visual debugging, and visual testing. Of these, algorithm animation is of special interest in this thesis. In al-gorithm animation, the goal is to visualize the behaviour of an alal-gorithm as opposed to Program Visualization (PV) where the aim is to visualize the implementation details.
• Evolution is the visualization of the development process of the software. Evolution visualization can be, for example, visualizing software metrics changes, visualizing structural changes, or visualizing software archives such as CVS or Subversion.
Maletic et al. [79] discuss the information visualization reference model in the context of software visualization. In SV, the raw data is source code, documentation, execution trace, and so on. Data tables can be abstract syntax trees, dependency graphs, or class/objects relationships. Visual structures are the visualizations specific to some visualization software.
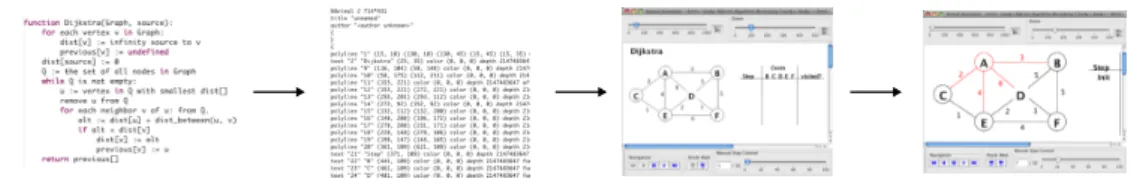
Algorithm animation can also be mapped to the reference model of Fig-ure 2.1. An example is shown in FigFig-ure 2.3. Typically, the raw data is the source code (which can be pseudo code) of an algorithm. From this, the data (tables) are constructed using some AV system. The data tables are in the form of an algorithm visualization information (AVI), which we define as the information needed to visualize an algorithm by some AV system. AVI can be, for example, in the form of text, images, or video. Analgorithm visualization systemis a tool capable of creating and interpreting an AVI and mapping it to
visual structures. The system can be interacted with to form the view. This is only one possible way for the algorithm animation process to work, and the actual model depends heavily on the animation specification approach of the AA system. Thus, the way the mappings are specified and what the AVI looks like will be discussed more in the following chapters.
Figure 2.3: Example of algorithm animation in the Information Visualization reference model. The process illustrated is from pseudo code of an algorithm→animation as
Ani-malScript[113]→visualization inAnimal[114]→zoomed visualization playing in
An-imal.
The software visualization community has not agreed upon one definition for the field. The most common of the other definitions is by Price et al. [102] who have defined software visualization as“the use of the crafts of typography, graphic design, animation, and cinematography with modern human-computer interaction technology to facilitate both the human understanding and effective use of computer software.” They divided SV into two separate fields: algo-rithm visualizationandprogram visualization. Program visualization is the use of visualization to enhance the human understanding of computer programs. Algorithm visualization (AV) is the visualization of a high-level representation of a piece of code. They further divided AV intostatic algorithm visualization and algorithm animation (AA). Algorithm animation is a dynamic algorithm visualization. The dynamic behavior can range from a series of static pictures to an animation requiring interaction from the user. The problem with this disjoint division of SV is that the line between algorithm visualization and pro-gram visualization has become fuzzy – PV systems include AV functionality and vice versa.
2.2.1 Roles in Software Visualization
The four different roles of persons who take advantage of software visualiza-tion have been introduced by Price et al [102]. Programmer is a person who develops the algorithm or program – the raw data of the reference model of
Figure 2.1 – without considering whether or not it is (going to be) visualized. SV software developer is a person who designs and implements software for SV. This software typically handles transforming the raw data to data (tables) and mapping them to visual structures. A person creating the visualization is called visualizer. Ideally, a visualizer configures how the SV software does the transformation and mapping using the existing features implemented by the SV software developer. Finally, the person using the visualization is ad-dressed asuser. The user interacts with the view transformations. In practice, these roles are often overlapping and it is common that, for example, the SV software developer is also a visualizer and a programmer.
In this thesis, the main focus is on the educational use of SV. Thus, the persons involved are student and instructor. When considering the roles in SV, the usual case is that student is the user and instructor has the rest of the roles. However, for example, in a situation where the students are required to create their own visualizations, the student is in the role of visualizer. In this thesis, we will use the terms student and instructor and indicate which of the SV roles we are discussing, unless it is clear from the context.
Until recently, the instructor has often been in the role of the developer. This stems from the fact that many of the visualization systems are not widely used outside the original university where they were developed. Usually, sys-tem development is a task that requires a lot of effort and understanding of the underlying system. Thus, to gain wider audience, SV systems need to allow the instructor to be able to work only in the roles of programmer and visualizer.
When considering the student using the visualization, research has shown that passively viewing algorithm animations does not have a significant effect on learning outcomes [50]. Therefore,engagement (activity) by the student is needed for a tool to be pedagogically useful. The differentlevels of engagement according to the engagement taxonomy [95] areviewing,responding,changing, constructing, and presenting. Viewing is passive watching of an animation where student only controls the visualization’s execution. In responding, the student is engaged by asking questions about the visualization. Changing re-quires the student to modify the visualization, for example, by changing the input data. In constructing, the student is required to construct his/her own algorithm animation. At the highest level, presenting, the student presents
a visualization for an audience. Engagement will be discussed more in Sec-tion 3.2.5.
2.2.2 Algorithm Animation Language
Throughout this thesis we will talk aboutalgorithm animation languages (AAL, or simply language). With this term we mean a textual representation de-scribing an algorithm animation or visualization. The language should have a well-defined set of concepts, syntax, and semantics defined in the language specification. An algorithm animation language is one type of algorithm visu-alization information. Thus, in the reference model of Figure 2.1, an algorithm animation language is a way to store the data (tables).
2.3
Taxonomies of Software Visualization Systems
It is difficult to choose a proper tool for software visualization from the vast amount of different SV tools supporting different features, target scope, and interaction techniques. The best suitable tool depends heavily on the type of the task. To help this process, taxonomies characterizing SV tools have been defined [11, 68, 79, 84, 85, 102, 107, 134]. In the following, we will briefly introduce these taxonomies. However, we suggest the interested reader to read the cited articles to get a deeper understanding of the taxonomies.
One of the most well-known ways to categorize and evaluate Software Vi-sualization systems is the Taxonomy of Software Visualization by Price et al. [102]. The taxonomy defines a structure of characteristics of SV systems that consists of six categories. These categories and the questions they should answer are the following.
• Scope —“What is the range of programs that the SV system may take as input for visualization?”
• Content —“What subset of information about the software is visualized by the SV system?”
• Form — “What are the characteristics of the output of the system (the visualization)?”
• Interaction — “How does the user of the SV system interact with and control it?”
• Effectiveness — “How well does the system communicate information to the user?”
The classification scheme by Myers [84] concentrates on program visualiza-tion systems. The taxonomy has two dimensions: theprogram aspect (is code or data illustrated) and thedisplay style (static or dynamic visualization). In a later version of the taxonomy [85], a third level, algorithm, was added to the program aspect.
Brown [11] introduced a taxonomy which had three dimensions: content, persistence, andtransformation. Content ranges from direct representation of code or data in the program to synthetic images showing information gathered not directly from the code. Persistence ranges from display of the current state only to displays showing the complete history of the information. Transfor-mation ranges from discrete changes to incremental continuous changes.
Roman and Cox [107] have five categories: scope (answers the question What aspect of the program is visualized?),abstraction (What kind of infor-mation is conveyed by the visualization?),specification method (What mecha-nisms does the animator use to construct the visualization?),interface (What facilities does the system provide for the visual presentation of information?), and presentation (How does the system convey information?).
Stasko and Patterson [134] introduced a model with four characteristics: aspect, abstractness, animation, and automation. Aspect is the aspect of the program that is visualized, for example, program code or data structures. Abstractness is the level of abstraction of the visualization. Animation refers to whether or not the system supports animation in the strict sense that the authors specify. Automation characterizes the level of automation provided for the visualizer.
Kraemer and Stasko [68] presented a characterization on two levels: visu-alization task being performed and the purpose of the visualization. Another task oriented framework was introduced by Maletic et al. [79]. Although the framework is developed from the point of view of large-scale software systems, it can be applied to algorithm animation as well. The categories and the questions they aim at answering are the following.
• Tasks —Why is the visualization needed? • Audience —Who will use the visualization? • Target —What is the data source to represent? • Representation —How To represent it?
• Medium —Where to represent the visualization?
As can be seen, the taxonomies have quite similar categories with slight differences in the terminology and the highlighted characteristics. Only the frameworks by Kraemer and Stasko and Maletic et al. are significantly diff er-ent. In the end, the choice of a taxonomy depends on the needs. For example, the taxonomy by Myers provides a simple way to classify the systems, whereas the taxonomy by Price et al. offers a comprehensive way to analyze systems.
Algorithm Animation
This chapter will introduce history of algorithm animation, as well as relevant research questions in the evolution of AA. We will conclude the chapter with a discussion on teachers and visualizations.
3.1
History of Algorithm Animation
The research on algorithm animation is often considered to have begun from the Sorting out Sorting video [3] by Ronald M. Baecker in 1981. It was a 30 minutes long video animating the behavior of nine different sorting algo-rithms. However, the first algorithm animations we are aware of were created in 1966 by Ken Knowlton, who made a movie about list processing using the
L6 programming language [64]. More of the early work was done by Hopgood who presented a set of films on hash tables in 1974 [44]. In 1975, Baecker pre-sented two systems that made it “possible for an instructor to produce short quick-and-dirty single-concept film clips with only hours of effort” [2].
The field has evolved a lot since the first videos and systems were intro-duced. The first well-known computerized system was BALSA (Brown AL-gorithm Simulator and Animator) [16]. BALSA is an interactive alAL-gorithm animation framework that has a support for multiple dynamic views of an algorithm and the data structures associated to it. It introduced the inter-esting events paradigm where algorithm code was annotated at interesting points by calling a separate animator. Another recognized system of the early years of algorithm animation is TANGO (Transition-based ANimation
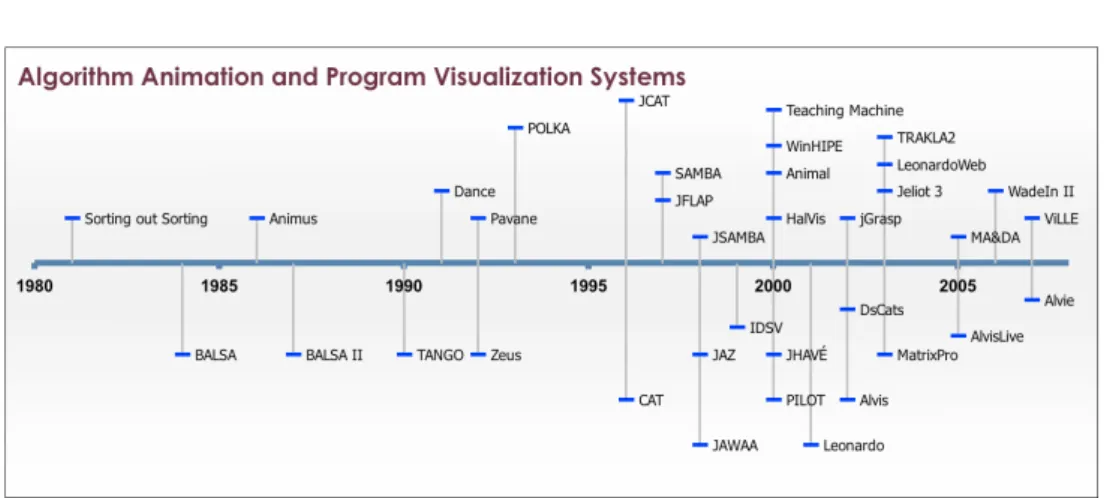
Figure 3.1: History of some Algorithm Animation and Program Visualization Systems. The vertical positioning is merely for improving readability.
atiOn) [129]. It is an AA system that introduced thepath-transition paradigm and supportedsmooth animation, a feature first included in Animus [33]. Color and sound were first used by Zeus [13]. Another of the significant features was 3D graphics, first used in POLKA-3D [135] and Zeus3D [14].
Since the early days, numerous algorithm animation systems have been developed (see,e.g., [1, 15, 24, 49, 58, 69, 83, 92, 114, 128]). Figure 3.1 shows a timeline of the various AA systems. Plenty more systems exist, but the contributions of the selected systems will be briefly mentioned in this chapter.
3.2
Research Questions in Algorithm Animation
This section will briefly introduce the key knowledge about developing and using algorithm animation systems acquired over the few decades. Naturally, it is not possible to go through all research, and we will thus focus on the most important topics relevant to our research goals. The rationale for these questions is that to cover a wide range of topics, we have chosen one ques-tion for each category of the Taxonomy of Software Visualizaques-tion by Price et al. [102]. In our opinion, these questions highlight the relevant current and existing research in the field.
3.2.1 Scope: What Platform Should be used?
In the past, selecting an algorithm animation system could depend on the platform the system used. This was illustrated as one subcategory in the Taxonomy of Software Visualization.
Earlier systems were often targeted on some specific platform(s). For ex-ample, POLKA used C++ and X window system [133], POLKA-3D Silicon Graphics GL [133], HalVis [41] was implemented using Asymmetrix Toolbook, which was for Microsoft Windows 3.0, and Alvis [49] and AlvisLive [48] using .NET.
The current situation is that a system needs to be platform independent to be used [109]. This had led to the uprising of a multitude of Java-based systems, such asAnimal[114], JAWAA [1], JAZ [9], MatrixPro, Jeliot 3 [83], ViLLE [103], and so on. Thus, the advice for system developers nowadays is to use Java or open web standards like HTML and JavaScript [117] and to integrate them with hypertext. Technologies capable of this will be discussed in the following.
Java Applets Early work on algorithm visualization in hypertext has been done by Ross and Grinder [109]. In their hypertextbooks, the inclusion of vi-sualizations is done using Java applets. This is currently a common way used in, for example, WinHIPE [137], JAWAA [1], LeonardoWeb [10], ViLLE [104], and TRAKLA2 [80]. In addition, there is a multitude of topic-specific anima-tions implemented as applets.
There are some problems in using applets. First of all, they require a plugin to be installed. Luckily, this is already installed on almost all computers. In addition, the permissions of applets are limited, unless signed and trusted by the user. A minor usability issue is the slow startup of the Java plugin and thus the visualization. When integrating with HTML, the biggest problem is that communication between HTML and the applet is difficult at best. For example, updating information (such as points gained by a student) in the HTML, based on user actions in the applet, cannot be done reliably. This is a problem, for example, in TRAKLA2, which has been worked around by showing the updated points in the applet until the HTML page is refreshed by the user.
Java Web Start Visualization systems using Java Web Start include Ani-mal [114], Jeliot 3 [83], JHAV´E [92], and MatrixPro [58]. Of these, Jeliot 3 and Animal have been integrated with Moodle, which is a popular learning environment [82, 122].
In principle, Web Start applications are similar to applets, but they are launched through a link or a button instead of embedding into a web page. As with applets, communication between HTML and visualization is almost impossible. For example, dynamic documentation in browser that is changed based on the state of the visualization is difficult to achieve. To solve this, for example, JHAV´E includes documentation within Java. Although this solution works, real browsers are better at rendering HTML than Java. The main advantage of Web Start is that the same tool can be used as a traditional application.
(Other) Rich Internet Application Technologies Several rich internet applica-tion (RIA) technologies have been introduced lately. These technologies allow creating complex applications that run in web browsers. For an overview, best practices, and comparisons of technologies, see [98]. One of the most prominent technologies is JavaScript. A multitude of JavaScript libraries aid-ing in web development have been developed, and new ones are poppaid-ing up constantly. Some of the most well-known libraries include Dojo1, Prototype2,
Scriptaculous3, jQuery4, and YUI5, just to mention a few. In algorithm
an-imation, JavaScript has been used in WinHIPE to change images on a web page and thus allowing viewing of animations [89].
When building rich internet applications, JavaScript is not the only choice. In fact, the Java based technologies can be considered as RIA technologies. In addition, there is an increasing number of promising technologies available. The most potential candidates include Adobe Flash and Flex6, Microsoft
Sil-verlight7, and Sun Microsystems JavaFX8. 1 http://www.dojotoolkit.org/ 2 http://prototypejs.org/ 3http://script.aculo.us/ 4 http://jquery.com/ 5 http://developer.yahoo.com/yui/ 6 http://www.adobe.com/products/flex/ 7 http://silverlight.net/ 8 http://www.javafx.com/
Adobe’s Flash and Flex provide technology for building cross-platform RIAs. Flash is used to visualize sorting algorithms in the Flash version of Sorting out Sorting by [37]. The tools for developing applications are quite sophisticated and powerful. However, the tools are commercial software prod-ucts developed by Adobe. Another rising technology is Microsoft Silverlight, which uses many of the same technologies as the .NET framework making it suitable for developers familiar with .NET. However, Silverlight is not cross-platform compatible. Finally, we mention JavaFX, a family of products from Sun Microsystems based on Java technology. However, this technology is not ready for production use at the moment. On a positive side, Sun plans on releasing parts of the JavaFX family as open source. It should also be men-tioned that, in the end, JavaFX applications are included in hypertext as Java applets.
In general, the newer RIA technologies have not been much utilized in algorithm animation. Thus, they have potential for future research and more creative solutions.
Other Technologies There are also other methods used to incorporate AA into hypertext. Ross’s original hypertextbooks included videos [109]. Accord-ing to current knowledge, the problem with videos is that they provide almost no interaction between the user and the visualization. Despite this, screen-casting, that is, capture of actions on a computer screen often with audio explanation [51], is becoming more and more popular on the web. However, we are not aware of using screencasting to replace algorithm animations.
3.2.2 Content: What is visualized?
In the taxonomy of Price et al., the subcategories of Content measured things like support for visualization of program and algorithm. Although algorithm animation has typically focused on visualizing the data in the algorithm, lately the visualization of both code and data has become increasingly popular.
Code visualization is a mapping between the changes in the code and the visualization of the data. Code visualization can be done in various ways, for example, by highlighting single code lines or showing several codes of the same algorithm on different abstraction levels [17]. In addition to highlighting the
current line, the code visualization can show things such as executed lines of codes (distinguished from the ones not executed) and the lines executed just before the current line [67]. More and more AV systems nowadays include pseudocode like presentation of the algorithm and highlight the current line of code. The inclusion of pseudocode has in fact been found to guide students to spend more time with the visualization [123].
In algorithm animation, the lower extreme of data being visualized is a system that uses only graphical primitives to describe the data structures. An example of such a system is SAMBA [131]. The other extreme is a sys-tem that visualizes only high level data structures, like, for example, Matrix-Pro [58]. These different approaches have both benefits and drawbacks. By using graphical primitives, the system can visualize almost any kind of struc-tures, but the creation of such animations can require quite a lot of effort. On the other hand, systems using data structures can provide an effortless way to create the animation, but are typically limited to the set of structures supported by the system.
Animations often include other elements besides code and data structures. In explanatory visualization, the idea is to include an explanation in every step of the visualization [19]. Blumenkrants et al. take this even further by introducing narrative visualizations where AVs are created as stories with a plot [8]. In addition, their visualizations include voice narration.
Typically, AVs have been constructed with the mindset that the same visu-alization is suitable for all users. Adaptivity has been long used, for example, in adaptive hypermedia [20]. Inadaptive visualization, the basic idea is to adapt the visualization content to the users profile [22]. Adaptive visualization has been used, for example, in WADEIn II together with explanations [22]. Loboda et al. have also presented a distributed framework for adaptive explanatory visualization [77].
3.2.3 Form: How to integrate the use of animations to teaching? In the original taxonomy, Medium was one subcategory of Form that focused on the target medium of the system. Here, we take a broader point of view and consider the different ways to integrate animations into teaching and the medium used. Hundhausen et al. presented a taxonomy of scenarios of AV use
in education identifying the following scenarios: lectures, study, assignments, class discussion, labs, office hours, and tests [50].
In most use scenarios, studies researching the effect of visualizations on learning have been carried out. Many of these studies will be introduced in Section 3.2.6. Naps et al. state that few teachers tightly integrate visual-izations with other parts of their courses [95]. Lahtinen suggests that to get students use visualizations, all course material and learning situations – course website, printed materials, assignments, and lecture slides – should point the students to visualizations of the topic [71]. Furthermore, Kehoe et al. hypoth-esize that animations are pedagogically more valuable when used ”in open, interactive learning situations [...] than in closed exam-style situations” [61].
Crescenzi and Nocentini have integrated visualizations into a traditional textbook [29]. The textbook they use [28] contains descriptions of the algo-rithms, analyzes them, and points the readers to the visualizations presented using ALVIE system. In addition to the textbook, visualizations are used on all the engagement levels (see Section 3.2.5) on their CS2 course. Another system that comes with examples for a textbook [31] is LeonardoWeb [10]. Finally, the JFLAP system [7] has a supporting book that goes through the concepts of automata theory using JFLAP [106].
A report of an international working group proposed enhancements to gen-eral learning management systems (LMS) to better support computer science. One of their scenarios is integration of visualizations and visualization systems into an LMS [117]. For visualization system developers, the report suggests to use Java or open web standards like HTML and JavaScript. An earlier simi-lar report focused only on how to merge visualizations and hypertext to add pedagogical value for both students and teachers [119]. Thus, web can be seen as the main target medium for visualizations. Technologies for developing for the web were discussed in Section 3.2.1.
3.2.4 Method: How the animation is generated?
In the taxonomy by Price et al., Visualization Specification Style describes the way visualizations are specified. In the original taxonomy, this was measured using terms like hand-coded, library, and automatic. However, since the tax-onomy was introduced, many different visualization specification styles have
emerged. Thus the list above is out-dated and we will introduce an alternative categorization in the following. The list is loosely based on [110]. It should be noted, that many of the current systems include several of the techniques.
Topic-Specific Animation Topic-specific animations are, as the name suggests, built specifically for some topic. Usually these are stand-alone animations in-stead of algorithm animation systems. For example, the software packages by Khuri and Hsu concentrate on image compression algorithms [63], EVEGA [62] and IAPPGA [144] concentrate on graph algorithms, and GASP-II on geomet-ric algorithms [126]. Not much can be said about this approach in the context of the visualization reference model introduced in the previous chapter, since the form of the animation data depends completely on the way the animation is implemented.
Direct Manipulation In direct manipulation [127], the animation is specified by manipulating graphical objects. In the context of the reference model, the mappings from raw data to data rows and to visual structures is done through creating and manipulating graphical objects. The raw data in this case can be, for example, a pseudo code of an algorithm in a book or merely a mental model of the visualizer. The concept of direct manipulation was first introduced in Dance [130]. Examples of other AA systems using direct manipulation are Animal [114], JAWAA editor [1, 101], and ALVIS [49].
Visual algorithm simulation [65] takes direct manipulation one step fur-ther by allowing the animation to be specified by manipulating concrete data structures through visualizations. In visual algorithm simulation, data struc-tures can be thought as data rows. The mapping to visual strucstruc-tures is done automatically, and the data rows can be modified by manipulating the vi-sual structures. Animation systems using vivi-sual algorithm simulation include MatrixPro [58] and MA&DA [69].
API-based Generation In API-based generation, the animations are gener-ated through method invocations of an application programmer’s interface (API). The method invocations are typically included when something in-teresting happens, thus this approach is often called the interesting events paradigm. The raw data in this case is the program making the API calls.
These calls create the data rows, which are then used to create the visual structures.
The first system using API-based generation was BALSA [16] followed by Zeus [12] and TANGO [129]. Later systems using this approach include JCAT [15, 90], JHAV´E’s API to generate GaigsXML [81, 91], and Animal’s API [118].
Scripting-based Generation In scripting-based generation, the animations are described using some intermediate format, usually a textual format. Com-mands using this format are then outputted from the execution of the visual-ized algorithm. Thus, the implementation of the algorithm is the raw data and the transformations to data tables are specified by the output of commands. SAMBA [131] was the first system to introduce the scripting-based generation. Examples of other systems offering scripting-based generation are ALVIE [29], Animal [113], JHAV´E [92], JAWAA [1], and JSAMBA [128]. Often, API-based generation is used to create scripts, thus offering an alternative, often more convenient way to use scripting-based generation.
Declarative Visualization Declarative visualization specifies the visualization by declaring mappings between a program state and a graphical representa-tion. This is done by using mathematical expressions. Examples of this ap-proach are Pavane [108] and the ALPHA language [30] used in the Leonardo system [27]. For example, in Pavane the mapping is defined as several sim-ple mappings, each mapping being a collection of rules. These rules describe logical relationship between the input and output spaces: v :Q(v)⇒P(v). Code Interpretation Code interpretation is also a popular style due to its effortlessness. In this approach, the visualizations are automatically gener-ated from a program code (raw data). Systems using code interpretation are typically visual debuggers or program visualization tools. Examples of such systems include Jeliot 3 [83] and jGrasp [42, 52] that automatically visualize Java programs. ViLLE [103, 104] allows automatic creation of visualizations in multiple languages from simple Java programs. WinHIPE [100, 139] allows automatic creation of visualization from a functional programming language. This topic of visualization specification styles is relevant for the
implementa-tion strategies of adding system independent AVI support to existing systems. In discussion in Chapter 12, we will consider how these different approaches fit to the idea of data exchange among systems.
3.2.5 Interaction: How to make animations interactive?
In the taxonomy of Price et al., temporal control, speed, and direction had their own subcategories, but the support for them in the analyzed systems was rare. However, today all these are seen as requirements for AV systems [120, 121] and are included in most systems. There is even a design pattern for how to implement reverse execution [111]. Still, AV system developers have strived to make visualizations more interactive, especially since theEngagement tax-onomy [95] was introduced by an ITiCSE Working Group in 2002. It has gained almost a standard like recognition in the field. The taxonomy defined the different levels of engagement as the following.
No viewing is the lowest level on the taxonomy. On this level, no visualization is used.
Viewing is the core level of engagement. It is passive watching of an ani-mation. However, the student can have controls to move backward/forward in the visualization, change the speed, etc. It should be noted, that viewing is included in all of the higher levels of engagement and is supported by all visualization systems.
Responding adds engagement by asking the student questions about the vi-sualization. The question can be, for example, “What will happen in the next step of the algorithm?”. The main idea is that students use the visualization to find the answer for the questions.
Responding has been used in many visualization systems. The first we are aware of is IDSV [54] in 1999. IDSV engaged students in different ways by requiring, for example, them to click the node visited next in a tree traversal algorithm. Other systems supporting responding include JHAV´E [92, 93], ViLLE [103], Teaching Machine [18], and Animal [114]. In Animal, the support for popup questions is achieved by an extension which offers tool independent support for responding [116]. This extension has been used also in Jeliot 3 [86] and an extension to TRAKLA2 [56].
Changing requires the student to modify the visualization. This can be, for example, changing the input data of the algorithm allowing the student to explore the algorithm’s behavior in different situations.
AV systems supporting this level of interaction include Alvis [49], ALVIE [29], and DsCats [24] where the student can give their own input to the algorithms. Furthermore, some algorithms in JHAV´E allow custom input by students. Constructing level requires the student to construct his/her own algorithm animation. This can be done, for example, in terms of direct manipulation in some algorithm animation system. It should be noted, that coding of the algorithm is not a requirement on this level.
In MA&DA [69], PILOT [4], and TRAKLA2 [80], students are given a data structure and an algorithm, and they are expected to solve the exercise by simulating algorithm. That is, they are constructing an algorithm animation. Other systems that have been used to require students to construct animations include WinHIPE [137], JHAV´E, and ALVIE.
Presenting At the highest level,presenting, the student presents a visualiza-tion for an audience. This can be, for example, a situavisualiza-tion where a student presents a visualization for the instructor and peers. The visualization can be made by the student or a third-party.
Nearly all AV systems can be used to present animations. However, some have more features designed to support this level of engagement. Animal supports presenting by having features for changing the animation speed and the magnification, a slider for fast navigation, a table of contents view to jump to points of interest, and generators to enable animation creation on-the-fly [112]. Alvis has apresentation pointer which allows pointing to objects in the animation, the markup pen to dynamically annotate the animation, and the presenter can dynamically change the animation as it is executing. MatrixPro [58] has the possibility of on-the-fly use, automatic node labeling in data structures, and a library of ready-made data structures.
Changes and extensions to the taxonomy have been proposed. For example, it has been suggested that the constructing level be divided into constructive simulation and code-based constructing and viewing be divided into active viewing and passive viewing [75].
Another extension has been proposed by Myller et al. [87]. They consider the engagement taxonomy in the context of program visualization, where they argue that four additional levels should be added. These levels are the follow-ing.
• Controlled viewing is a higher level of viewing, where the student can control the visualization, for example, by changing its speed or selecting objects to inspect.
• Entering input is the next highest level after controlled viewing. On this level, the student should be able to enter input to a program or parameters to a method.
• On themodifying level (higher than changing in the original ET), modifi-cations to the visualization are done, for example, by changing the source code or input data.
• Reviewing is the highest level of interaction in the extended taxonomy. On this level, visualizations are viewed for giving comments and feedback on the visualization itself.
Since these suggested extensions have not yet received a wide recognition like the original taxonomy, we will use the original engagement taxonomy in the rest of this thesis.
3.2.6 Effectiveness: Are Algorithm Animations Effective?
An important question in pedagogical use of algorithm visualizations is their effectiveness in students’ learning. The hypothesis by Hundhausen et al. [50] and Naps et al. [96] is that animations are effective, if they are interactive enough. Not all research on the levels of the engagement have been conclusive by finding statistically significant results supporting this hypothesis, though.
In this work, usage of animation is taken as a presumption and thus we will not examine many evaluation studies comparing no viewing with viewing. Still, we feel obligated to introduce one of the first studies that compared reading from textbook to text with animation [132]. In the post-test, questions about the algorithm were asked. The results of the test showed no significant differences, but the trend favored the group with animation.
The following introduces some of the effectiveness studies done over the years. Note, that the studies presented here include only experiments
com-paring different levels of the engagement taxonomy. We have not included pseudo-experimental studies (i.e. that had no control group) where different
engagement levels have not been compared. In addition, we focus on experi-ments that comparelearning outcomes instead of other variables like attitude or time spent. More thorough surveys of the evaluation studies related to the engagement taxonomy can be found in [50, 138].
no viewing - viewing - changing 1994 Already in 1994, a study that com-pared levels no viewing, viewing, and changing was performed [76]. The results showed improvement in learning outcomes as the level of engage-ment increased. The difference between no viewing and changing was statistically significant.
no viewing - viewing - responding 1999 Byrne et al. [23] compared lev-els no viewing, viewing, and responding. The no viewing was further divided to no animation and prediction without animation. The results show a trend towards benefit of animations and responding.
viewing - responding 2000 In 2000, an experiment comparing levels view-ing and respondview-ing was conducted [53]. The results of the survey found no statistically significant differences. However, the data indicated that the students working on level responding scored better on difficult topics, but poorly overall.
viewing - changing 2000 The HalVis system was used in an experiment comparing levels viewing and changing [41]. The viewing group used TANGO [129]. The results report (statistically significant) better learning outcomes for the changing group.
no viewing - viewing - responding 2003 Grissom et al. [39] experimented to compare levels no viewing, viewing, and responding using JHAV´E. The results show that learning improves as the level of student engagement increases. The difference between no viewing and responding was statis-tically significant.
viewing - constructing 2003 H¨ubscher-Younger and Narayanan did an ex-periment with student constructed representations9 of algorithms and
viewed peer-created representations [45]. The results showed significantly better learning results for the students authoring visualizations.
viewing - changing - constructing 2006 Lauer [74] reports on a compari-son of levels viewing, changing, and constructing. The group using chang-ing performed slightly worse on average, but the difference was not sta-tistically significant.
viewing - constructing 2007 In 2007, a study comparing levels viewing and constructing was conducted [137]. The study detected (in some topics, statistically significant) improvements in learning results on the higher level.
viewing - changing 2007 Myller, Laakso, and Korhonen compared levels viewing and changing in a collaborative environment [88]. Their results indicated that students in changing performed better, although the re-sults were not statistically significant. A second experiment by the same authors in 2008 again compared levels viewing10and changing. This time
they found statistically significant differences between the learning out-comes in favor of the level changing [70].
viewing - responding 2009 Taylor et al. compared students using passive and predictive animations of graph algorithms [136]. They conclude that students working on the responding level learned better than students viewing passive animations. It is unclear, though, whether or not their results were statistically significant.
Table 3.1 summarizes the results of the surveys introduced above. Notably, no evaluations have been done comparing the level of presenting with the other levels. Presenting AVs has been researched, though, for example, in [46, 47]. In addition, comparisons between responding and the higher levels of engagement seem to be missing as well.
When looking at a larger number of studies including those comparing view-ing and no viewview-ing, the results are encouragview-ing. In a meta-study of educational experiments using visualizations, 24 experiments were examined and in 46% of those a significant result was found where the visualization had a positive impact [50]. Only one experiment reported a significant result in the opposite direction.
Although the meta-study by Hundhausen et al. claimed that the engage-ment with the visualization is more important than the content of the
visu-10The paper discusses an extended version of the engagement taxonomy. However, the controlled viewing
T able 3.1: Studies comparing the lev els of the Engagemen t T axonom y. In the table, ∼ indicates a study with no observ ed di ff erences in learning outcomes, (+/-) indicates a study where higher lev el of engagemen t seems to impro v e/ degrade learning outcomes, and + indicates a study where the learning outcomes on the higher lev el of engagemen t w ere statisticall y significan tly higher. viewing resp onding c hanging constructing presen ting no viewing (+) La w rence [76 ] (+) Byr ne et al. [23] + La w rence [76] (+) Byr ne et al. [23] + Gr issom et al. [39] (+) Gr issom et al. [39] viewing (+) Byr ne et al. [23] + Hansen et al. [41 ] + H ¨ubsc her -Y ounger ∼ Jar c et al. [53] (+) La w rence [76] and Nar ay anan [45] (+) Gr issom et al. [39] (-) Lauer [74 ] ∼ Lauer [74] (+) T aylor et al. [136] (+) Myller et al. [88] (+) Ur quiza-F uen tes [137] + Laakso et al. [70] resp onding c hanging (+) Lauer [74] constructing presen ting
alization [50], other contributing factors have been studied as well. General problems with experimental settings (e.g. multiple variables and lack of con-trol group) were present in several experiments [40]. In addition, according to the same survey, there are often animation specific problems, such as usabil-ity issues, lack of student training, low qualusabil-ity animations, and inappropriate difficulty of topics. A survey of successful experiments found narrative and textual contents, feedback to students’ answers, and student ce
![Figure 2.1: Information Visualization reference model [25].](https://thumb-us.123doks.com/thumbv2/123dok_us/1027187.2635807/22.892.228.797.334.546/figure-information-visualization-reference-model.webp)
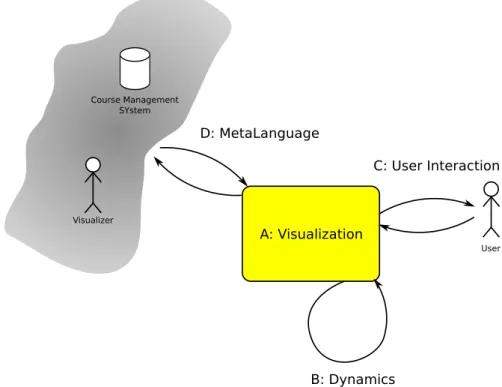
![Figure 8.1: The proposed architecture of adding XML specification support to visualization systems [97].](https://thumb-us.123doks.com/thumbv2/123dok_us/1027187.2635807/70.892.296.711.177.547/figure-proposed-architecture-adding-specification-support-visualization-systems.webp)