Faculty Scholarship
Articles & Chapters
2001
Patterns of Lending to Low-Income and Minority
Persons and Neighborhoods: The 1999 New York
Metropolitan Area Lending Scorecard
Richard D. Marsico
New York Law School
Follow this and additional works at:
http://digitalcommons.nyls.edu/fac_articles_chapters
Part of the
Banking and Finance Law Commons
, and the
Housing Law Commons
This Article is brought to you for free and open access by the Faculty Scholarship at DigitalCommons@NYLS. It has been accepted for inclusion in Articles & Chapters by an authorized administrator of DigitalCommons@NYLS.
Recommended Citation
Metropolitan Area Mortgage Lending Scorecard
Richard D. Marsico1
INTRODUCTION
This is the second in a series of annual reports2 on residential real estate-related lending3 and conventional home mortgage lending4 to minority and low- and moderate-income (LMI) persons and neighborhoods in the New York metropolitan area (New York or the metropolitan area).5 In 1991, disclosure of detailed data about home mortgage lending in these communities showed that their credit needs were not being met.6 Immediately thereafter, government officials, community groups, and lenders started to work to increase home mortgage lending in these communities.7 For several years thereafter, lending in these communities grew relative to other communities, but then the relative growth began to slow.8 The purpose of this annual Scorecard is to examine yearly trends in residential real estate-related and conventional home mortgage lending in these communities. The
1 Professor of Law, New York Law School.
I wish to thank Vicki Hurewitz for all of her assistance with this report. I also thank New York Law School for its support of my research and Danielle Petito for her patience and hard work.
2 For the first report,
see Richard D. Marsico, New York Metropolitan Area Lending Scorecard: i998, 16 N.Y.L. SCH. J. HUM. RTS. 769 (2000) (1998 Scorecard). Portions of the 1999 Scorecard, particularly those dealing with methodology, are reprinted from the 1998 Scorecard.
3 This Scorecard defines "residential real estate-related lending" as including government-insured home mortgage loans, conventional home mortgage loans, home mortgage refinance loans, home improvement loans for residential real estate, and multi-family home purchase loans.
4 This Scorecard defines "conventional home mortgage lending" as including loans to purchase a one-to-four family residential property, excluding government-insured loans.
5 More specifically, the Scorecard covers Metropolitan Statistical Area 5600,
which includes eight counties: Bronx, Kings, New York, Queens, Richmond, Rockland, Putnam, and Westchester.
6 See Richard D. Marsico, Shedding Some Light on Lending: The Effects of
Expanded Disclosure Laws on Home Mortgage Marketing, Lending and Discrimination in the New York Metropolitan Area, 27 FORD. URB. L.J. 481 (1999).
7 id. 8 id.
Scorecard will provide information for lenders, government officials, community groups, borrowers, and other interested parties to help them develop policies, programs, and strategies to ensure that sufficient mortgage credit is available to minority and LMI persons and neighborhoods.
Reflecting this goal, the 1999 Scorecard includes two significant additions. First, it includes more data about "subprime" lending to low-income and minority borrowers and neighborhoods than the 1998 Scorecard. Subprime lenders specialize in making higher-priced loans to borrowers with less than "A" rated credit, the so-called "subprime" market.9 Although subprime lending serves an important function by providing credit to people with imperfect credit histories, it is also subject to abusive practices.10 Several subprime lenders have been accused of "predatory lending" in low-income and minority neighborhoods, using high-pressure sales tactics to induce vulnerable borrowers to agree to unconscionable credit terms. 11 These terms include high interest rates, negative amortization, hidden fees and penalties, and balloon payments, and frequently result in higher than average rates of foreclosure.12 Subprime lenders have also been accused of discriminatory lending practices, including charging subprime minority borrowers higher rates and fees than subprime White borrowers and not making lower-priced prime credit available to qualified minority borrowers.13 Subprime and
9 See Glenn B. Canner & Wayne Passmore, The Role of Specialized Lenders in
Extending Mortgages to Lower-Income and Minority Homebuyers, 85 FED. RES. BULL. 709, 715-716 (1999); Bill Dedman, Study Discerns Disadvantages for Blacks in Home Mortgages, N.Y. TIMES, Nov. 14, 1999, at 18; Katharine Fraser, Revised Fair-Lending Exams Include Subprime and Auto, AM. BANKER, Sept. 14, 1999, at 2; Daniel Wise, State Agencies Finally Reach Pact Over Lender Abuse, N.Y.L.J., Sept. 23, 1999, at I.
10
Letter from John A. Joyce, Secretary of the New York State Banking Board, to Each Institution Addressed 2 (Dec. 28, 1999); Canner & Passmore, supra note 9, at 751;
Dedman, supra note 9. 11
See Dedman, supra note 9; Heather Timmons, Subprime Lender Delta Agrees to $6M Settlement with New York Attorney General, AM. BANKER, June 24, 1999, at 28;
Wise, supra note 9.
12
See Dedman, supra note 9; Timmons, supra note 11. 13
Court Rules Predatory Lending May Violate Fair Housing Act, Judge Leaves it to Jury to Decide What is Unfair or Abusive, INSIDE MORTGAGE COMPLIANCE, Oct. 16, 2000, at 2; Randy Kennedy, Home Lender Settles Suit Over Fees, N.Y. TIMES, Mar. 31, 2000, at Bl; Raun J. Rasmussen, Predatory Lending Litigation Update, N.Y.L.J., Feb. 17, 2000, at I; Use of Race to Target Communities for Unfair Loans is Illegal, Lending that Makes Housing 'Unavailable' Violates FH Act, INSIDE MORTGAGE COMPLIANCE, Apr. 3,
predatory lending have recently received much attention by government officials and community advocates, who have undertaken several initiatives to curtail abusive lending practices. 14
2000, at 2.
14 For example, in July 2000, the New York State Banking Department adopted new Part 41 of the General Regulations of the Banking Board, which regulates "high cost" home loans. See (visited February 23, 2001) <http://www.banking. state.ny.us/41amd2.htm>. Almost immediately thereafter, the Department circulated a letter seeking comments on a proposal to reduce the interest-rate threshold for defining a "high cost" home loan. See Letter from Alvin A. Narin, Acting Secretary to the Banking Board, to Each Institution or Individual Addressed (July 17, 2000). The Federal Reserve undertook several initiatives. It held a series of hearings on predatory lending practices and proposals to limit them. See Press Release, Board of Governors of the Federal Reserve System (released July 19, 2000). It also sought comments on proposed amendments to its regulations under the Home Mortgage Disclosure Act (HMDA) and the Homeownership Equity Protection Act (HOEP A) designed to combat predatory lending. See Press Release, Board of Governors of the Federal Reserve System (released November 29, 2000) (HMDA regulations), and Press Release, Board of Governors of the Federal Reserve System (released December 19, 2000) (HOEPA regulations). Four federal banking regulatory agencies, the Federal Reserve, the Federal Deposit Insurance Corporation, the Office of the Comptroller of the Currency, and the Office of Thrift Supervision issued a regulatory guidance statement relating to subprime lending. Joint Release, Banking Agencies Issue Guidance On Supervision of Subprime Lending, Board of Governors of the Federal Reserve System, Federal Deposit Insurance Corporation, Office of the Comptroller of the Currency, and Office of Thrift Supervision (released January 31, 2001). The Department ofHousing and Urban Development issued a series of reports documenting high rates of subprime lending in low-income and predominantly minority communities in five cities, including Atlanta, Los Angeles, Baltimore, New York, and Chicago. See DEP'T. OF Hous. AND URB. DEV., UNEQUAL BURDEN: INCOME AND RACIAL DISPARITIES IN SUBPRIME LENDING IN AMERICA (2000) available at (visited September 13, 2000) <wysiwyg://http://www.huduser.org/ publications/fairhsg/unequal.htrnl>. The Woodstock Institute published a similar study of subprime lending in Chicago. See DANIEL IMMERGLUCK AND MARTI WILES, Two STEPS BACK: THE DUAL MORTGAGE MARKET, PREDATORY LENDING, AND THE UNDOING OF COMMUNITY DEVELOPMENT (1999). Private attorneys are developing litigation strategies to protect their clients from predatory lending. See Odette Williamson, Protecting Elderly Homeowners from Predatory Mortgage Lenders, September-October 2000 J. Pov. L. & POL. 297. See also, Action to Draw Banks Away from Predatory Loan Market, INSIDE MORT. COMPL., May 29, 2000, at 6; Dean Anason, Treasury, HUD Urge Predatory Loan Curbs,
AM. BANKER, June 21, 2000, at 4; Dean Anason, 2 Agencies to Issue Plan for Curbs on Predatory Lending, AM. BANKER, June 18, 2000, at 4; Dean Anason, Fed, Justice Eye Existing Laws to Curb Predators, AM. BANKER, June 5, 2000, at 1; Dean Anason, Democrats Hit 'Predators' in Three Bills, AM. BANKER, April 13, 2000, at 1; Eric Bergquist, Industry Hits Back on Lending Abuse Laws, AM. BANKER, Jan, 26, 2001, at l; Rob Blackwell, Fed Proposes Even Tighter Loan Scrutiny, AM. BANKER, Dec. 14, 2000, at 1; Fed Board Considers Expanding HMDA Reporting to Include Pricing, Other Loan-Term Data to Identify Predatory Loans, INSIDE MORT. COMPL., Oct. 30, 2000, at 2; Amanda Fung,
Second, the 1999 Scorecard provides more information about individual lenders. It lists several lenders with poor lending records among low-income and minority borrowers and neighborhoods and provides information about their loan originations, market shares, and denial ratios in those communities. The Scorecard also examines the most recent performance ratings each lender with a poor lending record in at least one subject community that is a bank received under the Community Reinvestment Act (CRA).15
The Scorecard is divided into two parts. Part One examines aggregate residential real estate-related lending and conventional home Guerrero, Brokers Blast N. Y. Proposal To Fight Predatory Lending, AM. BANKER, May 3, 2000, at 2; Kevin Guerrero, Calif., N. Y. Eye Curbing Predatory Loan Terms as Congress Watches, AM. BANKER, April 26, 2000, at 1; Kevin Guerrero, Activist Group Challenges Wells' Alaska Deal, AM. BANKER, April 18, 2000, at 3; Michele Heller, Blacks Main Subprime Target, Acorn Says, AM. BANKER, Nov. I, 2000, at 2; HUD, Treasury Release Predatory Lending Report, June 26, 2000 Hous. DEV. REP. at 116; Jllinois Governor Announces Plan to Curb Predatory Lending, January 22, 2001 Hous. DEV. REP. at 597; Image Tarnished, Delta Exits High-Cost Mortgage Market, INSIDE MORT. COMPL., Oct. 16, 2000, at 9; Robert Julavits, Citi Pledges to Address Beefs About Associates, AM. BANKER, Nov. 12, 2000, at I; Robert Julavits and Mark Hochstein, Politics, Lawsuits Make Subprime a War Zone, AM. BANKER, June 23, 2000, at l; Robert Julavits, Predatory Lending Issue Puts Subprime Lenders in a Bind, AM. BANKER, April 19, 2000; Bruce Lambert, Lending Crackdown Said to Fall Short, N.Y. TIMES, May 14, 2000, at A36; Liz Moyer, Citi Takes Steps to Quiet Critics of Associates Deal, AM. BANKER, Nov. 8, 2000, at I; NY Issues 'High Cost' Rule, Further Changes Proposed, INSIDE MORT. COMPL., July 24, 2000, at 10; Regulators Draft Joint Policy Statement on Predatory Lending, Seek Comments on List of Potentially Abusive Lending Practices, INSIDE MORT. COMPL., June 12, 2000, at 2; Subprime Lenders Dominate DC Minority Census Tracts, INSIDE MORT. COMPL., July 10, 2000, at 9; Laura K. Thompson, D.C. Anti-Predatory Bill 1st to Target Foreclosures, AM. BANKER, Dec. 7, 2000, at 6; Laura K. Thompson, D.C. Bill Would Block Predator Foreclosure, AM. BANKER, Oct. 20, 2000, at l; Unscrupulous Lenders Reel From Two-Front Assault, INSIDE MORT. COMPL., April 17, 2000, at 8; Ways to Deny CRA Credit to Predatory Loans Under Study, INSIDE MORT. COMPL., October 30, 2000, at 4; Craig Woker, Bank Group Would Refinance Predator Victims' Loans, AM. BANKER, June 23, 2000, at I; and Craig Woker, Chicago Weighs Halt of City Business For Banks Linked to Predatory Loans, AM. BANKER, April 24, 2000, at I. For earlier efforts, see 1998 Scorecard at 805, n.39.
15
12 U.S.C.A. §§ 2901-2908 (1989 & Supp. 2000). The CRA states that banks have an affirmative obligation to meet the credit needs of their local communities. Id. at § 2901 (a) (3). The CRA requires the four federal banking regulatory agencies to supervise bank compliance with the CRA. The relevant agency is required to evaluate a bank's record of meting community credit needs, including low- and moderate-income neighborhoods, and to take that record into account when considering a bank's application to expand its business. id. at § 2903 (2). The agency is to issue a written evaluation report about the bank's CRA performance, including one of four ratings of the bank's performance: substantial noncompliance; needs to improve; satisfactory; and outstanding. id. at § 2906.
mortgage lending to four "subject communities" in the New York metropolitan area in 1999, the latest year for which data about such lending are available, by all lenders that are required to report such data.16 The four subject communities are minority persons, 17 LMI persons, 18 predominantly minority neighborhoods, 19 and LMI neighborhoods. 20 Part
16The Home Mortgage Disclosure Act (HMDA), 12 U.S.C.A. §§ 2801-2810
( 1989 & Supp. 2000), requires lenders, including "depository institutions" and "other lending institutions," to disclose certain information about their residential real estate-related lending. Depository institutions, including banks, savings associations, and credit unions, that as of December 31, 1998 had assets of at least $29 million and a home or branch office in an MSA, were required to report under HMDA in 1999. 12 U.S.C.A. §§ 2802 (2), 2803 (a) (!), 2808 (b); 12 C.F.R. § 203.3 (a) (2000); Federal Reserve System, Final Rule, Regulation C (Docket No. R-1033) (December 17, 1998). In 1999, "other lending institutions" included "any person engaged for profit in the business of mortgage lending," provided they had at least $10 million in assets or made 100 loans the previous year. 12 U.S.C.A. § 2802 (2) (B), (4); 12 C.F.R. § 203.3 (a) (2).
HMDA requires lenders to report information about four different types of residential real estate-related loans: I) conventional home mortgage loans; 2) federally insured home mortgage loans; 3) home mortgage refinance loans; and 4) home improvement loans. 12 U.S.C.A. § 2803 (b); 12 C.F.R. §203.4 (a); 12 C.F.R. pt. 203, app. A,§§ V.A. 3-4. HMDA also requires lenders to report whether the property that is the subject of the application has four or fewer residential units or more than four residential units. 12 C.F.R. pt. 203, app. A, §§ V.A. 4-5. If the property has four or fewer residential units, HMDA requires the lender to report whether the property is owner-occupied. 12 U.S.C.A. § 2803 (b) (2); 12 C.F.R. § 203.4 (a) (3).
For each of the four types ofresidential real-estate loans HMDA covers, lenders must report: 1) the number of applications received; 2) the race, income, and gender of each applicant; 3) the census tract in which the property that was the subject of the loan application is located; and 4) the disposition of each application, including loan originated, application denied, application approved but applicant turned down the loan, application withdrawn, or file closed because incomplete. 12 U.S.C.A. § 2803 (b) (4); 12 C.F.R. § 203.4 (a).
17
The Scorecard defines minority persons to include all the racial categories reported under HMDA except "White." These are "American Indian or Alaskan Native," "Asian or Pacific Islander," "Black," and "Hispanic." See 12 C.F.R. pt. 203, app. A,§ V.D.3 (2000).
18
The Scorecard defines an LMI person the same way as the FF IEC does when it reports HMDA data: a person with an income of less than 80 percent of the MSA median income. See, e.g., Home Mortgage Disclosure Act Disclosure Statement: Explanation of Notes (visited Apr. 12, 2000) <http://www.ffiec.gov/hmda_rpt/ notes.html>. See also 12 C.F.R. § 25.12 (n) (1) (2000).
19
The Scorecard defines a predominantly minority neighborhood as a census tract that has a minority population of 80 percent or greater. This definition corresponds to the way the FFIEC reports HMDA data. See, e.g., Business and Financial Statistics, 85 FED.
RES. BULL. A65, tbl. 4.37 (I 999).
20
One compares changes in residential real estate-related lending in these four subject communities from 1998 to 1999 to changes in such lending in their "control communities,"21 which are, respectively, White persons, UI persons,22 predominantly White neighborhoods,23 and UI neighborhoods.24 Part One includes separate "Scorecards" for residential real estate-related lending and conventional home mortgage lending that present the results of the lending comparisons in the subject and control communities. The Scorecards contain scores for various performance indicators and an overall score. Part One also analyzes subprirne lending patterns in the subject communities and compares it to subprime lending in the control communities.
Part Two of the Scorecard turns its attention to the record of individual lenders in 1999. It examines the conventional home mortgage lending record in the subject communities of each of the 152 lenders in the New York metropolitan area that made at least 30 conventional home mortgage loans in the metropolitan area, assigns a score based on their record in the subject community, ranks the lenders accordingly, and identifies which lenders specialize in making subprime loans. Part Two also identifies those lenders with particularly weak records of lending in each of the subject communities and examines the CRA rating of banks
when it reports HMDA data: a census tract that has a median family income of less than 80 percent of the MSA median income. See Home Mortgage Act Disclosure Statement: Explanation of Notes, supra note 18.
21
In the Scorecard, a "control community" is a community whose relevant characteristic is opposite that of the subject community. The assumption the Scorecard makes is that lenders lend in the control communities are unbridled by any of the inappropriate considerations or practices that they may be using in the subject communities, and thus changes in lending in the control communities represent the "normal" amount of change each year against which to measure annual changes in the subject communities.
22
The Scorecard defines a UI person the same way as the FFIEC does when it reports HMDA data: a person with an income 120 percent or higher of the MSA median income. See Home Mortgage Disclosure Act Disclosure Statement: Explanation of Notes, supra note 18.
23 In order to be consistent with the definition of a predominantly minority
neighborhood, this Scorecard defines a predominantly White neighborhood as the opposite of a predominantly minority neighborhood: a census tract with a White population of 80 percent or higher.
24
The Scorecard defines a UI neighborhood the same way as the FFIEC does when it reports HMDA data: a census tract with a median income 120 percent or higher of the MSA median income. See Home Mortgage Disclosure Act Disclosure Statement: Explanation of Notes, supra note 18.
that are lenders with poor records.
A. Summary of Results
1. Residential Real Estate-Related Lending
*Overall Growth: In contrast to 1998, which saw significant increases in residential real estate-related lending in all subject and control communities, the total number of residential real estate-related loan applications filed and loans originated increased in some communities and declined in others in 1999. White persons filed fewer applications, and White persons, predominantly minority neighborhoods, and LMI neighborhoods received fewer loans.
*Applications: With the exception of minority individuals, residential real estate-related application growth was greater in the control communities than in the subject communities in 1999; it was significantly greater in White and UI neighborhoods than in their corresponding subject communities. This contrasts with 1998, when residential real estate-related applications from both LMI and minority individuals outgrew applications from their control communities.
*Originations: Once again with the exception of minority individuals, residential real estate-related loan originations increased at greater rates in the control communities than in the subject communities in 1999. The difference in growth rates was especially significant in predominantly White neighborhoods (47.9 percent) compared to predominantly minority neighborhoods, where lending declined by 11.2 percent, and UI neighborhoods (31.9 percent) compared to LMI neighborhoods (-2.7 percent). This is in contrast to 1998, when residential real estate-related originations in each subject community outgrew increases in its corresponding control community.
*Denial Rate Ratios: Denial rate ratios25 for residential real estate-related loans declined for every subject community except predominantly minority neighborhoods, where they remained the same. This contrasts to 1998, when the denial rate ratio remained the same in three subject communities and decreased in predominantly minority neighborhoods.
25
*Scorecard Results: Overall, the subject commumttes fared slightly worse than the control communities in residential real estate-related lending in 1999, reflected in a -1 score for the subject communities on the 1999 residential real estate-related lending Scorecard. This contrasts to 1998, when the subject communities received a +5 score.
*Subject Communities: Among the subject communities, minority individuals fared the best, with a score of+ 3, as the residential real estate-related loan applications they submitted and the loans they received increased compared to White individuals, and their denial rate ratio declined. The remaining three subject communities, in contrast, had negative scores. This contrasts with 1998, when none of the subject communities had a negative score for residential real estate-related lending.
*Prime Lending: When looking at prime lenders only, the scores on the residential real estate-related loan Scorecard do not change, meaning that the relative changes in residential real estate-related applications submitted and loans originated between the subject and control communities remain constant. What does change, however, is the degree of difference in the relative change. That is, when excluding subprime lenders, applications and lending in the control communities grew at an even faster rate than in the subject communities when including all lenders.
2. Conventional Home Mortgage Lending
*Overall Growth: Consistent with 1998, which saw significant increases in conventional home mortgage lending in the subject and control communities, the number of conventional home loan applications filed and loans originated increased for all communities in 1999.
*Applications: With the exception of minority individuals, conventional home mortgage loan application growth was higher in the control communities than in the subject communities. It was significantly higher in White and UI neighborhoods than in minority and LMI neighborhoods. This contrasts with 1998, when the reverse occurred, and application growth was greater for all subject communities except for minority individuals.
*Originations: Increases in conventional home mortgage loan originations were somewhat greater for minority and LMI individuals
than White and UI individuals, respectively. In contrast, increases were much greater in White and UI neighborhoods than in predominantly minority and UI neighborhoods. This contrasts with 1998, when, except for minority individuals, conventional home mortgage lending in each subject community outgrew conventional home mortgage lending in each corresponding control community.
*Denial Rate Ratios: Denial rate ratios for conventional home mortgage loans declined for every subject community in 1999. The decline was most significant for LMI persons, for whom the denial rate ratio declined from 2.0 to 1.7, perhaps explaining why conventional home mortgage lending to LMI persons outgrew lending to UI persons even though applications from LMI persons did not outgrow applications from UI persons. The denial rate ratio for predominantly minority neighborhoods was 1.9, which is consistent with discrimination against minority neighborhoods.
*Scorecared Results: In contrast to their performance in the residential real estate-related lending market, the subject communities fared slightly better than the control communities in the conventional home mortgage lending market in 1999. The subject communities scored
+
2 on the conventional home mortgage lending Scorecard. This was not as strong, however, as 1998, when the subject communities scored +5 on the conventional home mortgage lending Scorecard.*Subject Communities: Among the subject communities, minority individuals scored the highest, with +3, as the number of conventional home mortgage loan applications they submitted and the number of loans they received increased compared to Whites, and the denial rate ratio declined. LMI individuals were next, outpacing UI individuals in originations and enjoying a decline in denial rate ratio. Predominantly minority and LMI neighborhoods each scored -1. In 1998, only minority individuals had a negative score on the conventional home mortgage lending Scorecard.
*Prime Lending: When looking at prime lenders only, the scores on the conventional home mortgage loan Scorecard do not change, meaning that the relative changes in conventional home mortgage applications submitted and loans originated between the subject communities and control communities do not change. What does change, however, is the degree of difference in the relative change. That is, when excluding subprime lenders, application and loan growth in the control
communities was generally slightly higher than growth in the subject communities than when including all lenders.
3. Minority Individuals
*Residential Real Estate-Related Lending: Among the various racial groups represented in the HMDA data, residential real estate-related loan applications declined for Native Americans and Whites in
1999, but increased for Asians/Pacific Islanders, African-Americans, and Latinos. Loan originations declined for all groups except Latinos. Asians/Pacific Islanders, African-Americans, and Latinos outperformed Whites in applications and originations, while Native Americans did not. Denial rate ratios declined for African-Americans and Latinos, and remained the same for Native Americans and Asians/Pacific Islanders.
*Conventional Home Mortgage Lending: Among the various racial groups represented in the HMDA data, the total number of conventional home mortgage loan applications and loan originations increased in 1999. The denial rate ratio declined for all subject communities except Asians/Pacific Islanders, for whom it remained the same. Overall, Native Americans, Asians/Pacific Islanders, and Latinos outperformed Whites, while African-Americans did not. Denial rate ratios for Native Americans and African-Americans, despite declining, are consistent with discrimination against those groups.
4. Subprime Lending
*Subprime lending was a much greater part of residential real estate-related and conventional home mortgage lending in the subject communities than in the control communities. Frequently, the proportion of subprime loan applications and loan originations in the subject communities was twice as high as in control communities.
*Subprime residential real estate-related lending declined in all communities in 1999 except minority and LMI individuals. Subprime conventional home mortgage lending declined in every community. Overall, declines were greater in the control communities than in the corresponding subject communities.
*Applications for residential real estate-related loans to subprime lenders increased in 1999 for all communities except UI persons, where they declined slightly. Application growth was greater in the subject
commumtles than in the control commumtles except for LMI neighborhoods, where growth was slightly lower than in UI neighborhoods. Applications for conventional home mortgage loans submitted to subprime lenders declined for all communities except LMI persons in 1999, and the decline in control communities was greater than the decline in subject communities, except for minority individuals.
5. Individual Lenders
*Individual subprime lenders as a whole outperformed all other lenders as a whole in the subject communities; only one of the 19 subprime and manufactured home lenders represented scored less than 0 on the individual lender Scorecard.
*Fifty-six lenders had a poor lending record in at least one subject community. This means that the percentage of conventional home mortgage loans the lender originated in that subject community was no more than half of the metropolitan area average, the lender's market share in the subject community was no more than half of the its share in the control community, and the lender's denial rate ratio was equal to or greater than the metropolitan area denial rate ratio.
*Many lenders that had a poor lending record shared one or more of the following characteristics: 28 made no loans at all in at least one subject community; 7 were among the top 25 conventional home mortgage loan originators; 22 had a poor lending record in more than one subject community; and, 34 were banks subject to the Community Reinvestment Act ("CRA").
*Of the 34 banks with a poor lending record in at least one subject community, none of these banks had less than a satisfactory rating on their most recent CRA examination report. Twelve of the banks were not even evaluated for their CRA performance in the New York metropolitan area because they did not include the metropolitan area within their CRA assessment area. Eighteen of the banks did not make a loan in at least one subject community.
I. RESIDENTIAL REAL ESTATE-RELATED LENDING AND CONVENTIONAL HOME MORTGAGE LENDING IN THE NEW YORK METRO POLIT AN AREA,
1998-1999
A. Residential Real Estate-Related Lending
1. Methodology
This section examines aggregate residential real estate-related lending by all lenders in the New York metropolitan area who. were required to report such lending in 1999 and compares it to 1998.26 Residential real estate-related lending includes government-insured home mortgage loans, conventional home mortgage loans, home mortgage refinance loans, home improvement loans, and . multi-family home purchase loans. This section measures residential real estate-related lending in the four subject communities and compares it to lending in the control communities.
The Scorecard employs three indicators to evaluate changes in residential real estate-related lending in the four subject communities in New York from 1998 to 1999:
*Comparative percentage change in total residential real estate-related loan applications submitted: This indicator compares the percentage change in the total number of residential real estate-related loan applications each subject community submitted from 1998 to 1999 to the percentage change in each subject community's control community.27
*Comparative percentage change in total residential real estate-related loans originated: This indicator compares the percentage change in the total number of
26 The source of the lending data in the Scorecard is the Federal Financial
Institutions Examination Council (FFIEC). The FFIEC makes HMDA data available in various ways, including through its website, http://www.ffiec.gov.
27
The number of applications a community submits is a good indicator of lenders' efforts to market loans to that community and has a strong relation to the number of loans the community receives. See Marsico, supra note 6, at 525-26.
residential real estate-related loan originations in each subject community from 1998 to 1999 to the percentage change in each subject community's control community.
*Change in denial rate ratio: This indicator measures
the change in the real estate-related loan application denial rate ratio in each subject community from 1998 to
1999.28
The Scorecard applies these three indicators to the four subject communities, resulting in twelve indicators to evaluate residential real estate-related lending in the subject communities in the New York metropolitan area in 1999:
Percentage Change in Applications Submitted, 1998-1999
1. Minority/White individuals 2. LMI/UI individuals
3. Predominantly minority/Predominantly White neighborhoods 4. LMJ/UI neighborhoods
Percentage Change in Loans Originated, 1998-1999
5. Minority/White individuals 6. LMI/UI individuals
7. Predominantly minority/Predominantly White neighborhoods 8. LMI/UI neighborhoods
Change in Denial Rate Ratio, 1998-1999
9. Minority/White applicants 10. LMI/UI applicants
11. Predominantly minority/Predominantly White neighborhoods 12. LMI/UI neighborhoods
28 A denial rate ratio is a way of measuring lenders' relative treatment of
applications from a subject community to its control community. See id. at 488. The Scorecard derives the denial rate ratio by dividing the denial rate for applications from a subject community by the denial rate for applications from its control community. For example, iflenders deny 30 percent of applications from minority persons and 15 percent of applications from Whites, the denial rate ratio is 2 (30/J 5=2).
The Scorecard assigns a score to each of the twelve indicators. There are three possible scores: "+l," "-1," or "O." The score for applications and loan originations is based on the percentage change in the number of applications from and loan originations to a subject community from 1998 to 1999 relative to the percentage change in its control community. If the percentage increase in the number of applications from or loan originations to a subject community was higher (or the percentage decrease was lower) than its control community, the score is
+
1. If the reverse occurred, the score is -1. If there was no difference, the score is 0. For the denial rate ratio, if the denial rate ratio in a subject community decreased from 1998 to 1999, the score is +1. An increased denial rate ratio is -1, and no change in the denial rate ratio is 0. For example, if the number of residential real estate-related loans originated to minority individuals increased 10 percent from 1998 to 1999 and the number of residential real estate-related loans originated to White individuals increased 8 percent, the score is+
l for that indicator.If the denial rate ratio for minorities decreased from 1.9 to 1.8, the score is also
+
1. The Scorecard tabulates the score for all the indicators to derive a total score for residential real estate-related lending in the New York metropolitan area in 1999.2. Results
Table One is the "Scorecard" for residential real estate-related lending in 1999 in the New York metropolitan area:
Table One
SCORECARD
RESIDENTIAL REAL ESTATE-RELATED LENDING NEW YORK METROPOLITAN AREA
1998-1999
SUBJECT DENIAL RATE
COMMUNITY APPLICATIONS ORIGINATIONS RATIO Minority Individuals +l +1 +1 wMI Individuals -1 -1 +1 l>redominantly Minority Neighborhoods -1 -1 0 wMI Neighborhoods -1 -1 +1 Total -2 -2 +3 TOTAL +3 -1 -2 -1 -1
As more fully elaborated in Tables Two, Three and Four, residential real estate-related loan applications filed and loans originated increased for some communities from 1998 to 1999 and decreased for others. The overall score for residential real estate-related lending in the subject communities is -1, meaning that overall the subject communities fared slightly worse than the control communities. Among the subject communities, minority individuals fared the best, with a score of +3. The remaining subject communities had negative scores. This contrasts with 1998, when residential real estate-related loan applications and originations were up for all communities, the score for the subject communities was +5, and none of the subject communities individually had a negative score.
In 1999, subprime lenders were more active in the residential real estate-related loan market in the subject communities than in the control communities, although not enough to change the results of the Scorecard. Subprime residential real estate-related loan originations declined in most
control and subject communities and declined as a percentage of all originations in each community. However, subprime lending remained a much more significant part of residential real estate-related lending in the subject communities than in the control communities.
a. Applications
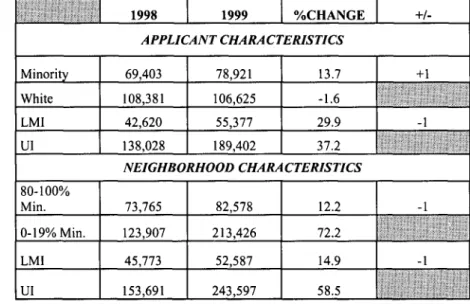
Table Two shows the total number of residential real estate-related loan applications each subject and control community submitted in 1998 and 1999, the percentage increase, and the score:29
Table Two
RESIDENTIAL REAL ESTATE-RELATED LENDING APPLICATIONS RECEIVED AND PERCENTAGE CHANGE
NEW YORK METROPOLITAN AREA 1998-1999 1998 1999 %CHANGE +/-APPLICANT CHARACTERISTICS Minorit 69,403 78,921 13.7 White 108,381 106,625 -1.6 LMI 42,620 55,377 29.9 -1 UI 138,028 189,402 37.2 NEIGHBORHOOD CHARACTERISTICS 80-100% Min. 73,765 82,578 12.2 0-19% Min. 123,907 213,426 72.2 LMI 45,773 52,587 14.9 UI 153,691 243,597 58.5
Table Two shows that applications for residential real estate-related loans from all communities - except white individuals -increased significantly. Percentage increases ranged from 12.2 percent for predominantly minority neighborhoods to 72.2 percent for
29
All percentages, denial rates, and denial rate ratios in the Scorecard are rounded to the nearest tenth.
predominantly white neighborhoods. The only subject community that outgrew its control community was minority individuals.
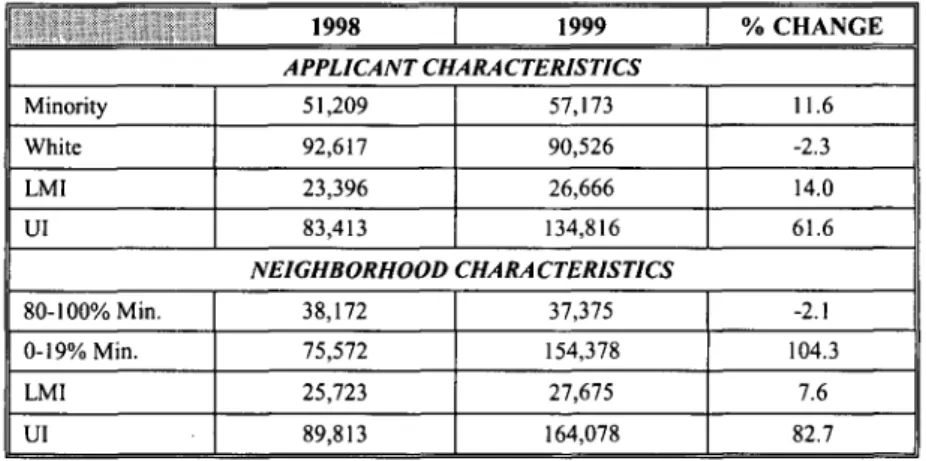
Table Two (A) examines the same criteria as Table Two but only includes prime lenders:30
Minority White LMI UI
Table Two (A)
RESIDENTIAL REAL ESTATE-RELATED LENDING APPLICATIONS RECEIVED AND PERCENTAGE CHANGE
PRIME LENDERS ONLY NEW YORK METROPOLITAN AREA
1998-1999 1998 1999 APPLICANT CHARACTERISTICS 51,209 57,173 92,617 90,526 23,396 26,666 83,413 134,816 NEIGHBORHOOD CHARA CT ER/ST/CS
% CHANGE 11.6 -2.3 14.0 61.6 80-100% Min. 38,172 37,375 -2. I 0-19% Min. 75,572 154,378 104.3 LMI 25,723 27,675 7.6 UI 89,813 164,078 82.7
30 In this and all subsequent tables that distinguish between prime and subprime lenders, the Scorecard relies on the work of Randall M. Scheessele, a researcher with the Department of Housing and Urban Development, to identify subprime lenders. See Randall M. Scheessele, 1999 HUD SUBPRIME AND MODIFIED HOME LENDERS, at tbl. A. I (2000)
available at (visited August 23, 2000) <wysiwyg://53/http://www.huduser. org/datasets/manu.html>; Randall M. Scheessele, 1998 HMDA HIGHLIGHTS, at tbl. D.Sb (Dep't ofHous. & Urban Dev., Office of Pol'y Dev. & Research, Working Paper No. HF-009) ( 1999). Scheessele identifies seventeen subprime and two manufactured home lenders in the New York metropolitan area in· 1999 and twenty subprime and two manufactured home lenders in 1998. Manufactured home lenders specialize in making loans to purchase homes that are manufactured off-site and assembled on-site. For purposes of analyzing subprime lending patterns and the record of individual subprime lenders, the Scorecard includes these manufactured home lenders with subprime lenders. As with subprime lenders, manufactured home lenders primarily operate in LMI and minority communities. See Canner & Passmore,
supra note 9, at 709, 718, 721. Manufactured home loans are deemed riskier than other home mortgage loans and borrowers tend to have weaker credit histories and fewer resources.
Comparing Table Two (A) with Table Two shows that the relative growth trends in applications for residential real estate-related loans between the subject and control communities remain constant when excluding subprime lenders; thus the results in the application section of the residential real-estate related Scorecard do not change. However, the comparison between Table Two (A) and Table Two also shows that percentage increases in applications in the subject communities were smaller when excluding subprime lenders than when including them; in fact residential real estate-related loan applications from predominantly minority neighborhoods went from a 12.2 percent growth rate to a 2.1 percent decline when excluding subprime lenders. In contrast, with the exception of white individuals, growth in the control communities increased at greater rates when excluding subprime lenders.
Table Two (B), in contrast, examines the same criteria as Table Two, but includes subprime lenders only:
Table Two (B)
RESIDENTIAL REAL ESTATE-RELATED LENDING APPLICATIONS RECEIVED AND PERCENTAGE CHANGE
SUBPRIME LENDERS ONLY NEW YORK METROPOLITAN AREA
1998-1999 1998 1999 %CHANGE APPLICANT CHARACTERISTICS Minority 18,194 21,748 19.5 White 15,764 16,099 2.1 LMI 19,224 28,711 49.3 UI 54,615 54,586 -0.l NEIGHBORHOOD CHARACTERISTICS 80-100% Min. 35,593 45,383 27.5 0-19% Min. 48,335 59,048 22.2 LMI 20,050 24,912 24.2 UI 63,878 79,519 24.5
Table Two (B) shows that all subject and control communities except UI individuals submitted more applications to subprime lenders in 1999 than 1998. The increases were markedly different for minority individuals (19.5 percent) and White individuals (2.1 percent) and LMI individuals ( 49 .3 percent) and UI individuals (-0. l percent). The growth rates were roughly equal for predominantly minority and White neighborhoods; in fact, growth in UI neighborhoods was slightly higher. Finally, Table Two (C) shows the percentage of all applications each subject and control community submitted to subprime lenders in 1998 and 1999 and the percentage change:
Table Two (C)
RESIDENTIAL REAL ESTATE-RELATED LENDING PERCENTAGE OF APPLICATIONS TO SUBRIME LENDERS
AND PERCENTAGE CHANGE NEW YORK METROPOLITAN AREA
1998-1999 1998 1999 %CHANGE APPLICANT CHARACTERISTICS Minority 26.2 27.6 5.3 White 14.5 15.1 4.1 LMI 45.1 51.8 14.9 UI 39.6 28.8 -27.3 NEIGHBORHOOD CHARACTERISTICS 80-100% Min. 48.3 54.8 13.6 0-19% Min. 39.0 27.7 -29.0 LMI 43.8 47.4 8.2 UI 41.6 32.6 -21.6
Table Two (C) shows that, except for minority individuals, the subject communities submitted applications to subprime lenders at significantly higher rates than their control communities. In fact, more
than one-half of the applications from LMI individuals ( 51.8 percent) and predominantly minority neighborhoods (55 percent) and nearly half of the applications from LMI neighborhoods (47.4 percent) were to subprime lenders. The percentages increased for all subject communities from 1998 to 1999, and declined for all control communities except Whites.
b. Originations
Table Three shows the total number of residential real estate-related loans originated in each subject community and control community in 1998 and 1999, the percentage change, and the score:
Minority White LMI
Table Three
RESIDENTIAL REAL ESTATE-RELATED LENDING LOANS ORIGINATED AND PERCENTAGE CHANGE
NEW YORK METROPOLITAN AREA 1998-1999 1998 1999 %CHANGE APPLICANT CHARACTERISTICS 41,171 75,236 17,648 42,702 68,444 21,290 3.7 -9.0 20.6 UI 82,786 101,725 22.9 NEIGHBORHOOD CHARACTERISTICS 80-100% Min. 33,314 29.583 -11.2 0-19% Min. 76,865 113,761 47.9 LMI 21,920 21,325 -2.7 UI 92,439 121,929 31.9
+/-According to Table Three, residential real estate-related lending to minority and LMI persons, UI persons, and UI and White neighborhoods grew in 1999, while lending to Whites and predominantly minority and LMI neighborhoods declined. Growth in loan originations to minorities outpaced lending to Whites, which actually declined, but
each of the other control communities outgrew its corresponding subject community.
Table Three (A) examines the same criteria as Table Three but includes prime lenders only:
Table Three (A)
RESIDENTIAL REAL ESTATE-RELATED LENDING LOANS ORIGINATED AND PERCENTAGE CHANGE
PRIME LENDERS ONLY NEW YORK METROPOLITAN AREA
1998-1999 1998 1999 %CHANGE APPLICANT CHARACTERISTICS Minority 35,268 36,786 4.3 White 66,893 64,167 -4.1 LMI 13, 178 16,300 23.7 UI 69,754 89,983 29.0 NEIGHBORHOOD CHARACTERISTICS 80-100% Min. 22,420 21,888 -2.4 0-19% Min. 63,053 103,924 64.8 LMI 15,793 17,270 9.4 UI 73,860 108,542 47.0
Comparing Table Three (A) with Table Three shows that the relative growth trends in residential real estate-related loan originations between the subject and control communities remain constant when excluding subprime lenders; thus the results on the origination section of the Scorecard do not change. The comparison between Table Three (A) and Table Three also shows that increases in originations were greater and decreases were smaller in all communities when excluding subprime lenders.
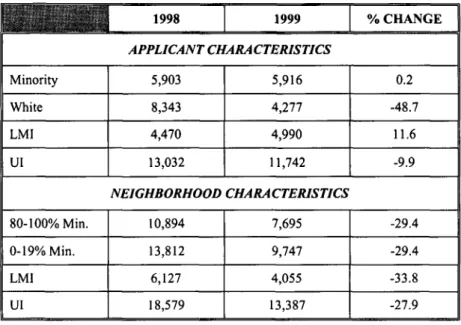
Table Three (B), in contrast, examines the same criteria as Table Three, but includes subprime lenders only:
Table Three (8)
RESIDENTIAL REAL ESTATE-RELATED LENDING LOANS ORIGINATED AND PERCENTAGE CHANGE
SUBPRIME LENDERS ONLY NEW YORK METRO POLIT AN AREA
1998-1999 1998 1999 %CHANGE APPLICANT CHARACTERISTICS Minority 5,903 5,916 0.2 White 8,343 4,277 -48.7 LMI 4,470 4,990 11.6 UI 13,032 11,742 -9.9 NEIGHBORHOOD CHARACTERISTICS 80-100% Min. 10,894 7,695 -29.4 0-19%Min. 13,812 9,747 -29.4 LMI 6,127 4,055 -33.8 UI 18,579 13,387 -27.9
Table Three (B) shows that subprime lenders originated fewer residential real estate-related loans in six of the eight communities depicted in 1999 than in 1998. There was a very slight increase in originations to minority individuals and originations to LMI persons increased 11.6 percent.
Finally, Table Three (C) shows the percentage of all originations subprime lenders made in each community in 1998 and 1999 and the percentage change:
Table Three (C)
RESIDENTIAL REAL ESTATE-RELATED LENDING
PERCENTAGE OF LOANS ORIGINATED BY SUBPRIME LENDERS AND PERCENTAGE CHANGE Minority White LMI UI 80-100% Min. 0-19% Min. LMI UI
NEW YORK METROPOLITAN AREA 1998-1999 1998 1999 APPLICANT CHARACTERISTICS 14.3 13.9 11.l 6.2 25.3 23.4 15.7 11.5 NEIGHBORHOOD CHARACTERISTICS 32.7 26.0 18.0 8.6 28.0 19.0 20.1 11.0 %CHANGE -2.8 -44.1 -7.5 -26.8 -20.5 -52.2 -32.1 -45.3
Table Three (C) shows that subprime lenders originated residential real estate-related loans in the subject communities at significantly higher rates than in their control communities; generally the rates were approximately twice as high. The percentage of subprime originations decreased for all communities in 1999, and again, the rate of decrease was significantly higher in the control communities.
c. Denial rate ratios
Table Four details changes in denial rate ratios.31 It depicts the denial rates and denial rate ratios for each subject community in 1998 and 1999 and the score:
Minority
LMI
Table Four
RESIDENTIAL REAL ESTATE-RELATED LENDING DENIAL RATE RATIOS
NEW YORK METROPOLITAN AREA 1998-1999 1998 DENIAL
RATE
DENIALRATE
RATIO
1999 DENIALRATE
DENIALRATE
RATIO
APPLICANT CHARACTERISTICS 19.0 1.5 20.3 1.4 27.3 1.8 28.7 1.6 NEIGHBORHOOD CHARACTERISTICS 80-100% Min. 22.6 1.5 27.7 1.5 LMI 21.8 1.4 26.3 1.3 +l +l 0 +lAccording to Table Four, the denial rate ratio decreased for LMI applicants' and neighborhoods and minority applicants and remained the same for minority persons. Although not depicted in Table Four, the denial rate ratio for subprime lenders was lower than for all lenders combined, at 1.2 for minority and LMI individuals and 1.1 for
31 As a reminder, the denial rate ratio is the denial rate for residential real estate-related loan applications in a subject community divided by the denial rate in its control community. For example, if the denial rate for predominantly minority neighborhoods is 20 percent and the denial rate for White neighborhoods is 10 percent, the denial rate ratio is 2.
predominantly minority and LMI neighborhoods. Denial rates in the subject communities, however, were higher for subprime lenders than all lenders combined, at 27 percent for minorities, 34 percent for LMI persons, 33 percent for predominantly minority neighborhoods, and 34 percent for LMI neighborhoods.
d. Minority individuals
Focusing next on one of the subject communities - minority individuals - HMDA data is presented so it is possible to divide minority individuals into four sub-groups: Native Americans; Asians/Pacific Islanders; African-Americans; and Latinos. It is also possible to compare lending to these individual minority groups to lending to Whites, and thus to apply each of the indicators for evaluating residential real estate-related lending to each of these four groups. The results are depicted in Table Five:
Table Five
RESIDENTIAL REAL ESTATE-RELATED LENDING RACE OF APPLICANT Native Americans Asians/Pacific Islanders African-Americans Latinos Whites Native Americans Asians/Pacific Islanders African-Americans Latinos Whites Native Americans Asians/Pacific Islanders African-Americans Latinos
NEW YORK METRO POLIT AN AREA
1998-1999 1998 1999 APPLICATIONS RECEIVED 1,081 1,030 14,599 14,979 35,917 40,385 17,806 22,527 108,381 106,625 LOANS ORIGINATED 572 489 10,324 9.909 19,866 19,489 10,409 12,815 75,236 68,444 %CHANGE -4.7 2.6 12.4 26.5 -1.6 -14.5 -4.0 -1.9 23.l -9.0 DENIAL RATE RATIO
1998 1999
DENIAL DENIAL DENIAL RATE DENIAL RATE
RATE RATIO RATE RATIO 16.1 1.3 19.1 1.3 12.3 1.0 13.9 1.0 21.2 1.7 23.6 1.6 19.3 1.5 18.9 1.3 +/--1 +l +l +I -1 +l +1 +l 0 0 +l +l
Of the groups depicted in Table Five, Whites and Native Americans fared the worst, losing applications and loans. Latinos fared the best, gaining applications and loans and declining in denial rate ratio. African-Americans and Asians gained in applications over Whites but lost loans, although not as significantly as Whites.
Among the groups depicted in Table Five, there were wide disparities in the percentage of applications they submitted to and loans
they received from subprime lenders. These are depicted in Table Five (A):
Table Five (A)
PERCENT AGE OF RESIDENTIAL REAL EST ATE-RELATED LOAN APPLICATIONS SUBMITTED TO AND LOANS ORIGINATED BY
SUBPRIME LENDERS BY RACIAL GROUP NEW YORK METRO POLIT AN AREA
1999
RACE APPLICATIONS ORIGINATIONS Native American 37.0 18.4 Asian/Pacific Islander 9.2 3.2 African-American 37.3 22.2
Latino 21.9 9.3
White 15.1 6.2
Table Five(A) shows that African-Americans received nearly one quarter of all of their residential real estate-related loans from subprime lenders. This stands in sharp contrast to Asians/Pacific Islanders and Whites, who received 3.2 percent and 6.2 percent, respectively, of their residential real estate-related loans from subprime lenders.
e. Conclusion
In conclusion, growth in residential real estate-related lending was mixed for the subject and control communities in the metropolitan area in 1999 and the subject communities fared slightly worse than the subject communities, resulting in an overall score for the control communities of -1. Among the subject communities, minority individuals had the only positive score at
+
1; among minority individuals, Latinos fared best. Subprime lenders were significantly more active in the subject communities than the control communities. Although subprime originations declined relative to all originations in all communities under study, subprime lending still remains a much more significant part of the lending in the subject communities than in the control communities.B. Conventional Home Mortgage Lending
1. Methodology
This section examines one type of loan covered by HMDA: conventional home mortgage loans.32 This section evaluates aggregate conventional home mortgage lending in the metropolitan area in 1999 in the four subject communities according to the same three indicators the previous section used to analyze all residential real estate-related lending. Applying these three indicators to the four subject communities yields the same twelve indicators used in the previous section.
2. Results
Table Six is the "Scorecard" for conventional home mortgage lending in 1999 in the New York metropolitan area:
Table Six
CONVENTIONAL HOME MORTGAGE LENDING SCORECARD NEW YORK METROPOLITAN AREA
1998-1999
SUBJECT DENIAL RATE
COMMUNITY APPLICATIONS ORIGINATIONS RATIO
Minority Individuals +I +I +I LMI Individuals -I +I +I Predominantly Minority Neii:hborhoods -1 -I +I LMI Neighborhoods -1 -I +I Total -2 0 +4 TOTAL +3 +I -I -I +2 32
The Scorecard examines conventional home mortgage lending in particular because it is a "bellwether" loan. A conventional home mortgage loan represents a significant financial stake for the lender and borrower. See Canner & Passmore, supra note 9, at 719. Promoting homeownership - especially among minorities - is a significant national social policy goal. See Dedman, supra note 9. Finally, the demand for conventional home mortgage loans compared to other loans in the New York metropolitan area was relatively heavy in 1999. Applications for conventional home mortgage loans constituted 32.4 percent of all HMO A-covered loan applications in the metropolitan area in 1999, the second highest percentage. The other percentages were federally insured - 3.9, refinance - 50.5, home improvement- 11.5, and multi-family- 1.7.
As more fully elaborated in Tables Seven, Eight, and Nine, the number of conventional home mortgage loan applications filed and loans originated increased for all communities in 1999, as they did in 1998. The score for conventional home mortgage lending in the subject communities is +2, meaning that generally the subject communities fared better in the conventional home mortgage loan market than the control communities in 1999, as they did in 1998, although the score in 1998 was +5.
Among the subject communities, minority individuals fared the best, scoring
+
3. Application and lending growth was higher than for Whites, and the denial rate ratio declined. LMI individuals were next, at+
1. Application growth was slower than for UI individuals, but originations grew at a greater rate and the denial rate ratio declined. Predominantly minority and LMI neighborhoods each scored -1. Applications and originations grew more slowly than in their control communities, but the denial rate ratio declined.As with residential real estate-related lending, subprime lenders were more active in the conventional home mortgage lending market in the subject communities than in the control communities in 1999, although not enough to change the results of the Scorecard. Subprime conventional home mortgage loan originations declined, and declined as a percentage of all conventional home mortgage loan originations in all subject and control communities in 1999, but the declines were generally greater in the control communities. Additionally, subprime lending constituted a larger portion of all conventional home mortgage lending in the subject communities than in the control communities.
a. Applications
Table Seven shows the total number of conventional home mortgage loan applications each subject community and control community submitted in 1998 and 1999, the percentage increase, and the score: Minori White LMI UI Table Seven
CONVENTIONAL HOME MORTGAGE LENDING APPLICATIONS RECEIVED AND PERCENTAGE CHANGE
NEW YORK METROPOLITAN AREA 1998-1999 1998 1999 %CHANGE APPLICANT CHARACTERISTICS 23,889 27,635 15.7 46,945 51,263 9.2 10,084 13,704 35.9 52,627 74,180 40.9 NEIGHBORHOOD CHARACTERISTICS 80-100% Min. 12,683 13,713 8.1 0-19% Min. 47,612 82,209 72.7 LMI 9,482 10,971 15.7 UI 56,775 84,951 49.6
+/-Table Seven shows that total applications increased for all communities. Percentage increases ranged from 8.1 percent for minority neighborhoods to 72. 7 percent for White neighborhoods. ·Growth in applications from minorities was greater than for Whites, but application growth was slower in the remaining three subject communities than in their control communities.
Table Seven (A) examines the same criteria as Table Seven but includes prime lenders only:
Minori White LMI UI
Table Seven (A)
CONVENTIONAL HOME MORTGAGE LENDING APPLICATIONS RECEIVED AND PERCENTAGE CHANGE
PRIME LENDERS ONLY NEW YORK METRO POLIT AN AREA
1998-1999 1998 1999 APPLICANT CHARACTERISTICS 19,280 24,235 43,114 48,959 7,821 11,246 44,289 67,328 %CHANGE 25.7 13.6 43.8 52.0 NEIGHBORHOOD CHARACTERISTICS 80-100% Min. 7,789 9,532 22.4 0-19% Min. 38,298 76,053 98.6 LMI 6,048 8,015 32.5 UI 46,001 77,570 68.6
Table Seven (A) shows significant growth in conventional home mortgage loans applications from all communities under study when excluding subprime lenders; except for LMI persons, the growth rate was greater than when subprime lenders were included. Comparing Table Seven (A) with Table Seven also shows that the relative growth trends in applications between the subject and control communities remain
constant when excluding suprime lenders; thus the results on the application portion of the conventional home mortgage lending Scorecard do not change when excluding subprime lenders. With the exception of minority and white individuals, the growth rate was higher in control communities than subject communities; the rate was significantly higher in predominantly white and UI communities than in their corresponding subject communities.
Table Seven (B), in contrast, also examines the same criteria as Table Seven, but includes only subprime lenders:
Minorit White LMI
UI
Table Seven (B)
CONVENTIONAL HOME MORTGAGE LENDING APPLICATIONS RECEIVED AND PERCENTAGE CHANGE
SUBPRIME LENDERS NEW YORK METRO POLIT AN AREA
1998-1999 1998 1999 APPLICANT CHARACTERISTICS 4,609 3,400 3,831 2,304 2,263 2,458 8,338 6,852 %CHANGE -26.2 -39.9 8.6 -17.8 NEIGHBORHOOD CHARACTERISTICS 80-100% Min. 4,894 4,181 -14.6 0-19% Min. 9,314 6,156 -33.9 LMI 3,434 2,956 -13.9 UI 10,774 7,381 -31.5
According to Table Seven (B), applications for conventional home mortgage loans to subprime lenders declined in all communities except LMI individuals. The declines were fairly significant, and the rate of decline was greater in the control communities.
Finally, Table Seven (C) shows the percentage of all conventional home mortgage loan applications each community submitted to subprime lenders in 1998 and 1999 and the percentage change:
Table Seven (C)
CONVENTIONAL HOME MORTGAGE LENDING
PERCENTAGE OF APPLICATIONS SUBMITTED TO SUBPRIME LENDERS AND PERCENTAGE CHANGE Minori White LMI UI 80-100% Min. 0-19% Min. LMI UI
NEW YORK METROPOLITAN AREA
1998-1999 1998 1999 % CHANGE APPLICANT CHARACTERISTICS 19.3 12.3 -36.2 8.2 4.5 -45.1 22.4 17.9 -20.1 15.8 9.2 -41.8 NEIGHBORHOOD CHARACTERISTICS 38.6 30.5 -21.0 19.6 7.5 -61.8 36.2 26.9 -25.7 19.0 8.7 -54.2
According to Table Seven (C), all communities under study submitted relatively fewer conventional home mortgage loan applications to subprime lenders in 1999. The decline was significantly greater in the control communities than the subject communities.
b. Originations
Table Eight shows the number of conventional home mortgage loans originated in each subject community in 1998 and 1999, the percentage increase, and the score:
Minorit White LMI UI 80-100% Min. 0-19% Min. LMI UI Table Eight
CONVENTIONAL HOME MORTGAGE LENDING LOANS ORIGINATED AND PERCENTAGE CHANGE
NEW YORK METROPOLITAN AREA 1998-1999 1998 1999 %CHANGE APPLICANT CHARACTERISTICS 15,344 17,332 12.9 35,134 37,179 5.8 5,377 7,976 48.3 37,211 50,535 35.8 NEIGHBORHOOD CHARACTERISTICS 6,330 6,499 2.7 34,543 56,495 63.5 4,960 5,569 12.3 40,796 57,425 40.8
+/-Table Eight shows that the total number of conventional home loan originations increased in all communities. Percentage increases ranged from 2.7 percent in predominantly minority neighborhoods to 63.5 percent in White neighborhoods. Growth in loan originations to Whites and LMI persons outgrew growth in their corresponding control
communities, while growth in minority and LMI neighborhoods was slower than in their corresponding control communities.
Table Eight (A) examines the same criteria as Table Eight but includes prime lenders only:
Table Eight (A)
CONVENTIONAL HOME MORTGAGE LENDING LOANS ORIGINATED AND PERCENTAGE CHANGE
PRIME LENDERS ONLY
Minori White LMI
UI
NEW YORK METROPOLITAN AREA 1998-1999 1998 1999 %CHANGE APPLICANT CHARACTERISTICS 13,363 16,450 23.1 33,160 36,484 10.0 4,834 7,533 55.8 34,681 48,757 40.6 NEIGHBORHOOD CHARACTERISTICS 80-100% Min. 4,614 5,612 21.6 0-19%Min. 30,835 55,032 78.5 LMI 3,758 4,939 31.4 UI 36,574 55,705 52.3
Comparing Table Eight (A) with Table Eight shows that the relative growth trends in conventional home mortgage loan originations between the subject and control communities remain constant when excluding subprime lenders; thus the results on the origination portion of the conventional home mortgage lending Scorecard do not change when examining prime lenders only. Comparing Table Eight (A) with Table Eight also shows that the growth rate in conventional home mortgage loan originations was greater in all communities when excluding subprime lenders. Additionally, with the exception of minority and White individuals, the growth rate in control communities was greater in the subject communities.
Table Eight (B), in contrast, examines the same criteria as Table Eight, but includes subprime lenders only:
Table Eight (B)
CONVENTIONAL HOME MORTGAGE LENDING LOANS ORIGINATED AND PERCENTAGE CHANGE
NEW YORK METRO POLIT A."N AREA SUBPR!ME LENDERS ONLY
1998-1999
';iln!'''i·•···
,,., ., ,,,,,;;.·:·,.'' "'' 1998 1999 %CHANGE APPLICANT CHARACTERISTICS Minority 1,981 882 -55.4 White 1,974 695 -64.8 LMI 543 443 -18.4 Ul 2,530 1,778 -29.7 NEIGHBORHOOD CHARACTERISTICS 80-100% Min. 1,716 887 -48.3 0-19%Min. 3,708 1,463 -60.5 LMl 1,202 630 -47.6 Ul 4,222 1,720 -59.3Table Eight (B) shows that subprime lenders originated far fewer conventional home mortgage loans in all communities under study in 1999. The decline, however, was greater in the control communities under study than in the subject communities.
Finally, Table Eight (C) shows the percentage of all conventional home mortgage loan originations subprime lenders made in each community in 1998 and 1999 and the percentage change:
Table Eight (C)
CONVENTIONAL HOME MORTGAGE LENDING
PERCENTAGE OF LOANS ORIGINATED BY SUBRIME LENDERS AND PERCENTAGE CHANGE Minori White LMI UI 80-100% Min. 0-19% Min. LMI UI
NEW YORK METROPOLITAN AREA 1998-1999 1998 1999 % CHANGE APPLICANT CHARACTERISTICS 12.9 5.1 -60.5 5.6 1.9 -66.1 IO.I 5.6 -44.6 6.8 3.5 -48.5 NEIGHBORHOOD CHARACTERISTICS 27.1 13.6 -49.8 10.7 2.6 -76.0 24.2 11.3 -53.3 10.3 3.0 -70.l
Table Eight (C) shows that subprime conventional home mortgage loans as a percentage of all conventional home mortgage lending dropped in all communities in 1999. With the exception of minority individuals, the declines were greater in the control communities than in the subject communities. In addition, Table Eight (C) shows that subprime conventional home mortgage lending remained a much greater part of conventional home mortgage lending in the subject communities than in the control communities.
c. Denial rate ratios
Table Nine depicts the denial rates and denial rate ratios for each subject community in 1998 and 1999 as well as the score:
Minorit LMI 80-100% Min. LMI Table Nine
CONVENTIONAL HOME MORTGAGE LENDING DENIAL RATE RATIOS
NEW YORK METROPOLITAN AREA 1998-1999 1998 DENIAL DENIAL RATE RATE RATIO DENIAL RATE 1999 DENIAL RATE RATIO APPLICANT CHARACTERISTICS 17.6 I.7 16.5 I.4 22.7 2.0 20.4 l.7 NEIGHBORHOOD CHARACTERISTICS 21.0 2.0 26.2 I.9 20.5 I.8 24.9 I.7 +1 +1 +1 +1
According to Table Nine, the conventional home mortgage loan denial rate ratio decreased for all subject communities, but the ratios remain relatively high. The ratio for predominantly minority neighborhoods (1.9) is consistent with discrimination against such neighborhoods.33 However, the HMDA data that is the source of this result is not sufficiently detailed to permit a definitive conclusion about discrimination.34 Nevertheless, the evidence of discrimination is sufficiently strong to merit further investigation by government agencies that have the authority to obtain the necessary information.35 Although not depicted in Table Nine, the denial rate ratios for subprime lenders was 1.1 for minority individuals, 1.4 for LMI individuals, and 1.2 for
33
See Marsico, supra note 6, at 516-18.
34
See id. at 516-17.
35
predominantly minority and LMI neighborhoods. Although subprime lender denial rate ratios were low, subprime lender denial rates were higher than for all lenders combined, ranging from 31 percent for minority individuals, 36 percent for minority neighborhoods, 38 percent for LMI neighborhoods, and 41 percent for LMI persons.
d. Minority Individuals
Focusing next on one of the subject communities - minority individuals - HMDA makes it possible to divide minority individuals into four sub-groups: Native Americans; Asians/Pacific Islanders; African-Americans; and Latinos. It is possible to compare conventional home mortgage lending to each of these groups to conventional home mortgage lending to Whites, and thus to apply each of the three indicators for evaluating conventional home mortgage lending to each of these four groups. The results of this analysis are depicted in Table Ten:
Native Americans Asians/Pacific Islanders African-Americans Latinos Whites N alive Americans Asians/Pacific Islanders African-Americans Native Americans Asians/Pacific Islanders African-Americans Latinos Table Ten
CONVENTIONAL HOME MORTGAGE LENDING RACE OF APPLICANTS
NEW YORK METROPOLITAN AREA 1998-1999 1998 1999 %CHANGE APPL/CATIONS RECEIVED 233 292 25.3 7,477 8,988 20.2 9,742 10,257 5.3 6,455 8,098 25.5 46,945 51,263 9.2 LOANS ORIGINATED 137 177 29.2 5,773 6,641 15.0 5,416 5,453 0.7 4,018 5,061 26.0 35,134 37,179 5.8 DENIAL RA TE RA TIO 1998 1999
DENIAL DENIAL DENIAL DENIAL RATE RATE RATIO RATE RATE RATIO
20.6 1.9 20.2 1.7 9.7 0.9 10.9 0.9 23.0 2.1 24.3 2.0 18.7 1.7 19.0 1.6 +!-+I +I -1 0 +I +I