OLES: an instrument for refining the design of
e-learning environments
J. Pearson& S. Trinidadw
Faculty of Education, The University of Hong Kong, Pokfulam, Hong Kong
wFaculty of Education, Curtin University of Technology, Perth Western Australia
Abstract Designing and implementing effective e-learning is a complex process, which involves many factors. Lecturers need to constantly consider, evaluate and adjust these factors to provide effective e-learning environments for students. In this paper, we report on the design and development of the Online Learning Environment Survey (OLES), an instrument which can be used to gather and represent data on students’ ‘actual’ (experienced) and ‘preferred’ (ideal) learning environments. We describe the use of this instrument in blended learning environments with university classes, illustrating how OLES can be used by educators striving for good practice in the design of effective online learning environments.
Keywords blended learning, evaluating e-learning, information and communication technologies (ICT), online learning, online learning environments, online learning environment survey (OLES)
Introduction
E-learning covers a spectrum of activities as defined by the Joint Information System Committee (JISC 2004) from supporting learning, to blended learning (a combination of face-to-face and online), to learning that is delivered entirely online. Such learning is fa-cilitated and supported through the use of information and communication technologies.
Designing and implementing effective e-learning is a complex process, which involves many factors in-cluding infrastructure, quality of content and assess-ment, quality of learner support systems, assumptions made by learners and educators about the learning experience itself and peer support networks for lear-ners and educators (Macnishet al. 2003). Obtaining ‘feedback’ from students about the design and im-plementation of the learning environment provided is
an essential part of identifying what has worked, and where improvements could be made in the future.
Recognising that learning within a classroom en-vironment is subject to the influence of numerous factors, Walberg (1979) and Moos (1974) began re-searching classroom learning environments more than three decades ago. The focus of this early research has been broadened to include the evaluation of educa-tional innovations (Teh & Fraser 1995; Maor & Fraser 1996; Newby & Fisher 1997; Fraser & Maor 2000; Fisheret al. 2001; Zandvliet, 2003) and, with the ad-vent and widespread adoption of the Internet, web-based learning (Jegede et al. 1995; Taylor & Maor 2000; Walker 2002; McLoughlin & Luca 2003; Pearson & Trinidad 2004; Trinidad & Pearson 2004; Trinidad et al. 2004). As a result of this research, links have been identified between classroom en-vironments and student outcomes (Goh et al. 1995; Fraser 1999a, b), and the effectiveness of outcomes-focused and technology-rich learning environments in promoting student retention, achievement, attitudes and equity (Trinidadet al. 2001; Aldridgeet al. 2003). Furthermore, a correlation has been shown to exist
Correspondence:J. Pearson, Faculty of Education, The University of Hong Kong, Pokfulam Road, Pokfulam, Hong kong.
E-mail: [email protected]
between students’ outcomes and the degree to which the learning environment matches their preferred learning environment (Fraser & Fisher 1983; Fraser 1998, 1999a; Dorman 2002; Aldridge et al. 2003, 2004). Changing the learning environment to more closely match students’ preferred environment can result in improved achievement of affective and cog-nitive learning outcomes. If outcomes can be im-proved in this way, changes to classroom or e-learning environments can be monitored by periodically mea-suring perceptions of the ‘actual’ and ‘preferred’ learning environments provided. Alternatively, suc-cessive iterations of the same module with different classes – as in the case of the university classes dis-cussed in this paper – can be assessed with a view to enhancing the learning environment for subsequent cohorts of students. In this way, congruence between the ‘actual’ and ‘preferred’ environments can be used to measure and evaluate changes, which are antici-pated to lead to improve learning outcomes for stu-dents. This was the rationale used in the design and development of the Online Learning Environment Survey (OLES) instrument described in this paper.
Research has also made extensive use of qualitative data (observations, interviews, student comments) in assessing learning environments (Fraser 1998; Trini-dadet al. 2004). This is particularly useful to acquire ‘detailed information about implementation . . . [or] to identify and understand change over time’ (Erickson 1998, p. 1155). Therefore, it was decided to collect qualitative data from students in the university classes reported in this paper. This was done initially through online interviews with students and, after the redesign of OLES, by asking students to include written com-ments with their OLES responses.
Method
OLES (see http://www.monochrome.com.au/oles/survey. htm) is available as a web-based instrument, and re-spondents are asked to indicate their ‘actual’ and ‘preferred’ experience with components of online learning in a module they have just completed.
OLES incorporates scales from four existing in-struments: (a) What is Happening In this Class? (WIHIC; Fraseret al. 1996); (b) theDistance Educa-tion Learning Environments Survey (DELES; Jegede et al.; Walker, 2002); (c) the Technology-Rich
Out-comes-Focused Learning Environment Instrument (TROFLEI; Aldridgeet al. 2003; Aldridgeet al. 2004); and (d) theTest of Science-Related Attitudes (TSRA; Fraser 1981). Estimates of reliability for OLES were found to be satisfactory – for both the ‘actual’ and ‘preferred’ forms of OLES, the internal consistency (Cronbachareliability) estimates ranged from 0.86 to 0.96 for the ‘actual’ version and from 0.89 to 0.96 for the ‘preferred’ version (Trinidadet al. 2004).
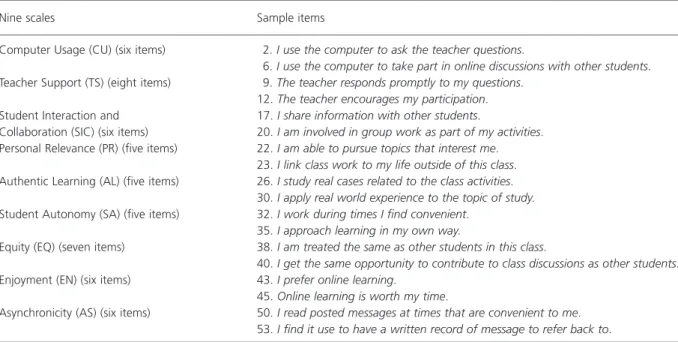
OLES contains 54 items arranged in nine scales – Computer Usage (CU); Teacher Support (TS); Student Interaction and Collaboration (SIC); Personal Rele-vance (PR); Authentic Learning (AL); Student Autonomy (SA); Equity (EQ); Enjoyment (EN); and Asynchro-nicity (AS) – which are the same in both the student and teacher versions. Samples of items in each scale are shown in Table 1. Respondents are asked to rate items using a five-point scale (Almost Never; Seldom; Sometimes; Often; Almost Always). In the latest version of the software, respondents are also asked for written comments after completing the items on each scale.
The OLES instrument was developed using online technologies, including a web-survey format and a SQL database where the data are instantly captured and exported. This makes the instrument very easy to administer in the computer laboratory or online to a group of distance learners. The latest version of OLES can be administered totally online by the lecturer with charts being automatically produced for discussion and comparison.
Setting
The Faculty of Education at the University of Hong Kong provides on-going graduate studies for teachers and other education professionals in information and communication technologies in a two-year part time Masters degree in Information Technology in Educa-tion. The MSc[ITE] programme is conducted in the face-to-face mode supplemented by an online course room - Interactive Learner Network (ILN) (see http:// www.cite.hku.hk/en/) supporting computer-mediated communications.
The two core modules (83 h per week) discussed here are: (a)Information Technology and Educational Leadership– taught by one of the authors of this paper in 2004 and 2005; and (b)Teaching and Learning with Information Technology– taught by the other author
in 2004. Data were also collected using OLES for the student cohort in this module in 2003 (Trinidadet al. 2004). On each occasion these modules were offered, online discussions were used as an adjunct to class-room presentations by lecturers. These took the form of weekly presentations and discussions on set read-ings, and discussions about issues/concerns about ICT in education.
Results and discussion
Students’ responses on OLES for the four case study modules are presented in the following sections. Statis-tical testing (MANOVA for repeated measures) was undertaken to investigate whether differences between actual and preferred mean scores on the nine OLES scales were significant. The effect sizes were also cal-culated to estimate the magnitude of the differences be-tween students’ ‘actual’ and ‘preferred’ scores on OLES. These results are reported separately for each module (Tables 2–5). Students’ comments (where relevant) about their OLES responses are also reported to provide addi-tional information about each of the modules.
Information technology and educational leadership
Results (Table 2) for the group of MSc[ITE] students takingInformation Technology and Educational
Lea-dership in 2004 indicates that: (a) students’ ‘actual’ and ‘preferred’ mean scores for most scales are gen-erally high; (b) ‘actual’ experiences scored lower than ‘preferred’ experiences (a typical finding); and (c) differences in mean scores are quite small, except for the scales of TS, PR and AL where differences be-tween ‘actual’ and ‘preferred’ mean scores are greater. As indicated in Table 2, the difference between the ‘actual’ and ‘preferred’ scores for Authentic Learning (AL) was significant (Po0.01 level).
The scores for ‘personal relevance’ and ‘authentic learning’ confirmed impressions gained by the lecturer during the semester. The content needed revising, and the nature and number of online learning activities needed to relate more closely with the content. This was confirmed in student comments about ‘too much information’, ‘too many online forums’ and the con-tent of the module being ‘out of touch’. Hence, concon-tent introduced and the ways this was handled were re-viewed. Where possible, discussion topics were plan-ned which related directly to the concepts and issues introduced in the module; made greater use of the permanently stored messages, rather than simply using forums as places to record the outcomes of group discussions; and used available online surveys about ICT to collect student data for analysis and discussion in online forums.
Table 1. Scales on Online Learning Environment Survey and sample items
Nine scales Sample items
Computer Usage (CU) (six items) 2.I use the computer to ask the teacher questions.
6.I use the computer to take part in online discussions with other students. Teacher Support (TS) (eight items) 9.The teacher responds promptly to my questions.
12.The teacher encourages my participation. Student Interaction and
Collaboration (SIC) (six items)
17.I share information with other students.
20.I am involved in group work as part of my activities. Personal Relevance (PR) (five items) 22.I am able to pursue topics that interest me.
23.I link class work to my life outside of this class. Authentic Learning (AL) (five items) 26.I study real cases related to the class activities.
30.I apply real world experience to the topic of study. Student Autonomy (SA) (five items) 32.I work during times I find convenient.
35.I approach learning in my own way.
Equity (EQ) (seven items) 38.I am treated the same as other students in this class.
40.I get the same opportunity to contribute to class discussions as other students. Enjoyment (EN) (six items) 43.I prefer online learning.
45.Online learning is worth my time.
Asynchronicity (AS) (six items) 50.I read posted messages at times that are convenient to me. 53.I find it use to have a written record of message to refer back to.
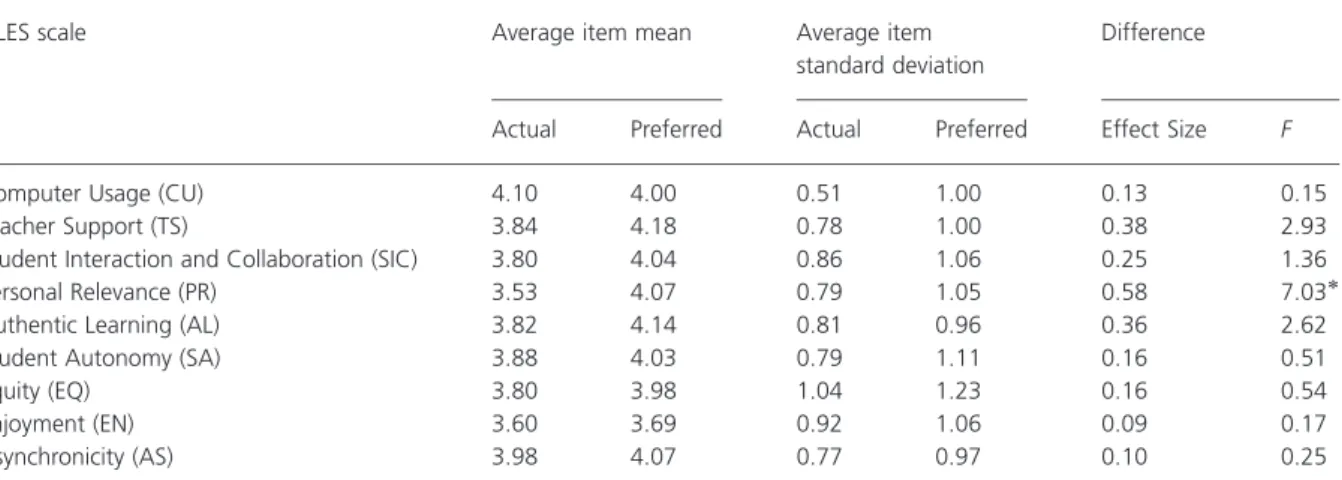
The module Information Technology and Educa-tional Leadership was taught again in 2005. Data presented in Table 3 indicate that: (a) students’ ‘ac-tual’ and ‘preferred’ mean scores for most scales were again high; (b) ‘actual’ experiences again scored lower than ‘preferred’ experiences, but marginally on most scales; (c) ‘actual’ and ‘preferred’ mean scores on the AL scale were much closer that the previous year, indicating that the changes in the nature of on-line learning activities made after the module had
been offered the first time had been successful; and (d) differences in scores were quite small, except for the PR scale where differences between ‘actual’ and ‘preferred’ mean scores are wider (and statisti-cally significant at 0.05 level). Students’ comments on OLES about ‘authentic learning’ and ‘per-sonal learning’ were positive, and related to the value of ‘sharing ideas and experience’, ‘learning from others’ and ‘applying what I learnt to my working situation’.
Table 2. Average item mean, average item standard deviation and difference (effect size and MANOVA results) between students’ actual and preferred scores on the Online Learning Environment Survey (OLES) forInformation Technology and Educational Leadership (2004) module
OLES scale Average item mean Average item
standard deviation
Difference
Actual Preferred Actual Preferred Effect Size F
Computer Usage (CU) 4.08 4.28 0.55 0.57 0.357 0.97
Teacher Support (TS) 3.82 4.28 0.63 0.64 0.724 4.06
Student Interaction and Collaboration (SIC) 4.06 4.41 0.57 0.59 0.603 2.80
Personal Relevance (PR) 3.68 4.28 0.85 0.93 0.673 3.43
Authentic Learning (AL) 3.77 4.44 0.60 0.57 1.145 9.80
Student Autonomy (SA) 4.25 4.61 0.64 0.50 0.627 2.93
Equity (EQ) 4.06 4.18 0.73 0.70 0.17 0.23
Enjoyment (EN) 3.61 3.53 0.85 1.15 0.079 0.04
Asynchronicity (AS) 3.90 4.21 0.88 0.78 0.373 1.06
Po0.01.
N515 students. Average item mean5scale mean divided by the number of items in that scale.
Table 3. Average item mean, average item standard deviation and difference (effect size and MANOVA results) between students’ actual and preferred scores on the Online Learning Environment Survey (OLES) for theInformation Technology and School Leadership (2005) module
OLES scale Average item mean Average item
standard deviation
Difference
Actual Preferred Actual Preferred Effect Size F
Computer Usage (CU) 4.10 4.00 0.51 1.00 0.13 0.15
Teacher Support (TS) 3.84 4.18 0.78 1.00 0.38 2.93
Student Interaction and Collaboration (SIC) 3.80 4.04 0.86 1.06 0.25 1.36
Personal Relevance (PR) 3.53 4.07 0.79 1.05 0.58 7.03
Authentic Learning (AL) 3.82 4.14 0.81 0.96 0.36 2.62
Student Autonomy (SA) 3.88 4.03 0.79 1.11 0.16 0.51
Equity (EQ) 3.80 3.98 1.04 1.23 0.16 0.54
Enjoyment (EN) 3.60 3.69 0.92 1.06 0.09 0.17
Asynchronicity (AS) 3.98 4.07 0.77 0.97 0.10 0.25
Po0.05.
Comments on the set readings and related discus-sions indicated that the extensive revision of the content of the module had addressed some of the concerns related to ‘authentic learning’.
The most valuable aspects of the module were the in-depth reviews/case studies/journals on ICT policy in Hong Kong and throughout the world.
I appreciated the different examples and case studies that were presented in this course. These really helped me expand my views of ICT leadership.
However, other comments indicated that further at-tention could be given to the ‘personal relevance’ of the content to all students.
Is it possible to include e-leadership in organizations, and not only focus on schools?
To broaden my horizons about ICT in society, it should include policy-making in non-government organiza-tions and private sectors.
While most enrolled students were teachers in schools, several worked in other educational settings (uni-versities, technical and further education). On reflec-tion, this had not been anticipated when the module had been revised. Hence, the school-focused policy documents and case studies may not have been con-sidered as relevant to their situation. This is an aspect, which will be given further attention when the module is revised the next time.
Teaching and learning with information technology
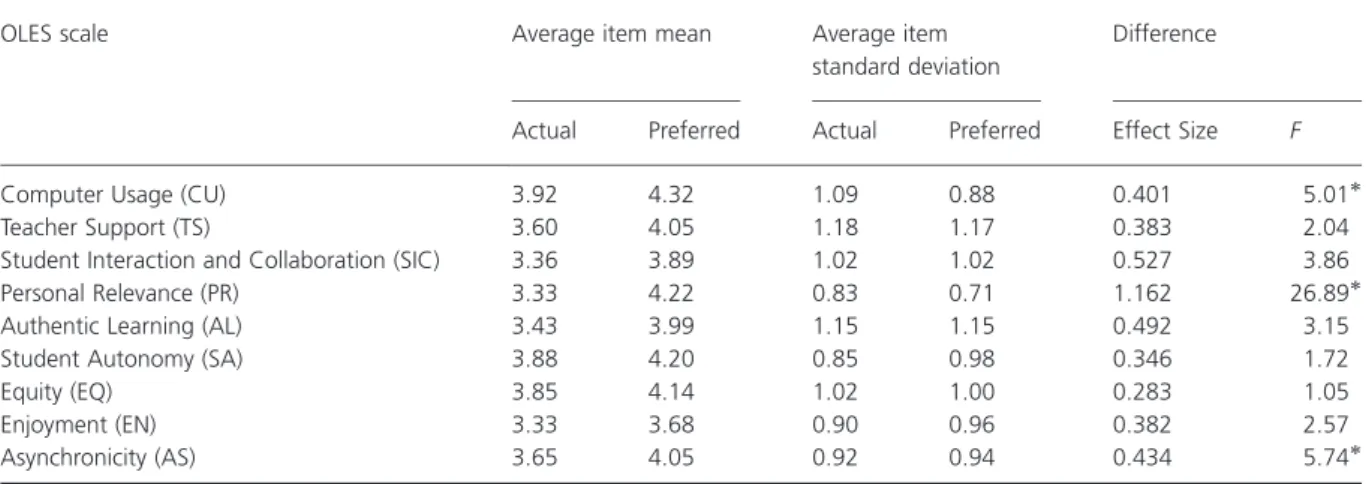
The OLES results for the module Teaching and Learning with Information Technology (2003) are shown in Table 4.
These data reveal substantial differences for the SIC, PR, AL and EN scales. The ‘actual’ and ‘pre-ferred’ scores for most scales for the first iteration are relatively low (ranging from an averaged item mean of 3.33 to 3.92 for ‘actual’ and 3.68 to 4.32 for ‘pre-ferred’). Statistical testing revealed significant differ-ences on the CU, PR and AS scales (Table 4).
The lecturers agreed that the module needed up-dating, refining and restructuring. There was far too much content and not enough time for students to work together in a collaborative manner. They felt that ILN could be used more effectively to help students work together, and that the content could be updated to be more personally relevant and provide more au-thentic learning opportunities for students. These suggestions for changes were reflected in student’s evaluative comments:
It is better to have more time for each group discussion/ reflection.
Too many activities have to be done with a short time frame. In the later sections, there are too much mate-rials to go through and too little time for discussion and posting.
Excessive group discussion means we can’t take a rest during the break! The course is very packed. Too much
Table 4. Average item mean, average item standard deviation and difference (effect size and MANOVA results) between students’ actual and preferred scores on the Online Learning Environment Survey (OLES) forTeaching and Learning with Information Technology (2003) module
OLES scale Average item mean Average item
standard deviation
Difference
Actual Preferred Actual Preferred Effect Size F
Computer Usage (CU) 3.92 4.32 1.09 0.88 0.401 5.01
Teacher Support (TS) 3.60 4.05 1.18 1.17 0.383 2.04
Student Interaction and Collaboration (SIC) 3.36 3.89 1.02 1.02 0.527 3.86
Personal Relevance (PR) 3.33 4.22 0.83 0.71 1.162 26.89
Authentic Learning (AL) 3.43 3.99 1.15 1.15 0.492 3.15
Student Autonomy (SA) 3.88 4.20 0.85 0.98 0.346 1.72
Equity (EQ) 3.85 4.14 1.02 1.00 0.283 1.05
Enjoyment (EN) 3.33 3.68 0.90 0.96 0.382 2.57
Asynchronicity (AS) 3.65 4.05 0.92 0.94 0.434 5.74
Po0.05.
theory and no time for the student to digest what we learn!
Group activity in class, as it spent too much time on it, and I don’t think it can help me learn effectively. The content of the module was rewritten to model sound learning, teaching and assessment practices in the second iteration. Since this was a foundation module in the programme, the new version of Teaching and Learning with Information Technology was carefully structured to introduce the ILN online learning environment to students and to encourage group work through both online and face-to-face ses-sions. A series of rich assessment tasks (Albon & Trinidad 2002), in which students compose elements of group and individual tasks to construct their own knowledge were designed. A social constructivist ap-proach was used; class learning experiences were based on the philosophy that learning does not take place in a solitary manner but in a socially active learning environment where learners are given op-portunites to construct their own learning in a social context. The module was adjusted to also include two totally online sessions. The aim here was to give stu-dents more time for reflection and reading, as well as more time for online collaboration using ILN.
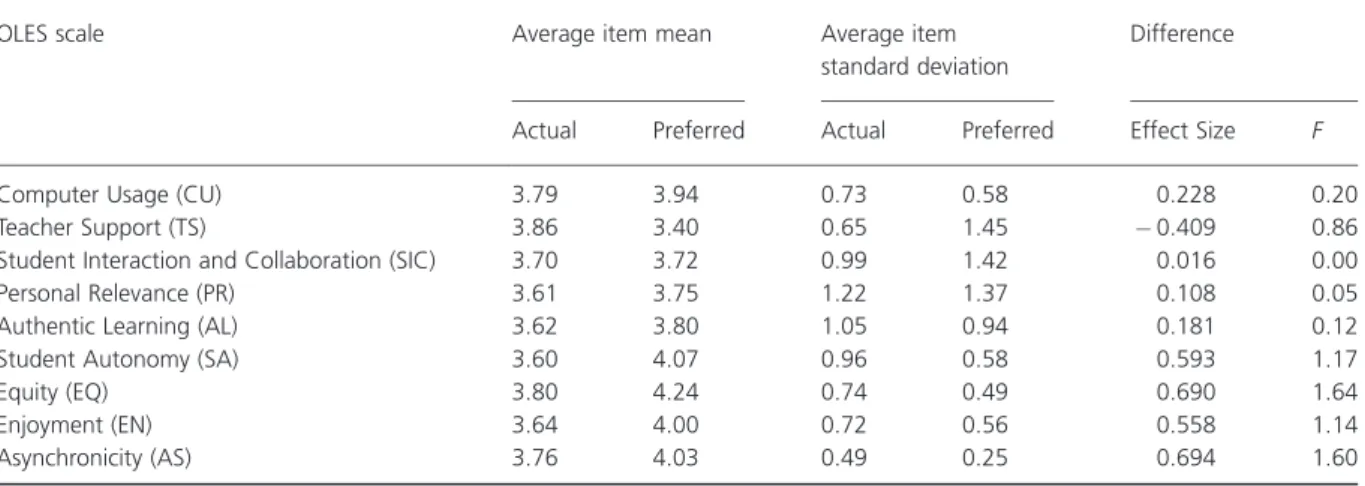
Table 5 presents data for the moduleTeaching and Learning with Information Technology, which was taught for the second time in 2004.
The ‘actual’ and ‘preferred’ mean scores for most scales were generally much closer than for the first
iteration, ranging from an averaged item mean of 3.60 to 3.86 for ‘actual’ and 3.40 to 4.24 for ‘preferred’. Statistical testing revealed no significant differences for the OLES scales for the second iteration of the module. Both the quantitative and the qualitative data indicated that students were very satisfied with the module and the support they received, and felt that the two lecturers were well organized and supportive. There were many positive comments such as:
Overall, I think the course was very well thought out and I can appreciate the effort that went into making it innovative.
The teachers provided a lot of information on what we should prepare for each class and replied to my ques-tions promptly and clearly. They are good facilitators during the learning process as well. It is really great that they provided a lot of opportunities for us to contribute and share our knowledge in the class.
The group work set up of each session was very good. It enabled me to focus on issues and clarify points with my group. Using computers as the only medium for communication during each session made it easy to keep a record of our work in one place. Coming away with a vast list of useful websites is appreciated. I would not have had time to find them on my own. Presentations of summaries of papers were very useful to help me understand the content.
Sharing ideas through ILN helped me understand my own work place more.
The use of the KWL model helped me to build my own e-journal.
On the TS scale, students’ mean ‘actual’ score (3.86) was higher than the ‘preferred’ score (3.40), indicating
Table 5. Average item mean, average item standard deviation and difference (effect size and MANOVA results) between students’ actual and preferred scores on the Online Learning Environment Survey (OLES) forTeaching and Learning with Information Technology (2004) module
OLES scale Average item mean Average item
standard deviation
Difference
Actual Preferred Actual Preferred Effect Size F
Computer Usage (CU) 3.79 3.94 0.73 0.58 0.228 0.20
Teacher Support (TS) 3.86 3.40 0.65 1.45 0.409 0.86
Student Interaction and Collaboration (SIC) 3.70 3.72 0.99 1.42 0.016 0.00
Personal Relevance (PR) 3.61 3.75 1.22 1.37 0.108 0.05
Authentic Learning (AL) 3.62 3.80 1.05 0.94 0.181 0.12
Student Autonomy (SA) 3.60 4.07 0.96 0.58 0.593 1.17
Equity (EQ) 3.80 4.24 0.74 0.49 0.690 1.64
Enjoyment (EN) 3.64 4.00 0.72 0.56 0.558 1.14
Asynchronicity (AS) 3.76 4.03 0.49 0.25 0.694 1.60
that students felt they had more than adequate TS and opportunities for group work in a relevant and au-thentic learning environment. The two lecturers had attempted to work closely together during the face-to-face sessions, and the two sessions conducted totally online, to provide a more integrated module based on authentic learning experiences. The module effec-tiveness was summed up by a student’s comment about the e-learning experienced:
It is a convenient and effective teaching and learning method. It is amazingly good that I can have such a learning experience, as it can motivate me to provide this kind of teaching in my work place. And the design of the course is great, as it shows me what a successful e-learning experience can be like.
After reflecting on the data the two lecturers, both of whom were Western, agreed that two areas for im-provement for the next iteration of Teaching and Learning with Information Technology were EQ and SA. Part of the assessment for this module involved group work and, as is often the case not all students contributed equally. Therefore, the lecturers decided that students would be required to more fully describe the role of each group member so issues about uneven contributions could be dealt with early in the module. Both lecturers agreed that language was an issue with some of the Chinese students for whom English can be considered to be a ‘foreign language’ rather than a second language as English is not used all the time. For many students the only time they spoke English was during these classes. Providing quality English e-learning environments for Chinese students allows them to review the materials at their own pace to gain greater understanding, and working in groups allows students to reinforce their knowledge in their native language (Cantonese) giving adequate cogni-tive processing time to go back and forth between the two languages to further understand meaning. Both lecturers felt that the second iteration of theTeaching and Learning with Information Technology module had allowed their students to achieve this.
Conclusion
In this paper, we have described the use of the OLES to gather data on students’ experiences in two modules in an MSc programme that used e-learning
ex-tensively. In both modules, data gathered on the nine scales of OLES were used to guide major revisions. OLES enabled lecturers to compare students’ per-ceptions of the learning environment they experienced with their ideal learning environment. These percep-tions, graphically portrayed by the OLES software, were used when modules were reviewed. Qualitative data were also used to verify differences between ‘actual’ and ‘preferred’ perceptions of the learning environment. For the purposes of this paper, additional statistical analyses were undertaken to verify the sig-nificance of the differences identified in the data.
After the revised modules were taught for a second time, OLES was again used to gather data on whether the changes made had been successful. It was found that students’ ‘actual’ perceptions more closely mat-ched their ‘preferred’ learning environment, although differences on some scales indicated that further im-provements could be made. In this way, OLES assisted lecturers to reflect on what worked and what might be changed to design and implement effective e-learning environments.
In the cases described in this paper, OLES was found to be easy to administer and an efficient way of obtaining student feedback about e-learning modules. The graphical display of differences between ‘actual’ and ‘preferred’ scores on the various scales clearly identified the components of the module, which nee-ded further reflection. Written comments by re-spondents also added valuable data to help with reflection. Changes in students’ scores on scales which received specific attention during the revision of modules demonstrated how OLES could assist tea-chers to monitor the changes made in the online learning environment provided for students.
Data analysis and charting, now updated im-mediately by the software can, in future, be used to discuss responses with students. In this way, additional information can be obtained about components of modules, which may require revision. One of the challenges of using OLES is that working with stu-dents in blended learning situations may not always be possible. While an advantage of OLES is that it can be completed online, participants are not with the edu-cator at the time of administration to openly discuss the responses given.
Educators need not only knowledge of learning theories and models of best practice to design and
implement e-learning environments, but also ‘feed-back’ on how specific attempts to do so have matched the preferred learning environment of students. OLES provides a practical approach to collecting this ‘feedback’ at a time when greater use is being made of e-learning environments worldwide.
References
Albon R. & Trinidad S. (2002) Building learning commu-nities through technology. In International Lifelong Learning Conference: Refereed papers from the 2nd In-ternational Lifelong Learning Conference(eds K. Ap-pleton, C. Macpherson & D. Orr), pp. 50–56. University of Central Queensland, Yeppoon, Central Queensland, Australia.
Aldridge J., Dorman J. & Fraser B. (2004) Use of multitrait-multimethod modelling to validate actual and preferred forms of the Technology-Rich Outcomes-Focused Learning Environment Inventory (TROFLEI).Australian Journal of Educational & Developmental Psychology4, 110–125. Aldridge J., Fraser B., Fisher D., Trinidad S. & Wood D.
(2003) Monitoring the success of an outcomes-based, technology-rich learning environment. Paper Presented at the Annual Meeting of the American Educational Research Association, Chicago, IL, April.
Dorman J. (2002) Classroom environment research: progress and possibilities. Queensland Journal of Educational Research 18, 112–140. Available at: http://education. curtin.edu.au/iier/qjer/qjer18/dorman.html.
Erickson F. (1998) Qualitative research methods for social education. In The International Handbook of Science Education (eds B.J. Fraser & K.G. Tobin), pp. 1155– 1173. Kluwer Academic Publishers, Dordrecht, The Netherlands.
Fisher D., Aldridge J., Fraser B. & Wood D. (2001) Devel-opment, validation and use of a questionnaire to assess students’ perceptions of outcomes-focused, technology-rich learning environments. Paper Presented at the Annual Conference of the Australian Association for Research in Education, Perth, Western Australia, De-cember.
Fraser B.J. (1981) Tests of Science-Related Attitudes (TOSRA). Australian Council for Educational Research, Melbourne.
Fraser B.J. (1998) Classroom environment instruments: de-velopment, validity and applications.Learning Environ-ment Research: An International Journal1, 7–33. Fraser B.J. (1999a) Using learning environment assessments
to improve classroom and school climates. In School climate: Measuring, Improving and Sustaining Healthy
Learning Environments (ed. H.J. Freiberg), pp. 65–83. Falmer Press, London.
Fraser B.J. (1999b) ‘‘Grain sizes’’ in learning environment research: combining qualitative and quantitative meth-ods. InNew Directions for Teaching Practice and Re-search (eds H.C. Waxman & H.J. Walberg), pp. 285– 296. McCutchan, Berkeley, CA.
Fraser B.J. & Fisher D. (1983) Student achievement as a function of person-environment fit: a regression surface analysis.British Journal of Educational Psychology53, 89–99.
Fraser B. J., Fisher D. & McRobbie C. (1996)Development, validation and use of personal and class forms of a new classroom environment instrument. Paper Presented at the Annual Meeting of the American Educational Re-search Association, New York, April.
Fraser B.J. & Maor D. (2000)A learning environment in-strument for evaluating students’ and teachers’ percep-tions of constructivist multimedia learning environments. Paper Presented at the Annual Meeting of the National Association for Research in Science Teaching, New Or-leans, April.
Goh S., Young D. & Fraser B.J. (1995) Psychosocial climate and student outcomes in elementary mathematics class-rooms: a multilevel analysis. The Journal of Experi-mental Education43, 90–93.
Jegede O., Fraser B. & Fisher D. (1995) The development and validation of a distance and open learning environ-ment scale.Educational Technology Research and De-velopment43, 90–93.
Joint Information Systems Committee (JISC) (2004) Effec-tive Practice with e-Learning. Retrieved 3 June 2005 from http://www.henley-cov.ac.uk/public/xfiles/general/ college_support_info/du/ilt/jisc/jisc/html/start_defin.htm. Maor D. & Fraser B.J. (1996) Use of classroom environment perceptions in evaluating inquiry-based computer as-sisted learning.International Journal of Science Educa-tion18, 401–421.
McLoughlin C. & Luca J. (2003) Overcoming ‘‘process-blindness’’ in the design of an online environment: balancing cognitive and psycho-social outcomes. In In-teract, Integrate, Impact: Proceedings of the 20th Annual Conference of the Australasian Society for Computers in Learning in Tertiary Education(eds G. Crisp, D. Thiele, I. Scholten, S. Barker & J. Baron), pp. 332–342, Ade-laide, 7–10 December 2003.
Moos R.H. (1974)The Social Climate Scales: An overview. Consulting Psychologists Press, Palo Alto, CA. Macnish J., Trinidad S., Fisher D. & Aldridge J. (2003)The
online learning environment of a technology-rich sec-ondary college. Paper Presented at the Annual Meeting
of the American Educational Research Association, Chicago, IL, April.
Newby M. & Fisher D. (1997) An instrument for assessing the learning environment of a computer laboratory.Journal of Educational Computing Research16, 179–190. Pearson J. & Trinidad S. (2004) An evaluation of problem
based learning (PBL) as a strategy for designing and implementing an e-learning environment. In Acquiring and Constructing Knowledge Through Human-Computer Interaction: Creating New Visions for the Future of Learning (ed. E. McKay), pp. 1101–1109. RMIT Uni-versity, Melbourne.
Taylor P. & Maor D. (2000) Assessing the efficacy of online teaching with the Constructivist On-Line Learning En-vironment Survey. In Flexible Futures in Tertiary Teaching. Proceedings of the 9th Annual Teaching Learning Forum, 2–4 February (eds A. Herrmann & M.M. Kulski). Curtin University of Technology, Perth Retrieved 10 January 2004 from http://cea.curtin.edu.au/ tlf/tlf2000/taylor.html.
Teh G.P.L. & Fraser B.J. (1995) Development and validation of an instrument for assessing the psychosocial environ-ment of computer-assisted learning classrooms.Journal of Educational Computing Research12, 177–193. Trinidad S., Aldridge J. & Fraser B. (2004) Development
and use of an online learning environment survey. Paper Presented at the Annual Meeting of the American
Educational Research Association, San Diego, CA, April.
Trinidad S., Macnish J., Aldridge J., Fraser B. & Wood D. (2001)Integrating ICT into the learning environment at Sevenoaks Senior College: How teachers and students use educational technology in teaching and learning. Paper presented at the annual conference of the Aus-tralian Association for Research in Education, Perth, Western Australia, December.
Trinidad S. & Pearson J. (2004) Implementing and evalu-ating e-learning environments. In Beyond the Comfort Zone: Proceedings of the 21st ASCILITE Conference, Perth, 5–8 December (eds R. Atkinson, C. McBeath, D. Jonas-Dwyer & R. Phillips), pp. 895–903. Available from http://www.asciliate.org.au/conferences/perth04/ procs/trinidad.htm.
Walberg H.J. (1979)Educational Environments and Effects: Evaluation, Policy and Productivity. McCutchan, Ber-keley, CA.
Walker S. (2002) Insight: distance education learning en-vironments survey(Retrieved 10 January 2004 from http:// insight.southcentralrtec.org/ilib/delesa/delesainfo.html. Zandvliet D. (2003) Learning environments in Malaysian
‘‘Smart School’’ classrooms. Paper Presented at the Annual Meeting of the American Educational Research Association, Chicago, IL, April.